React Native Pure Chart Save
react-native chart library that not using svg or ART but only using react native pure components.
React Native Pure Chart


Pure react native chart library that not using svg or ART but only using react-native components.
(You don't have to import drawing library with react-native link or add ART to your project!)
Demo
-
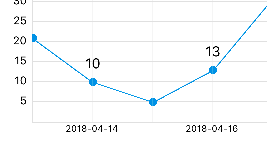
LineChart
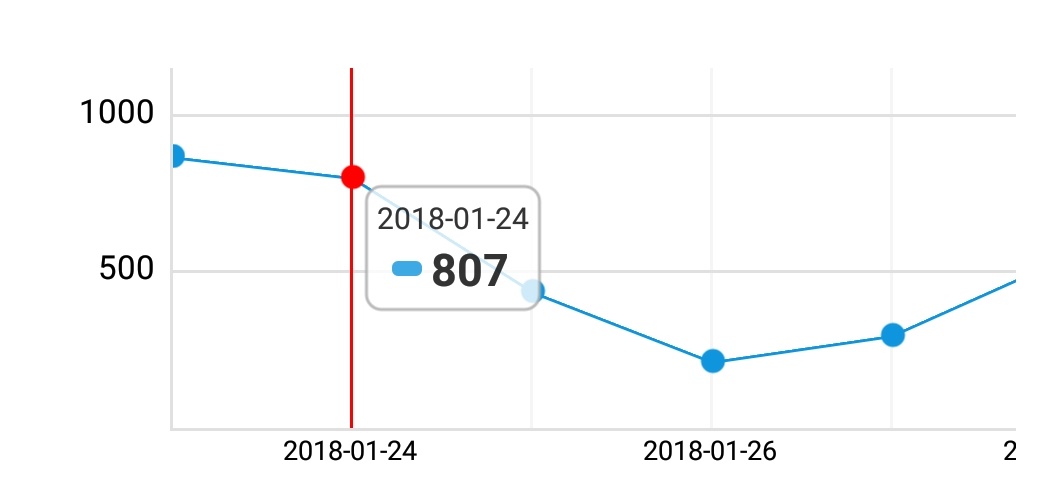
-
LineChart (Multi series)
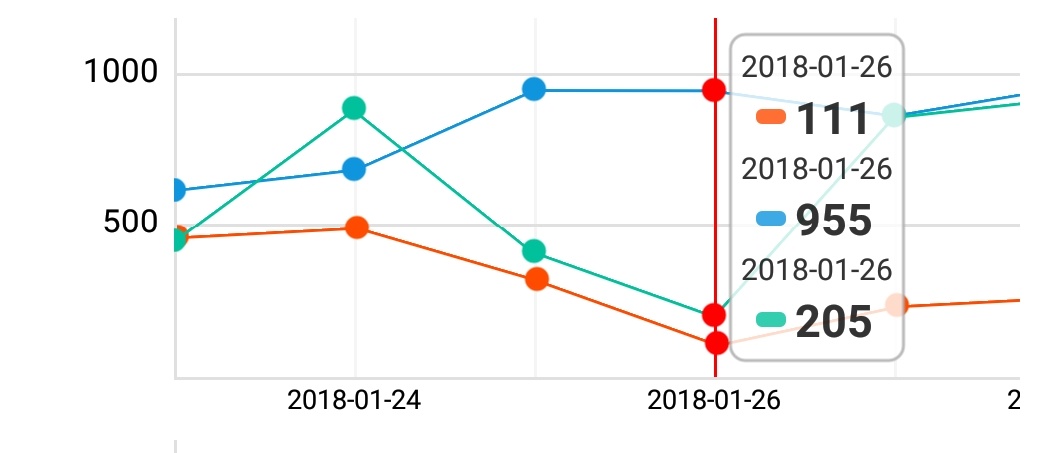
-
BarChart
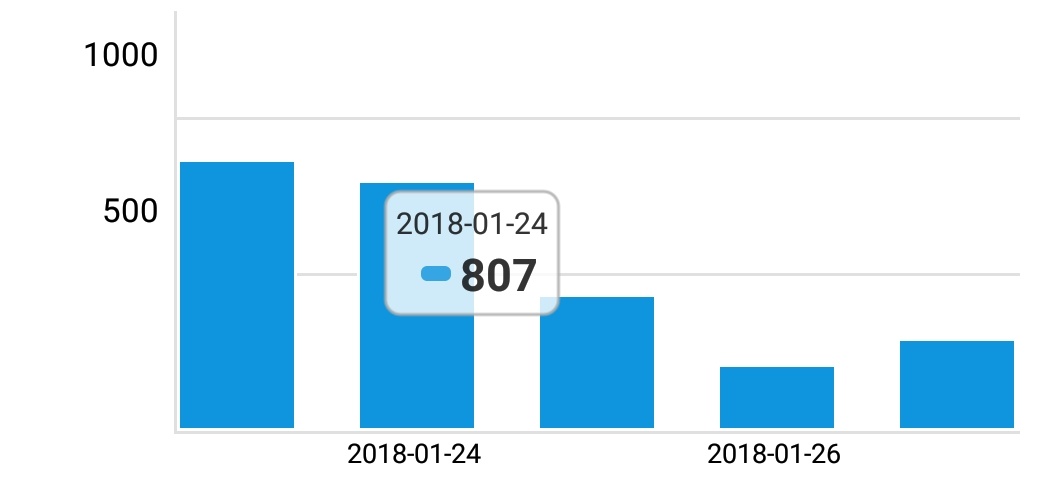
-
BarChart (Multi series)
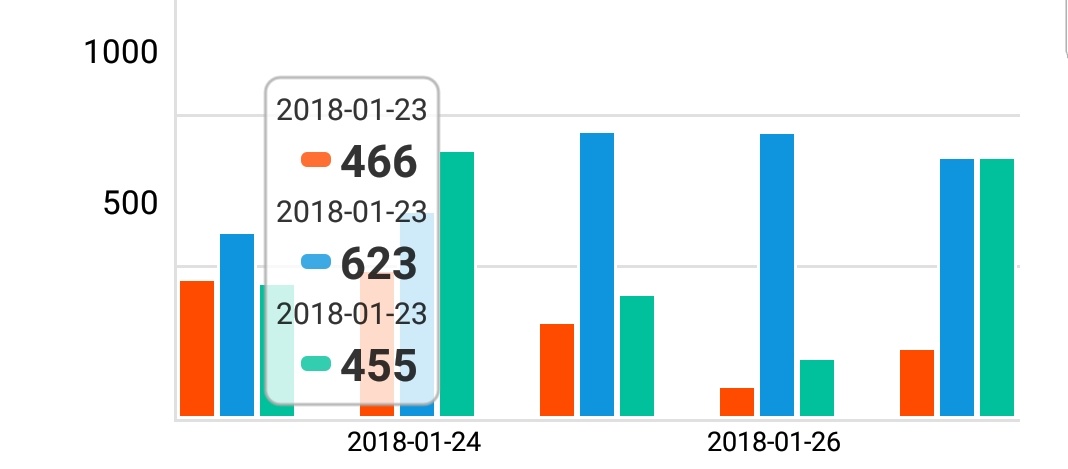
-
PieChart (Beta)

Installation
yarn add react-native-pure-chart
Alternatively with npm:
npm install react-native-pure-chart --save
Required
import PureChart from 'react-native-pure-chart';
Usage
Single Series: Simple
render(
  ...
  let sampleData = [30, 200, 170, 250, 10]
  <PureChart data={sampleData} type='line' />
  ...
);
Single Series: with labels
render(
  ...
  let sampleData = [
      {x: '2018-01-01', y: 30},
      {x: '2018-01-02', y: 200},
      {x: '2018-01-03', y: 170},
      {x: '2018-01-04', y: 250},
      {x: '2018-01-05', y: 10}
  ]
  <PureChart data={sampleData} type='line' />
  ...
);
Multi Series: Simple
render(
  ...
  let sampleData = [
      [
        {seriesName: 'series1', data: [30, 200, 170, 250, 10], color: '#297AB1'},
        {seriesName: 'series2', data: [20, 100, 150, 130, 15], color: 'yellow'}
      ]
  ]
  <PureChart data={sampleData} type='line' />
  ...
);
Multi Series: with labels
render(
  ...
  let sampleData = [
    {
      seriesName: 'series1',
      data: [
        {x: '2018-02-01', y: 30},
        {x: '2018-02-02', y: 200},
        {x: '2018-02-03', y: 170},
        {x: '2018-02-04', y: 250},
        {x: '2018-02-05', y: 10}
      ],
      color: '#297AB1'
    },
    {
      seriesName: 'series2',
      data: [
        {x: '2018-02-01', y: 20},
        {x: '2018-02-02', y: 100},
        {x: '2018-02-03', y: 140},
        {x: '2018-02-04', y: 550},
        {x: '2018-02-05', y: 40}
      ],
      color: 'yellow'
    }
  ]
  <PureChart data={sampleData} type='line' />
  ...
);
Pie chart
render(
  ...
  let sampleData = [
    {
      value: 50,
      label: 'Marketing',
      color: 'red',
    }, {
      value: 40,
      label: 'Sales',
      color: 'blue'
    }, {
      value: 25,
      label: 'Support',
      color: 'green'
    }

  ]
  <PureChart data={sampleData} type='pie' />
  ...
);
Props
type: string
type of chart. ['line' | 'bar' | 'pie'] is now available
height: number
height of chart
data: array
data for chart
  var data = [30, 200, 170, 250, 10]
  var dataWithLabel = [
    {x: '2017-10-01', y: 30},
    {x: '2017-10-02', y: 200},
    {x: '2017-10-03', y: 170} ...
  ]
multi series data for chart
  var data = [
    {seriesName: 'series1', data: [30, 200, 170, 250, 10], color: '#297AB1'},
    {seriesName: 'series2', data: [40, 250, 110, 290, 14], color: 'blue'}
  ]
  var dataWithLabel = [
    {
      seriesName: 'series1',
      data:[
        {x: '2017-10-01', y: 30},
        {x: '2017-10-02', y: 200},
        {x: '2017-10-03', y: 170} ...
      ],
      color: '#297AB1'
    },
    ....
  ]
customValueRenderer: func
add custom value on the point
  <PureChart type={'line'}
    data={data}
    width={'100%'}
    height={200}
    customValueRenderer={(index, point) => {
      if (index % 2 === 0) return null
      return (
        <Text style={{textAlign: 'center'}}>{point.y}</Text>
      )
    }}/>
numberOfYAxisGuideLine: number
set number of Y Axis guide line
Contributing
Contributions are welcome. Any kind of contribution, such as writing a documentation, bug fix, or solving issues are helpful.
The master branch of this repository contains the latest stable release of react-native-pure-chart. In general, pull requests should be submitted from a separate branch starting from the develop branch.
License
MIT
