Z3tt TidyTuesday Save
My contributions to the #TidyTuesday challenge, a weekly data visualization challenge. All plots are 💯 created in R with ggplot2.
#TidyTuesday Contributions
![]()
![]()
![]()
![]()
![]()
![]()

My contributions to the #TidyTuesday challenge, a weekly social data project that focusses on understanding how to summarize and arrange data to make meaningful and/or beautiful charts with {ggplot2}, {tidyr}, {dplyr} and other tools that are part of the {tidyverse} ecosystem. The project was founded in 2018 by Thomas Mock and organized by the R4DS ("R for Data Science") online learning community. The intent is to provide a safe and supportive forum to practice their wrangling and data visualization skills.
DISCLAIMER:
❌ no Illustrator or Photoshop was harmed during the making of these visualizations.
💯 certified ggplot quality.
Contributions in chronological order (click to expand)
-
Challenges 2018
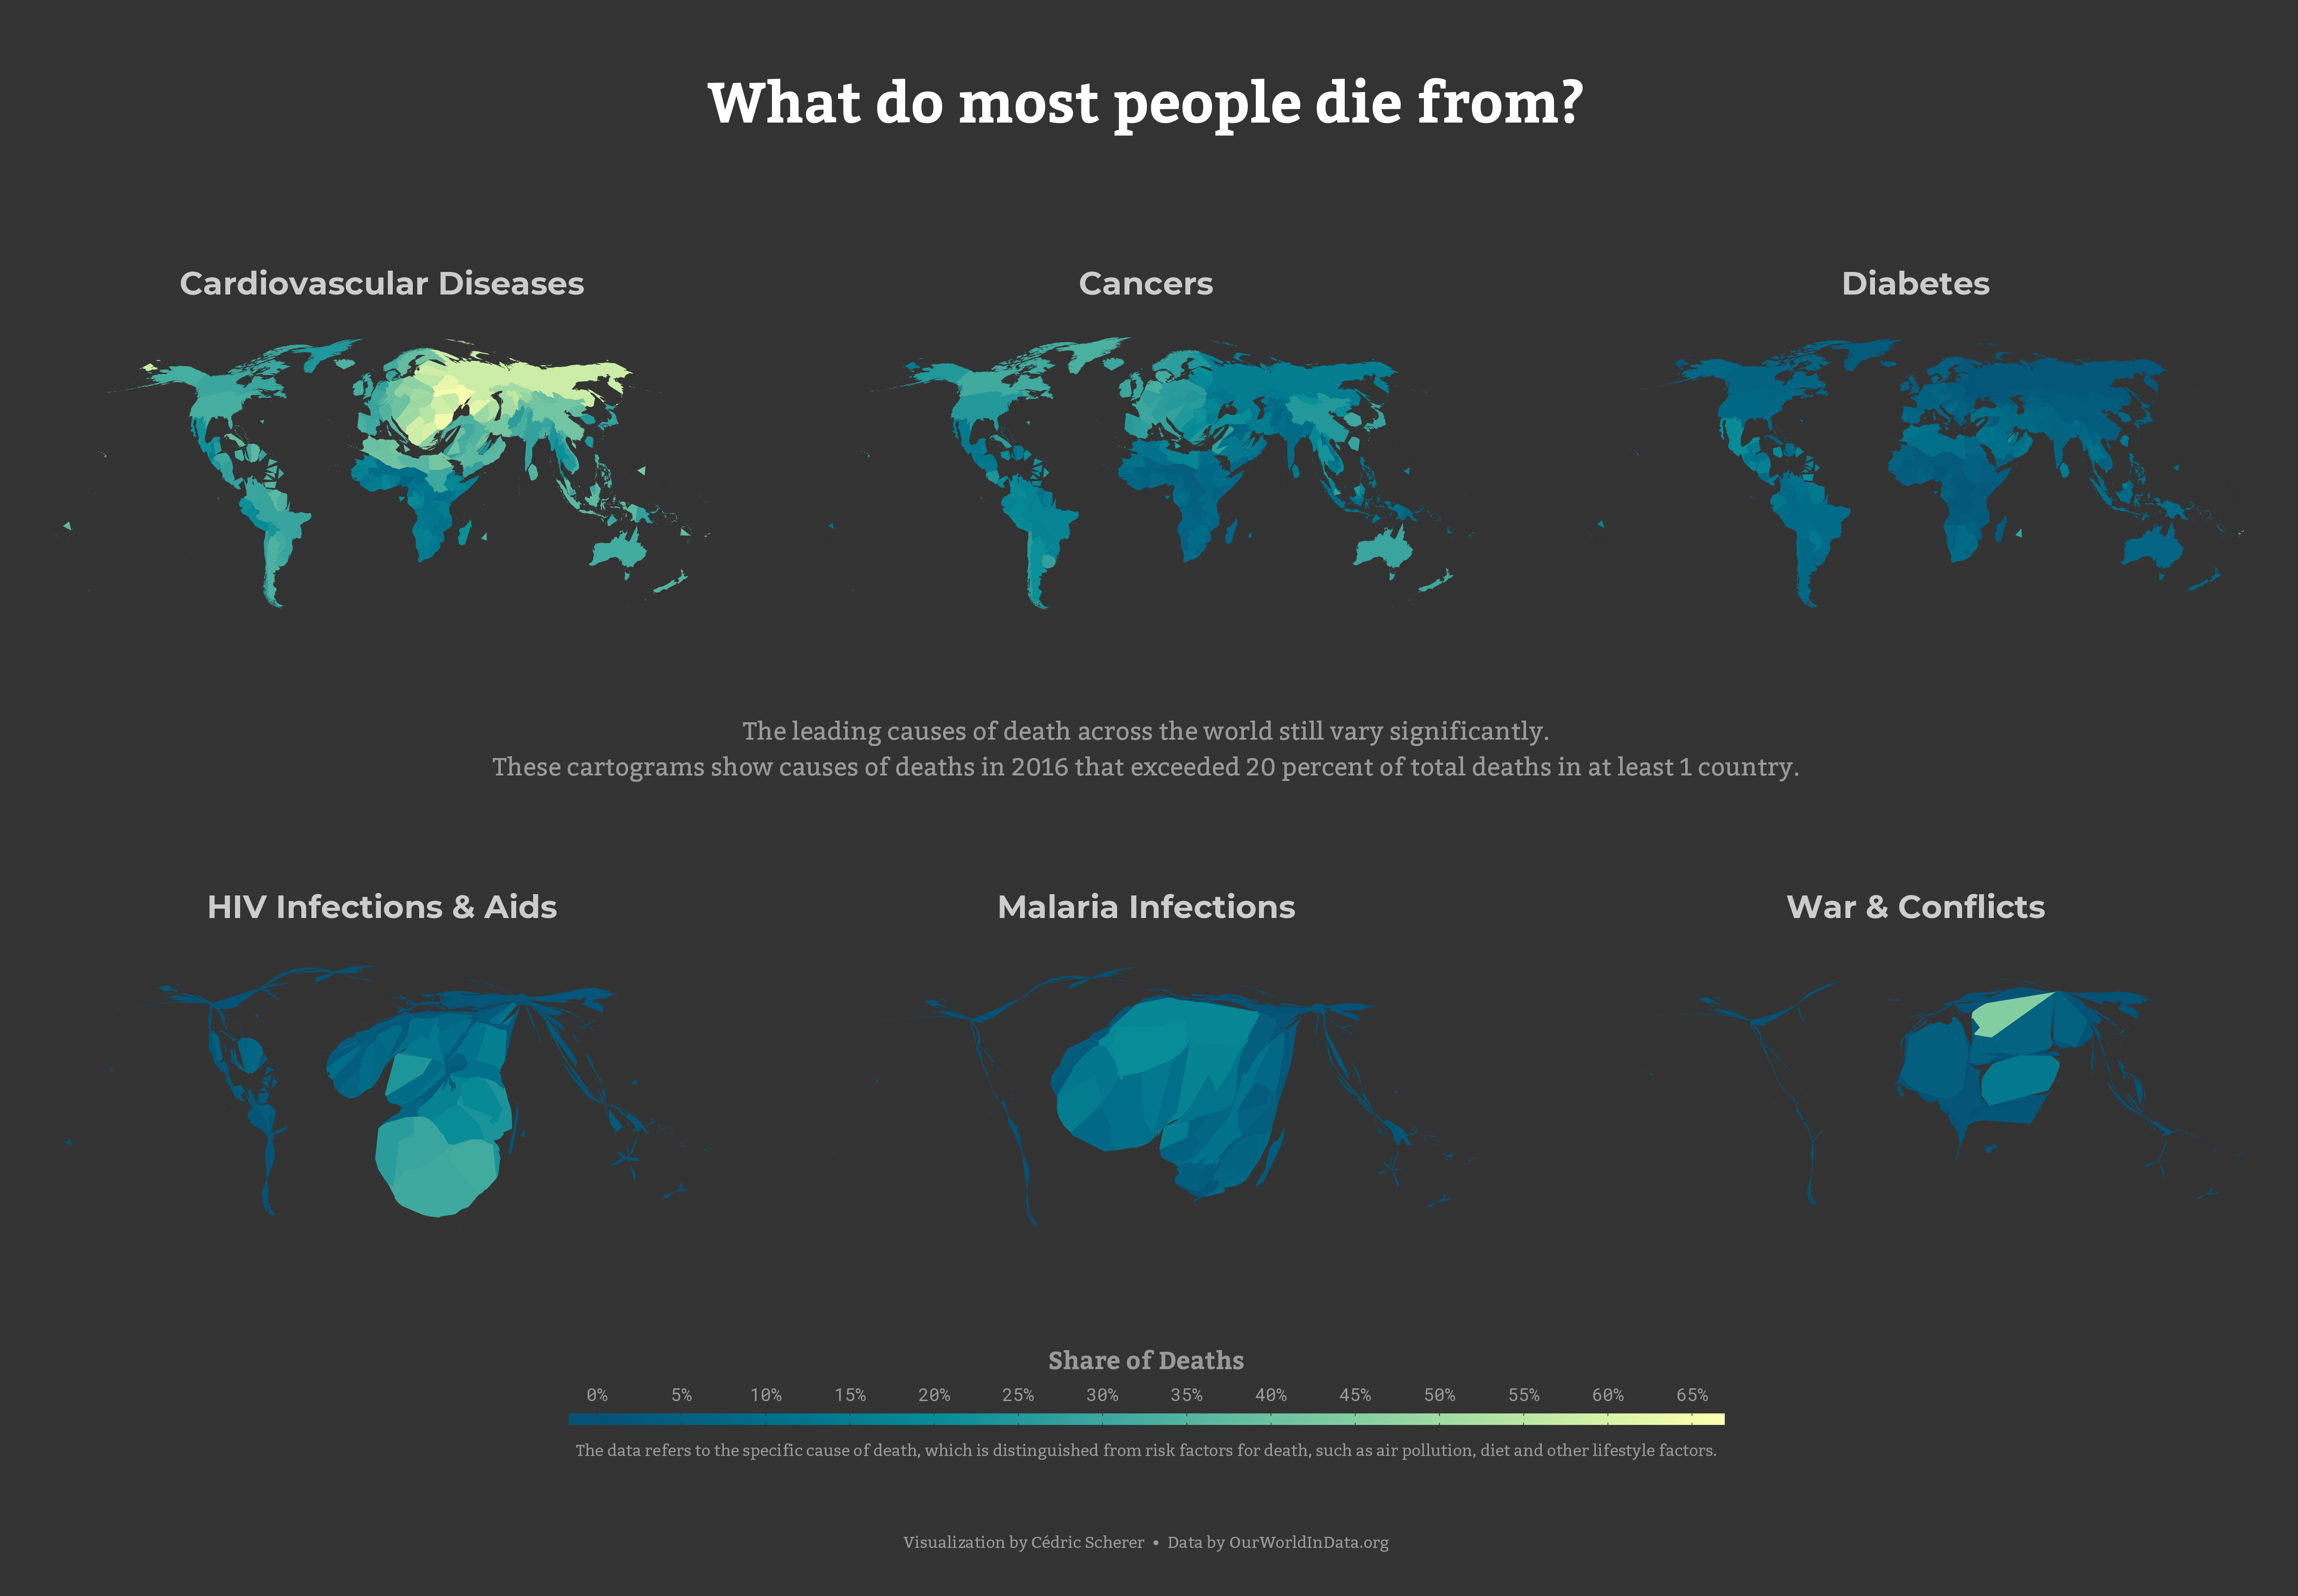
- 2018/03 ⚱️ Global Mortality
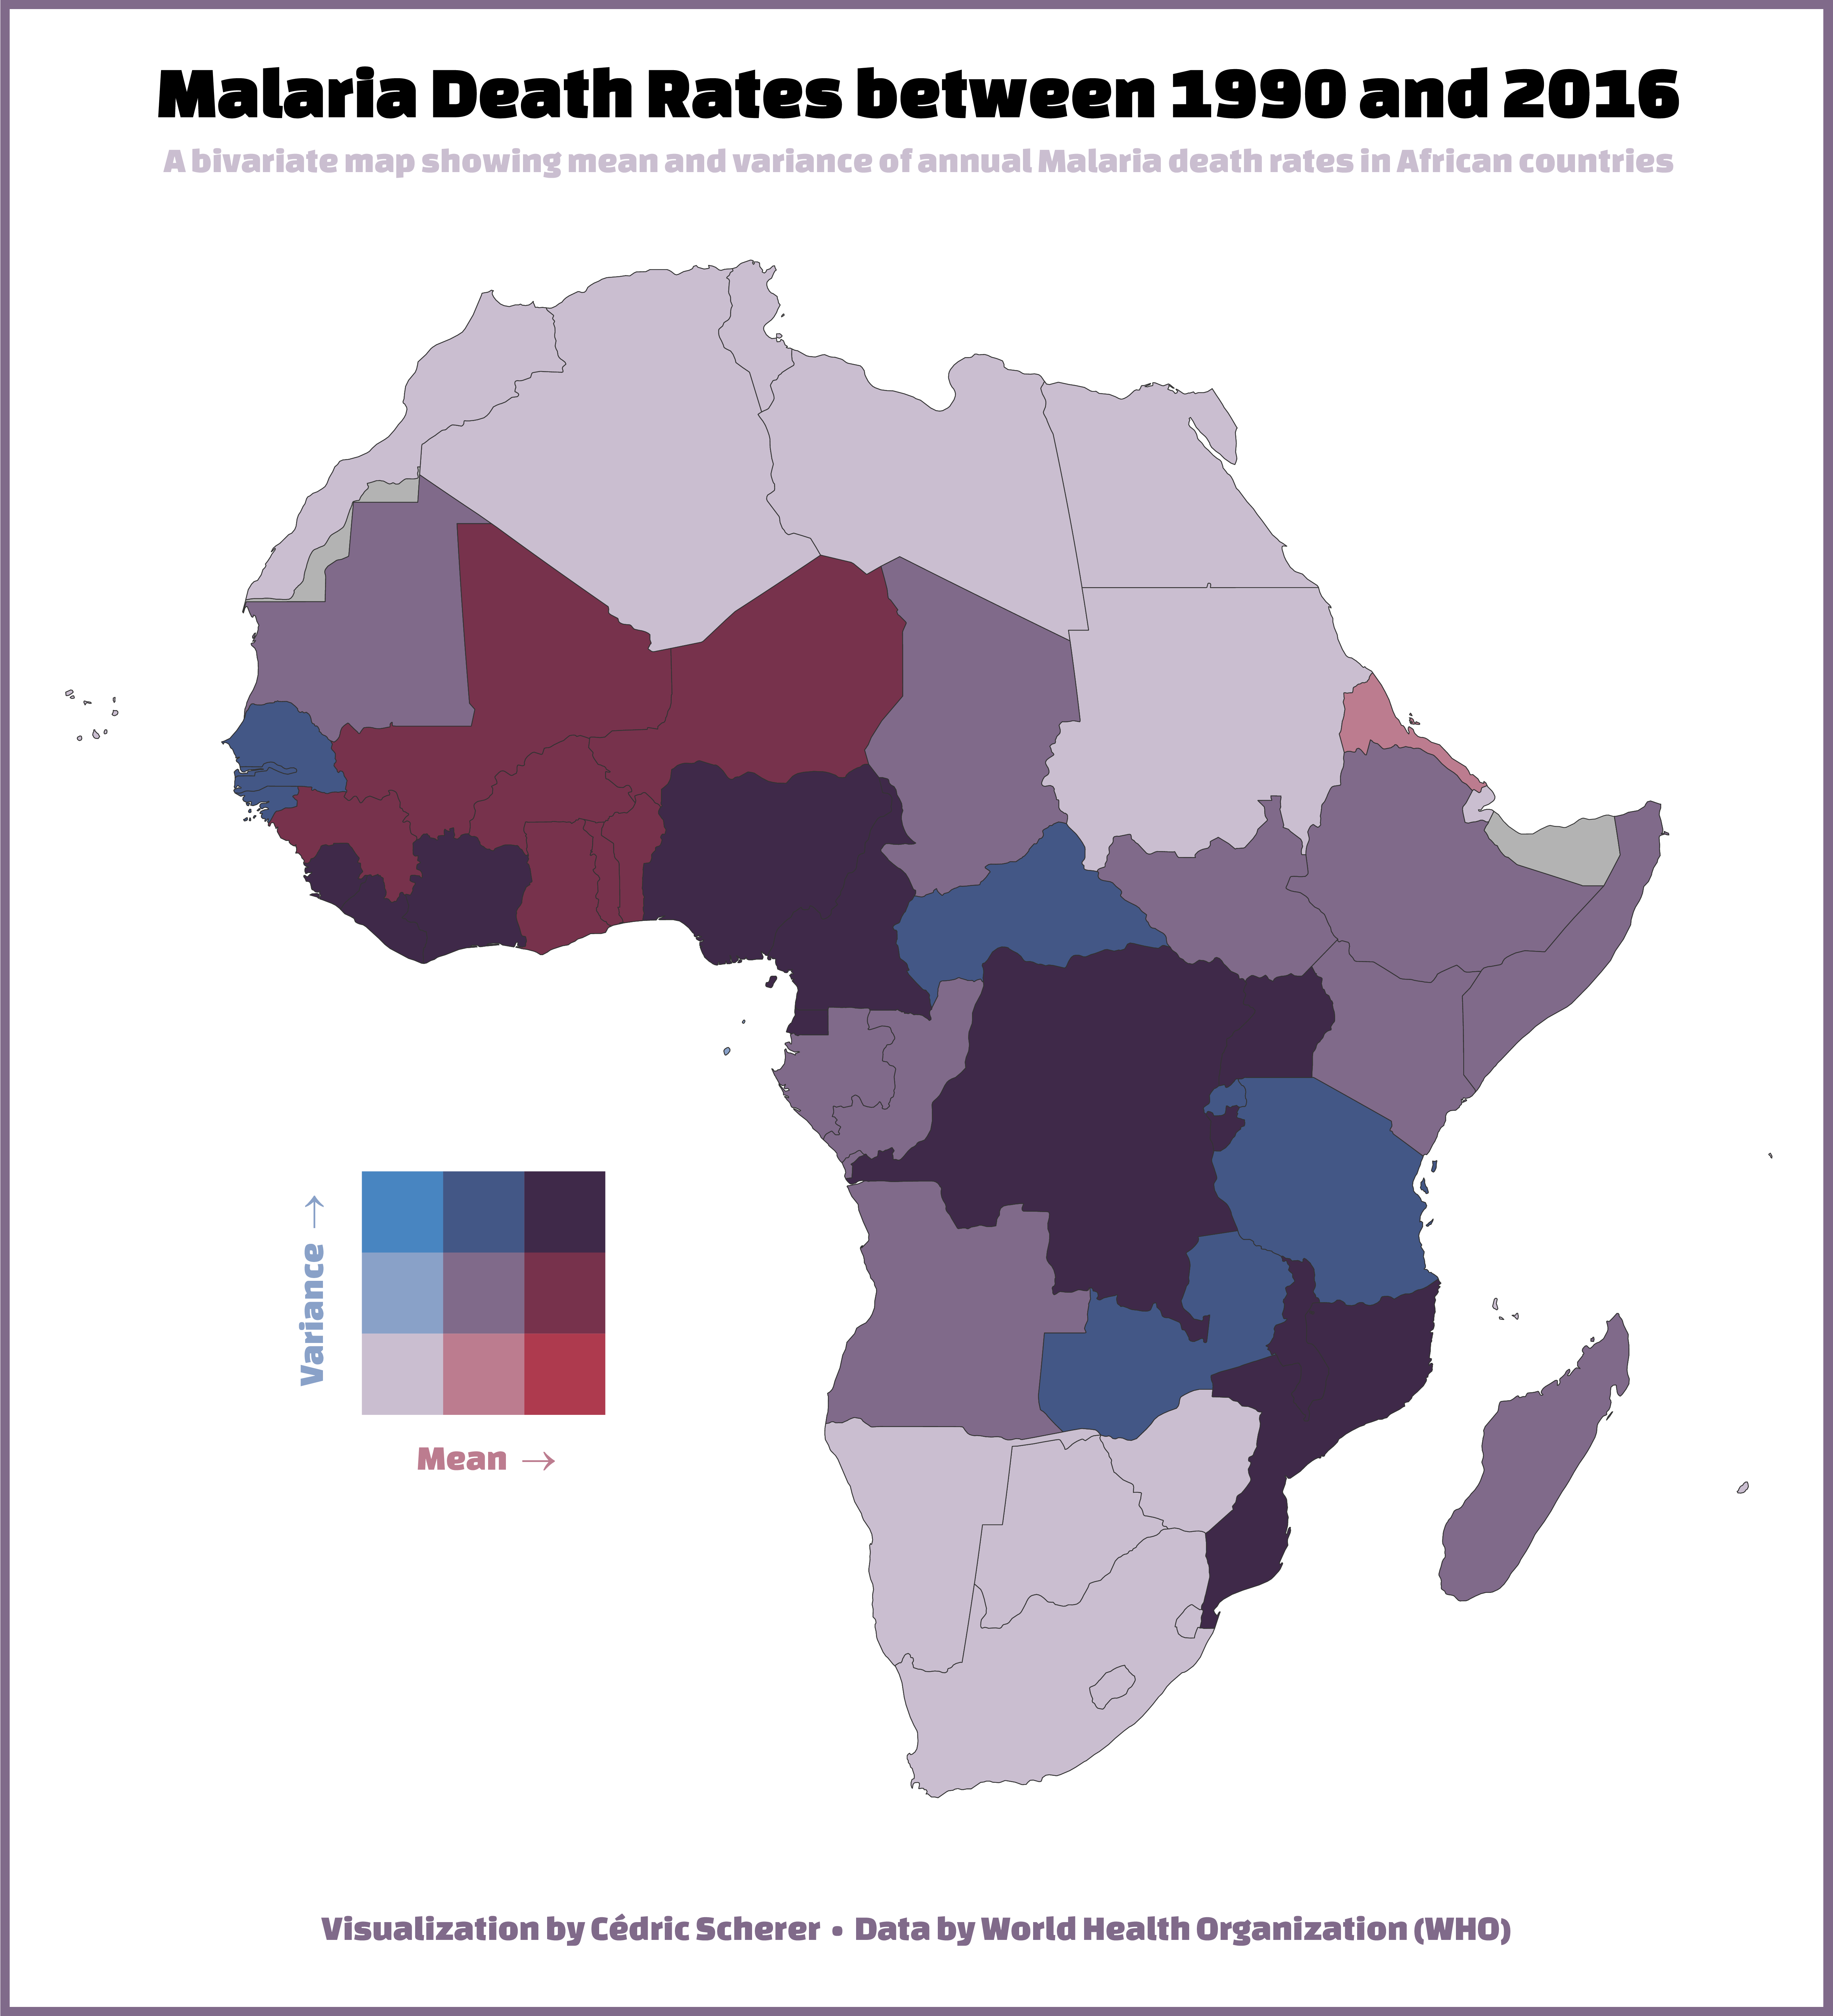
- 2018/33 🏥 Malaria
-
Challenges 2019
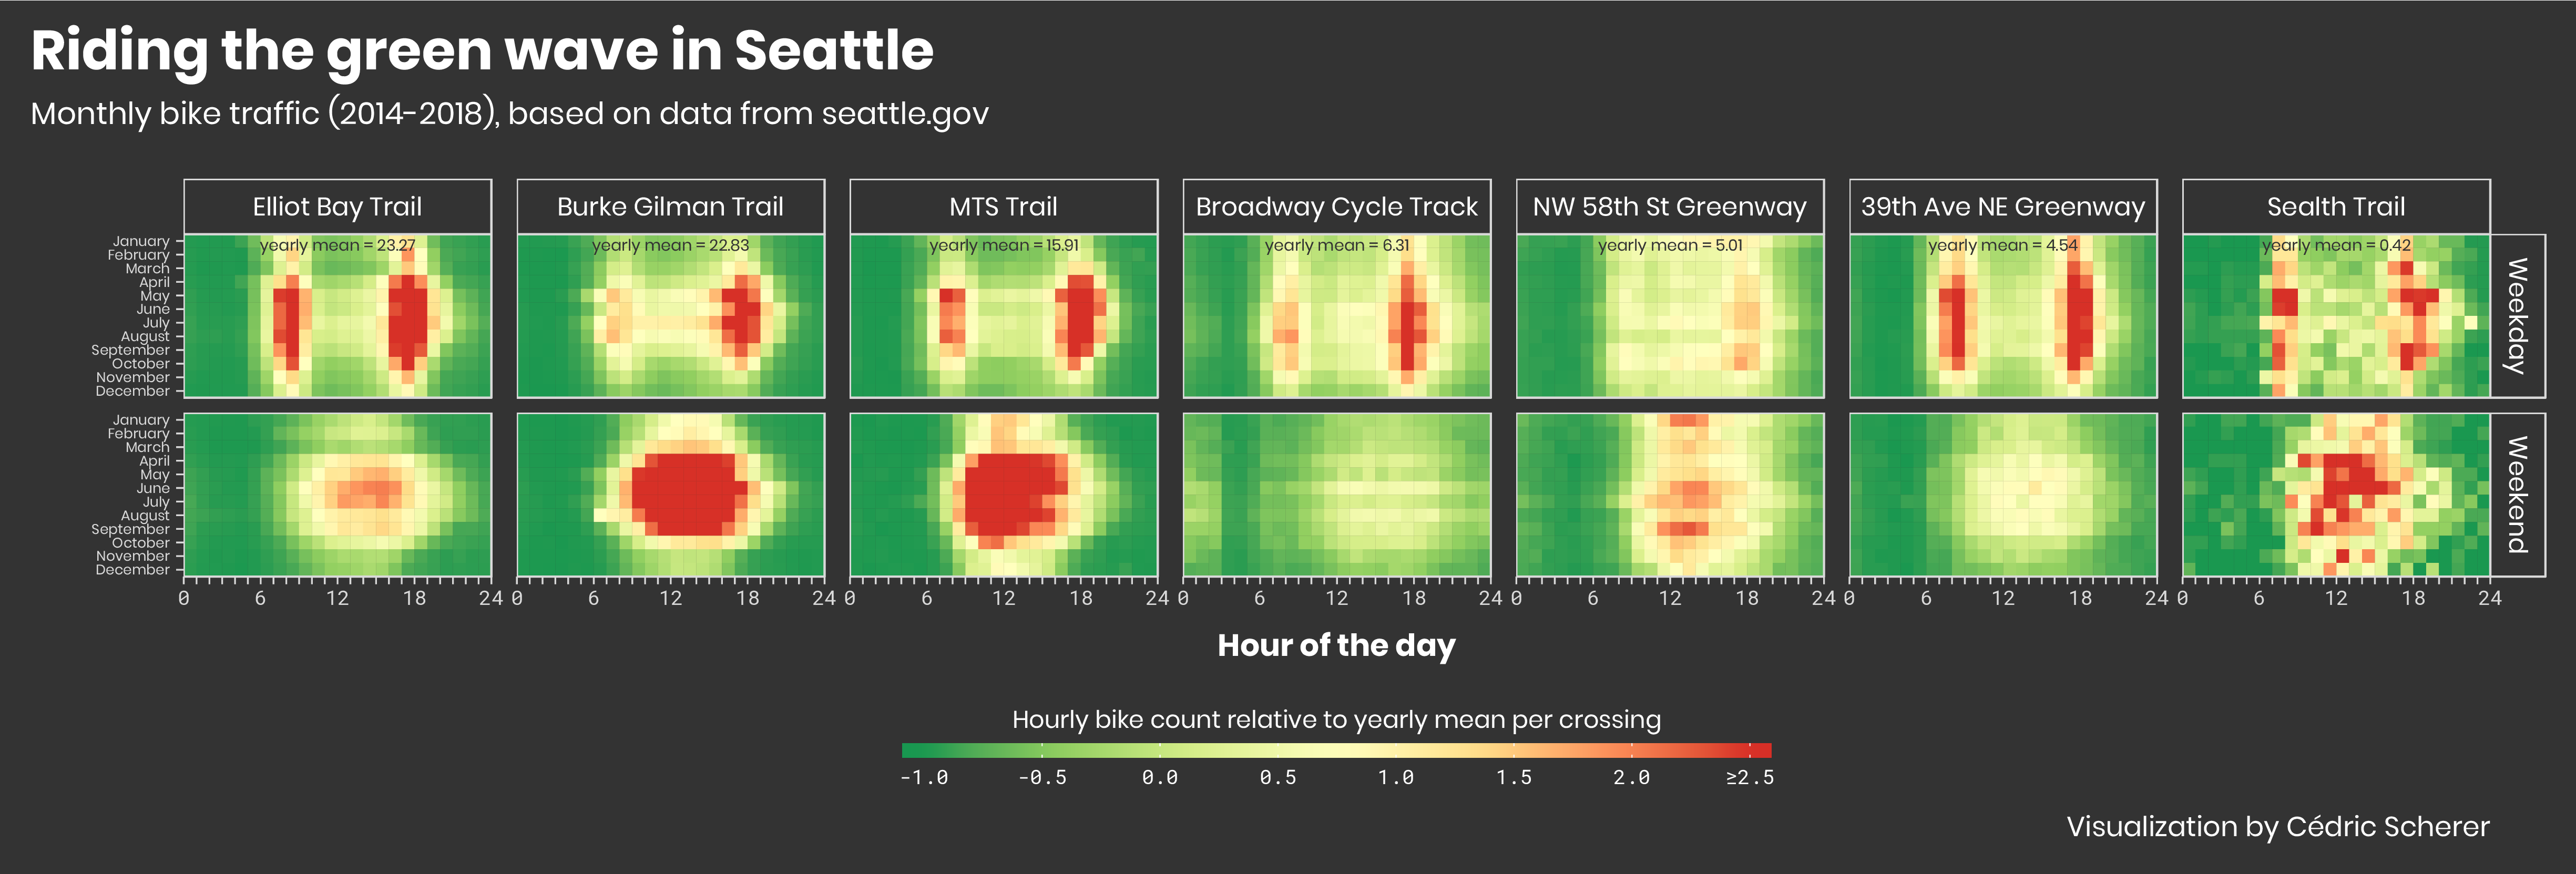
- 2019/14 🚴 Seattle Bike Traffic️
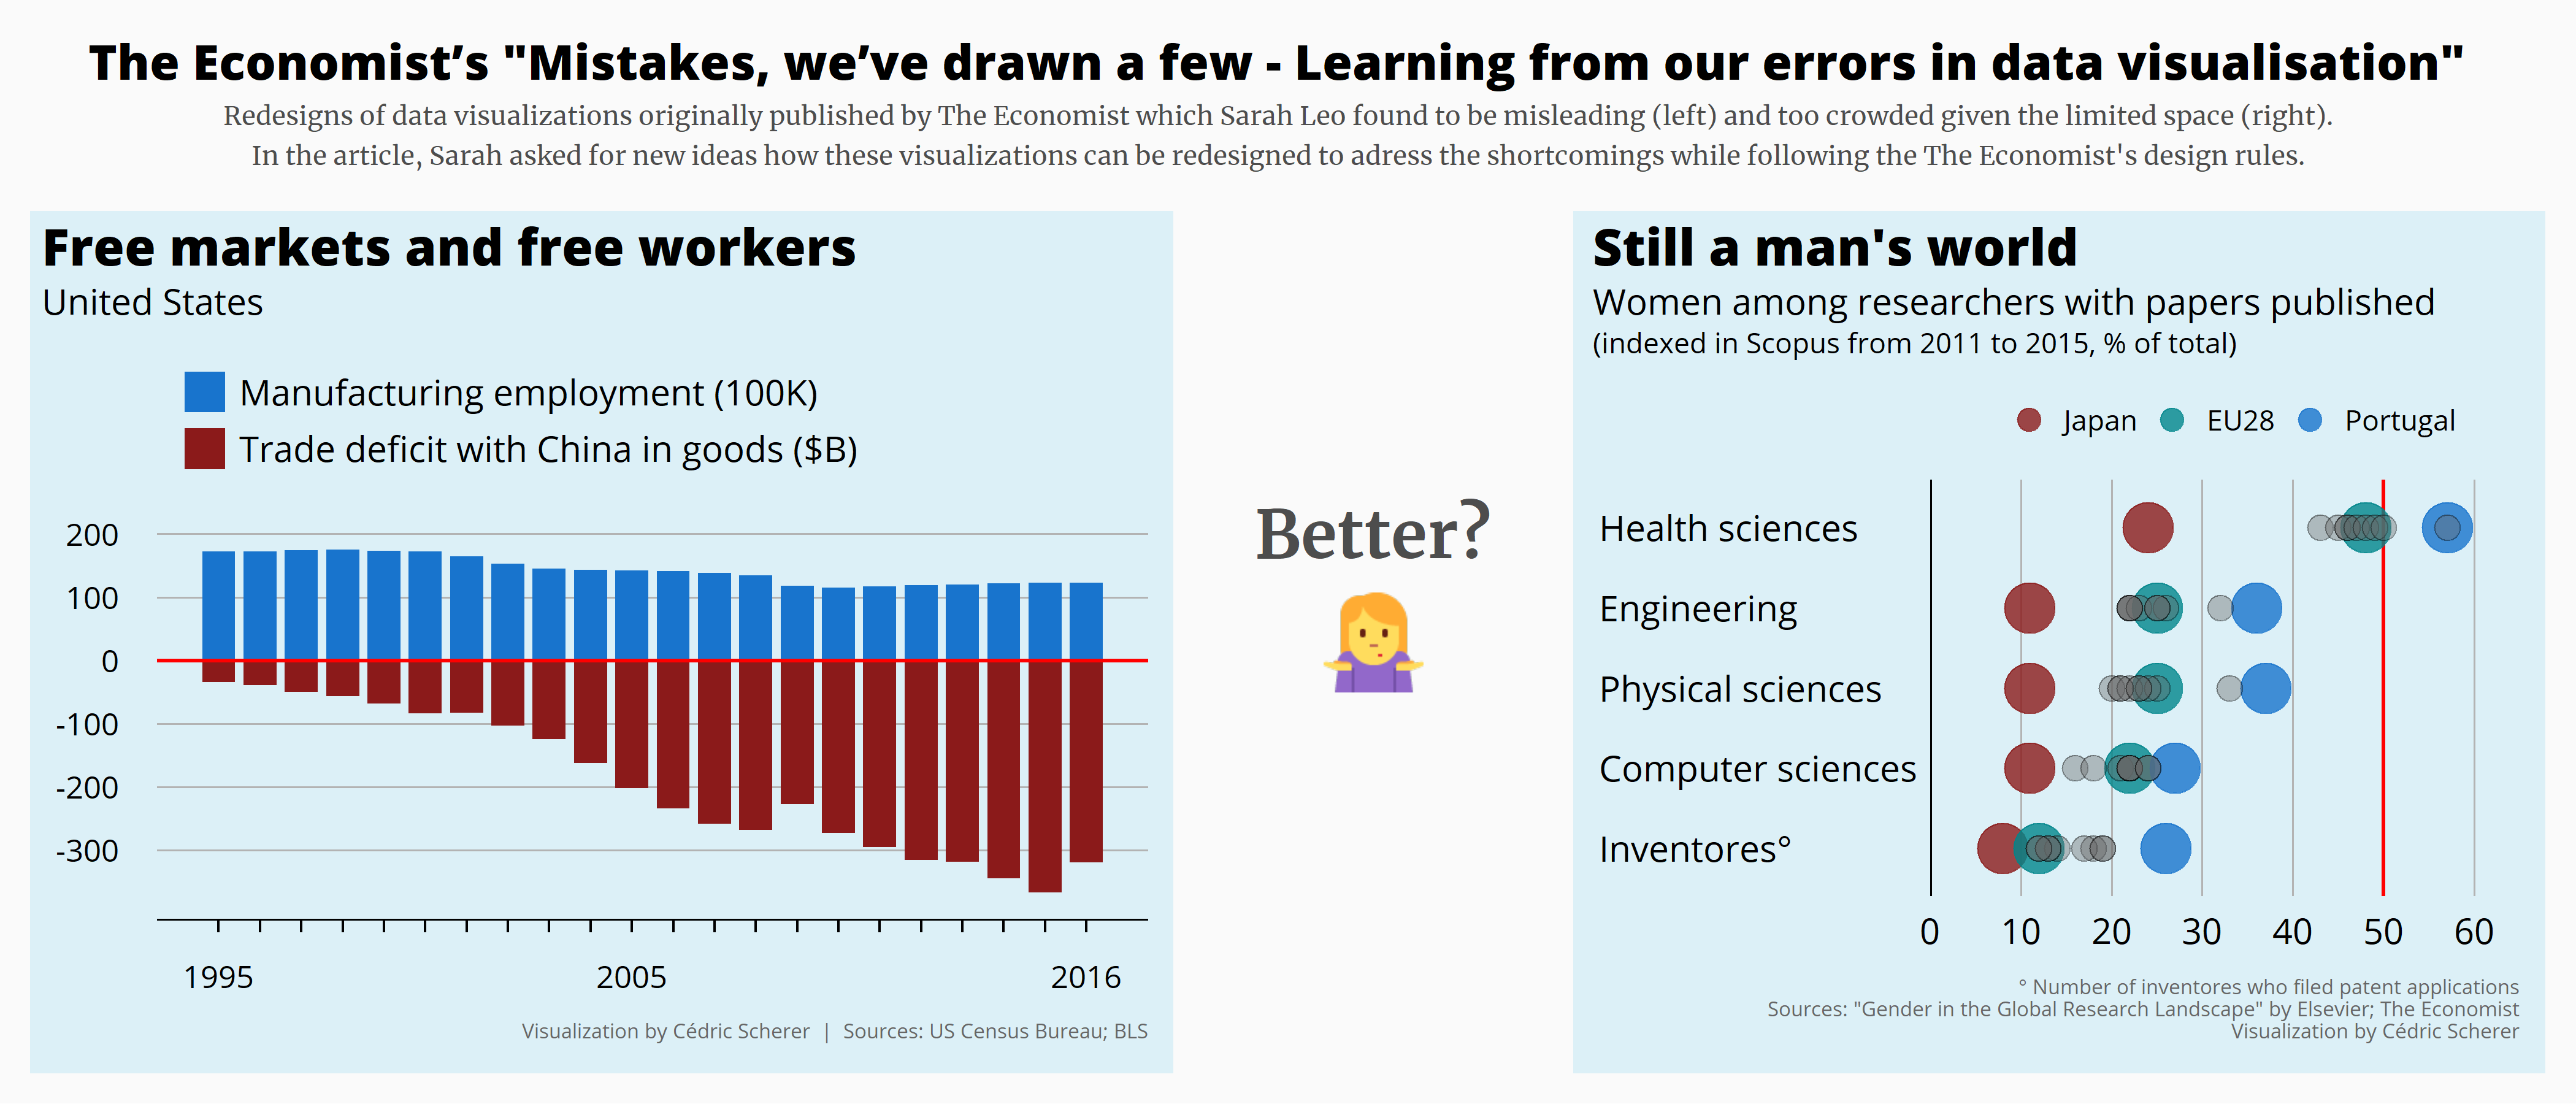
- 2019/16 📊 The Economists' Data Viz Mistakes️
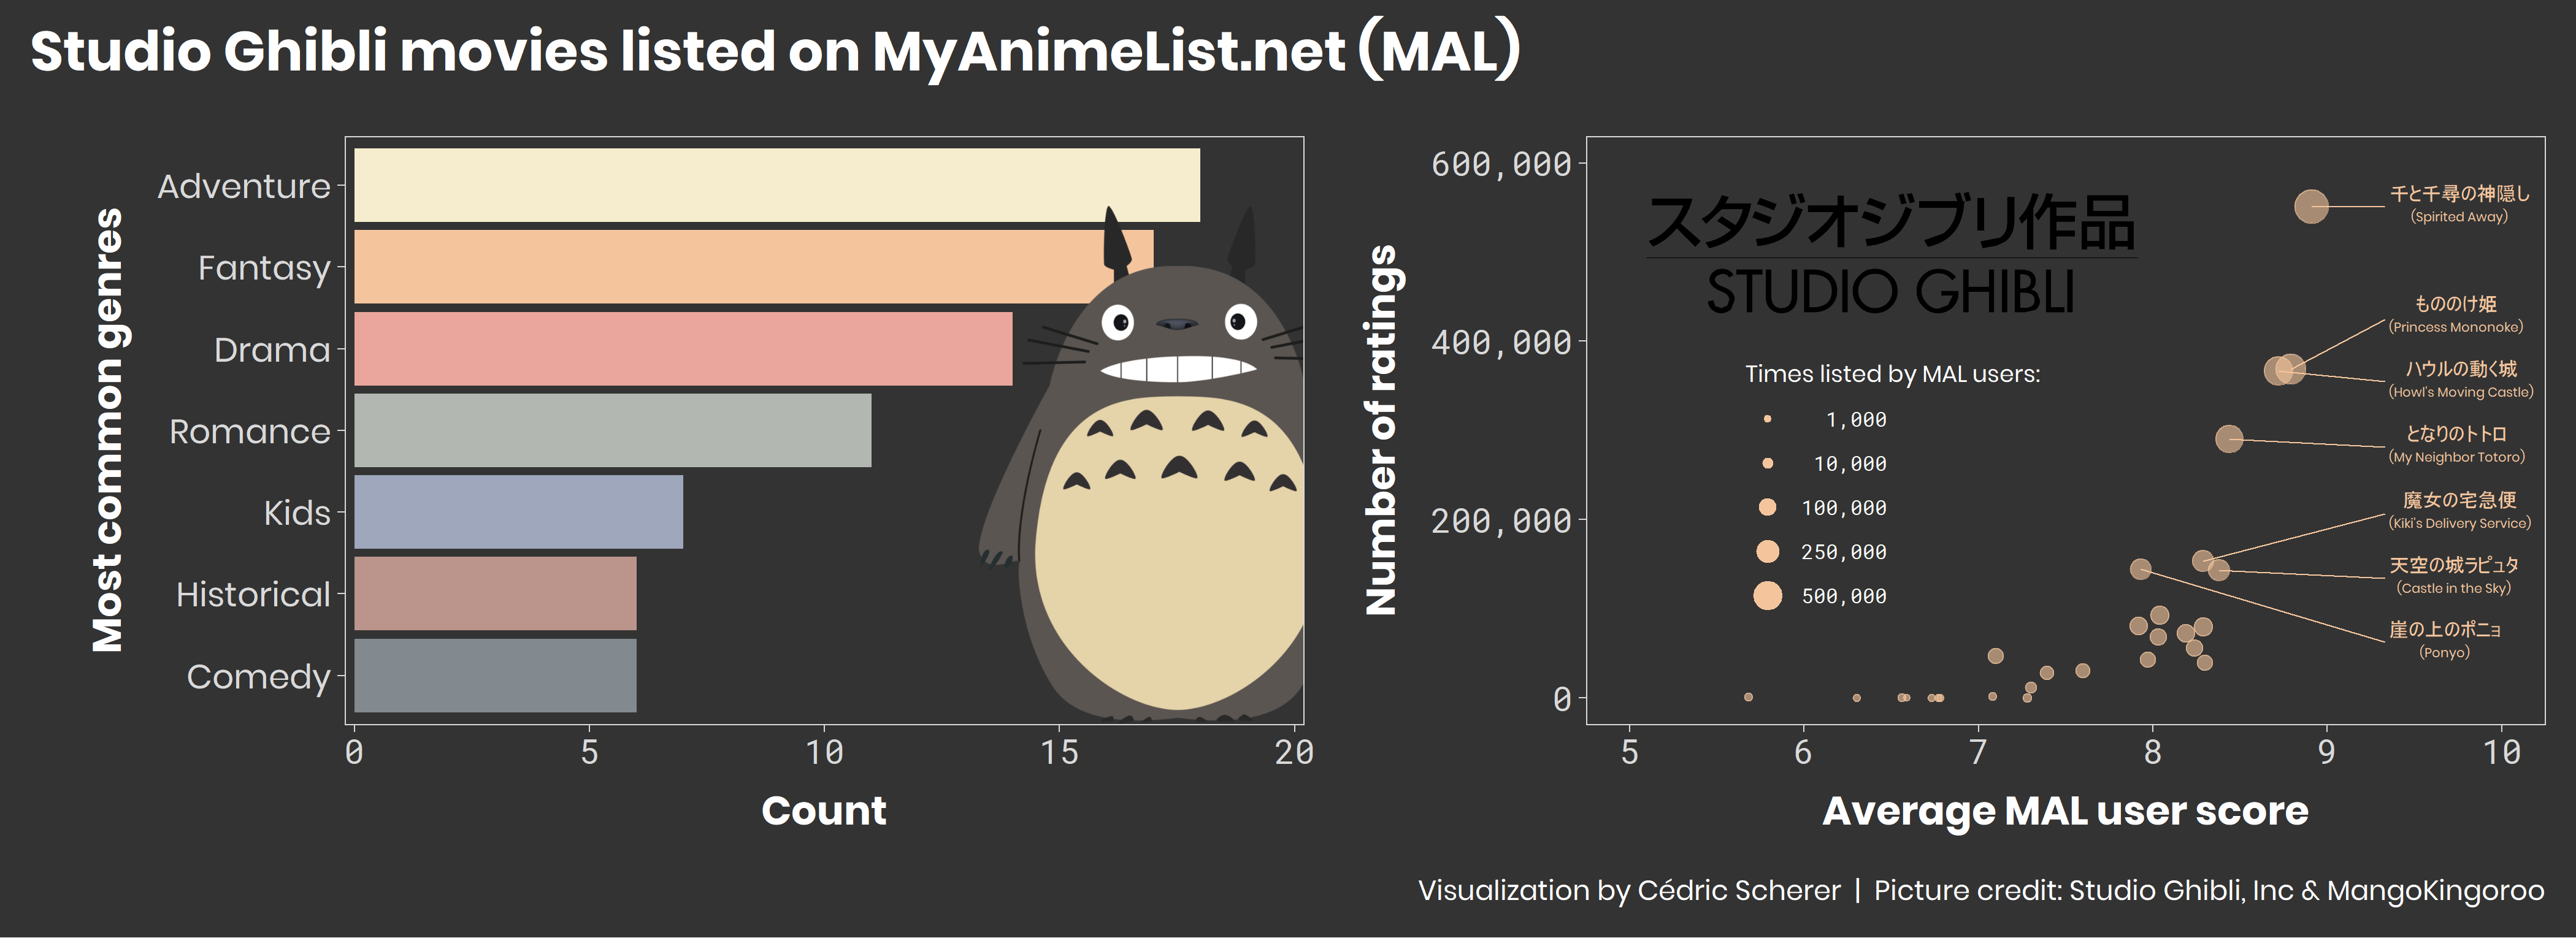
- 2019/17 🐉 Anime Data
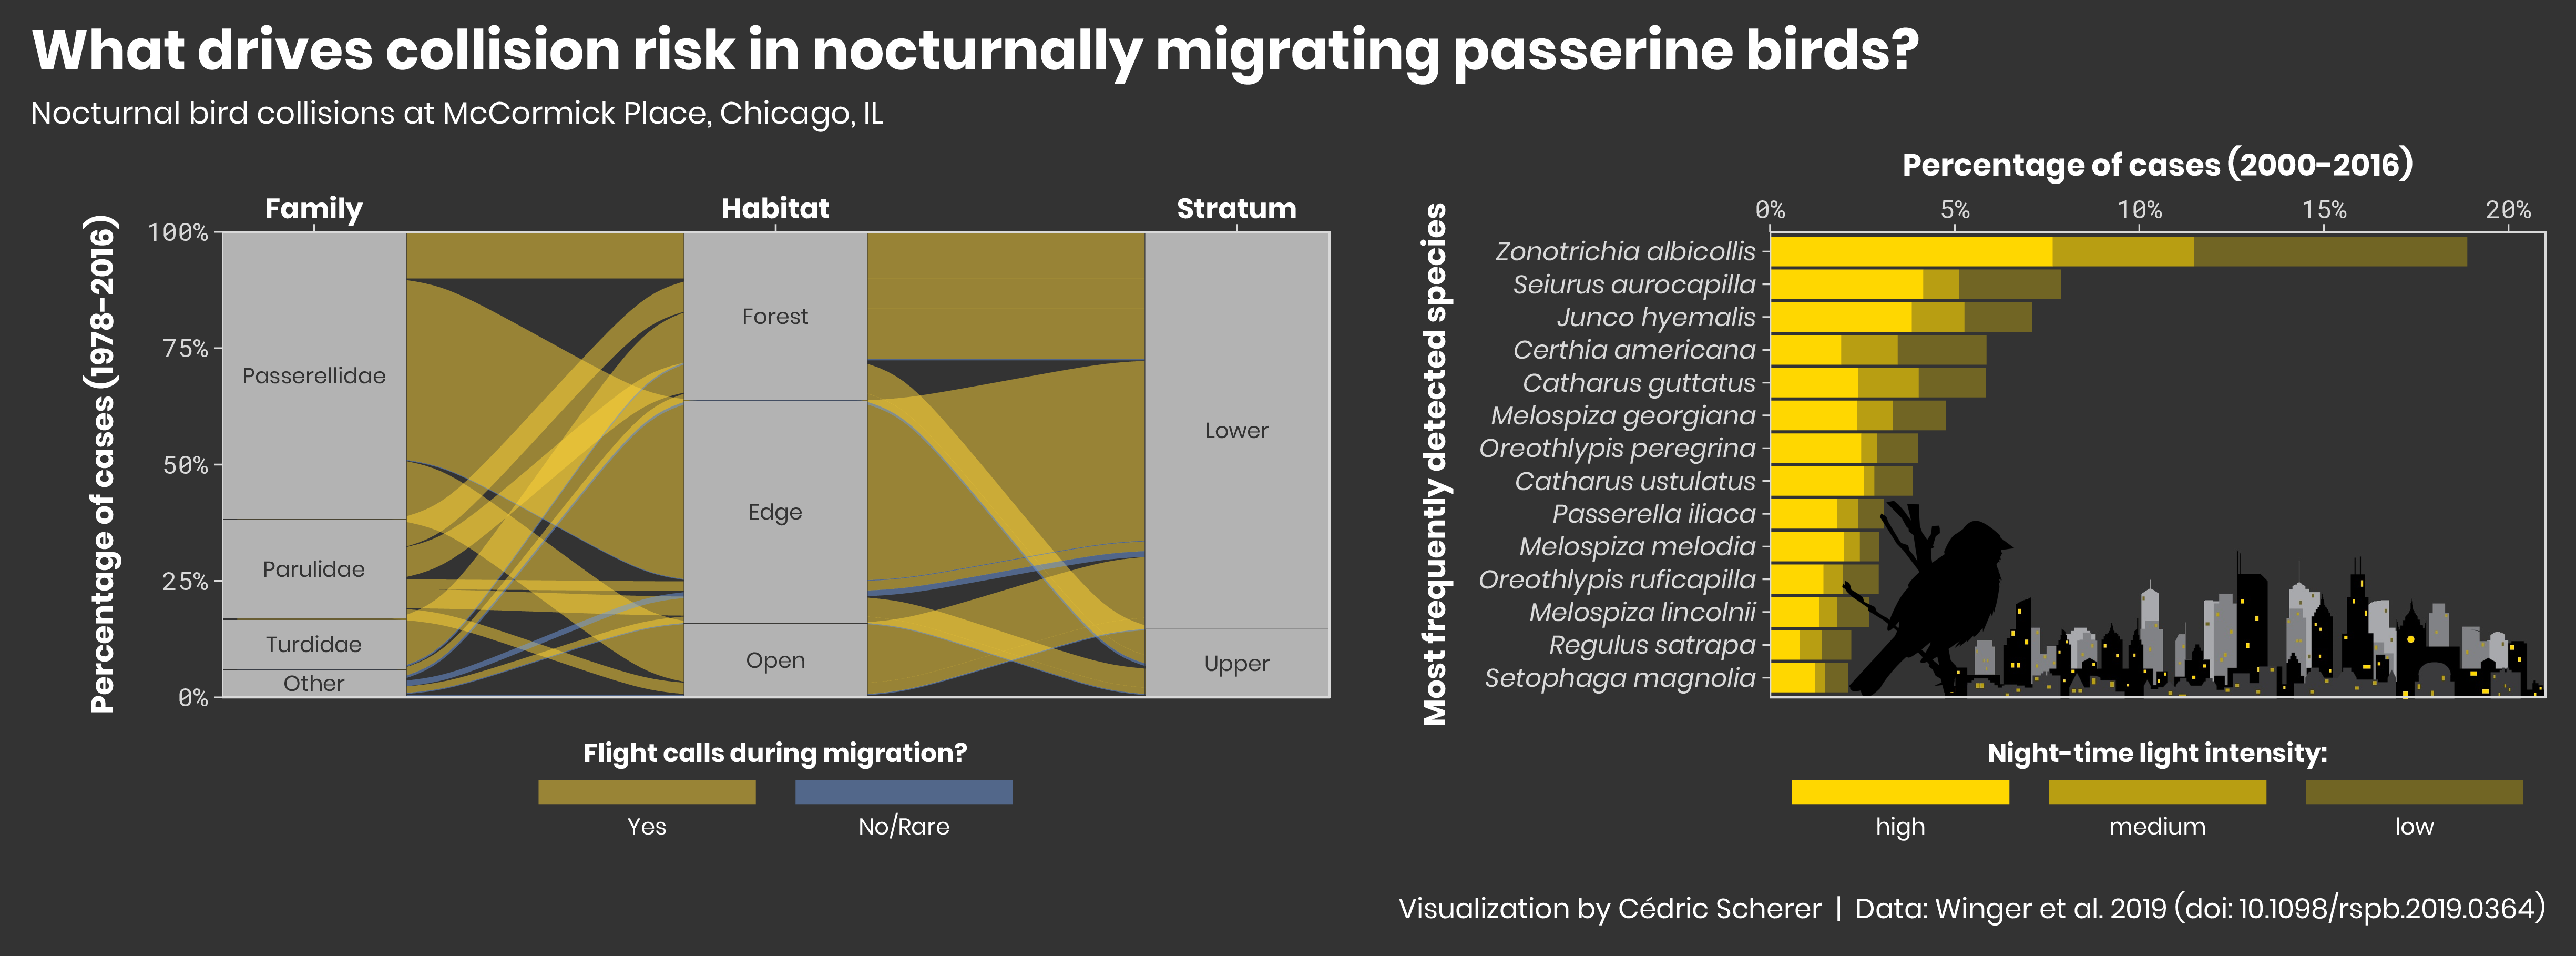
- 2019/18 🐥 Chicago Bird Collisions️
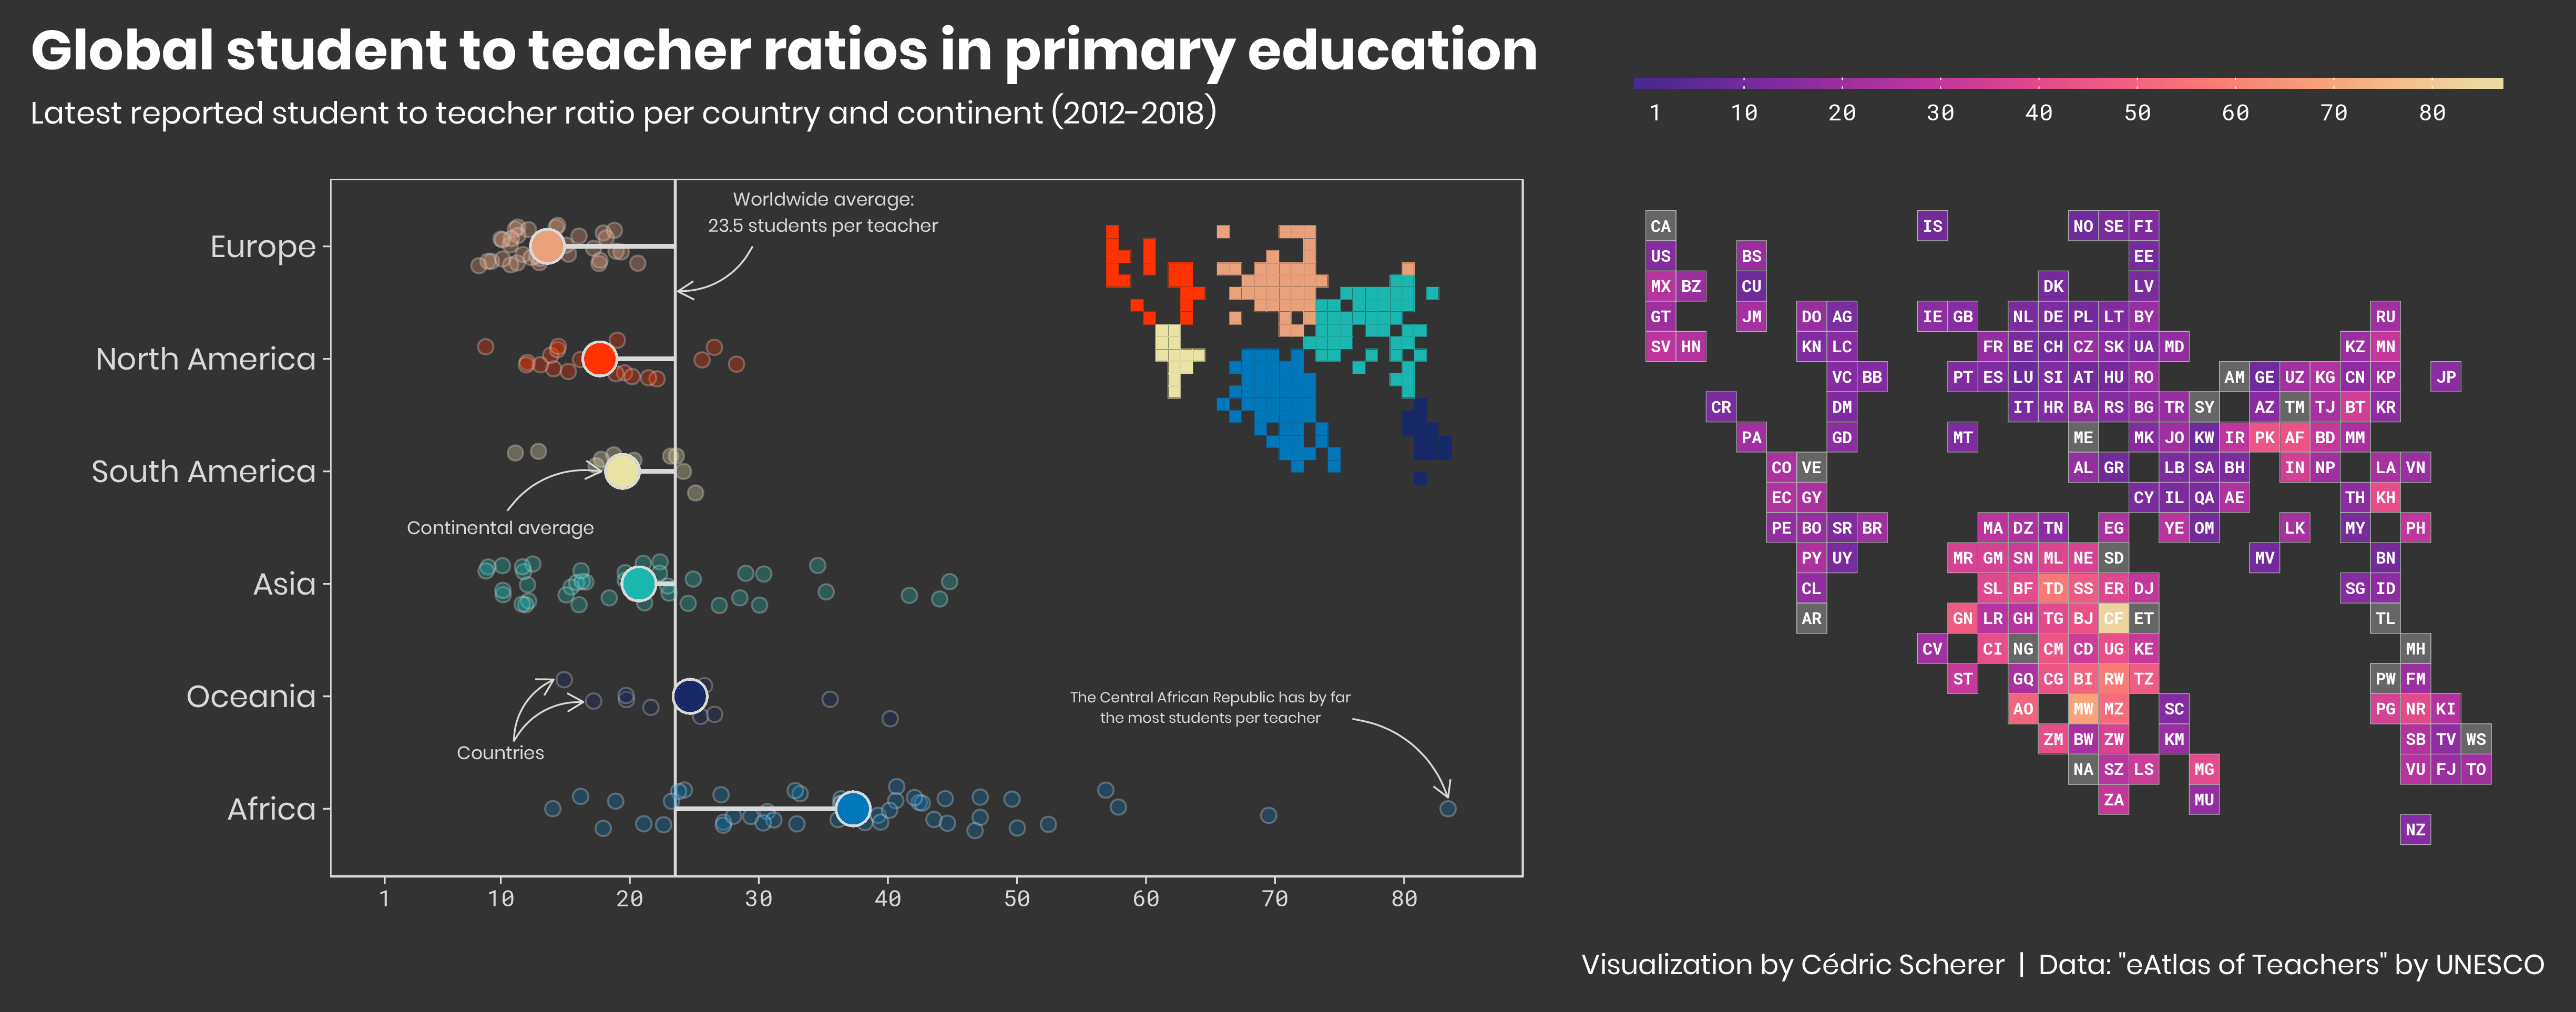
- 2019/19 👨🏫 Global Student to Teachers Ratios️
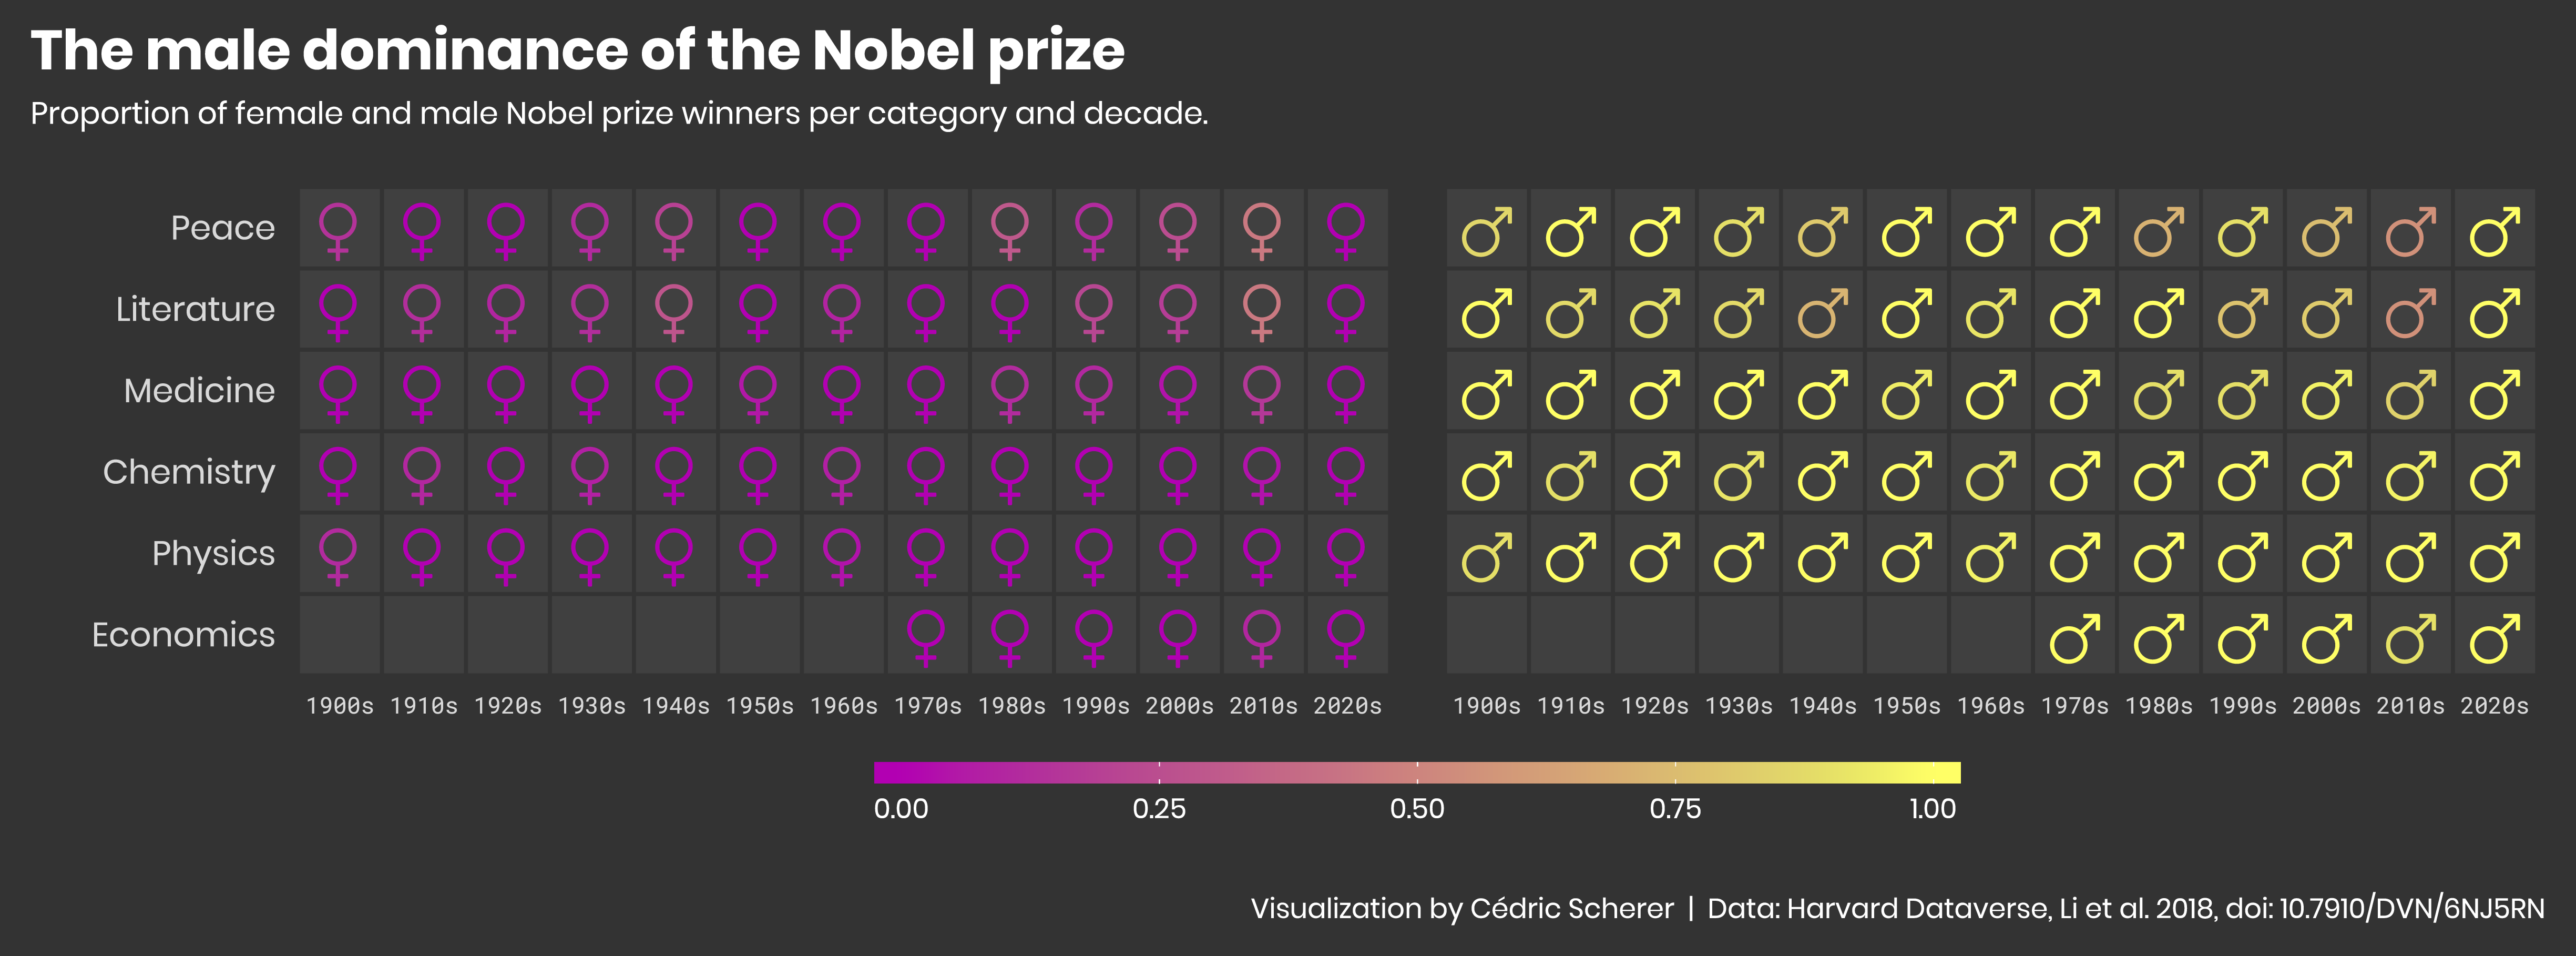
- 2019/20 🎖️ Nobel Prize Winners
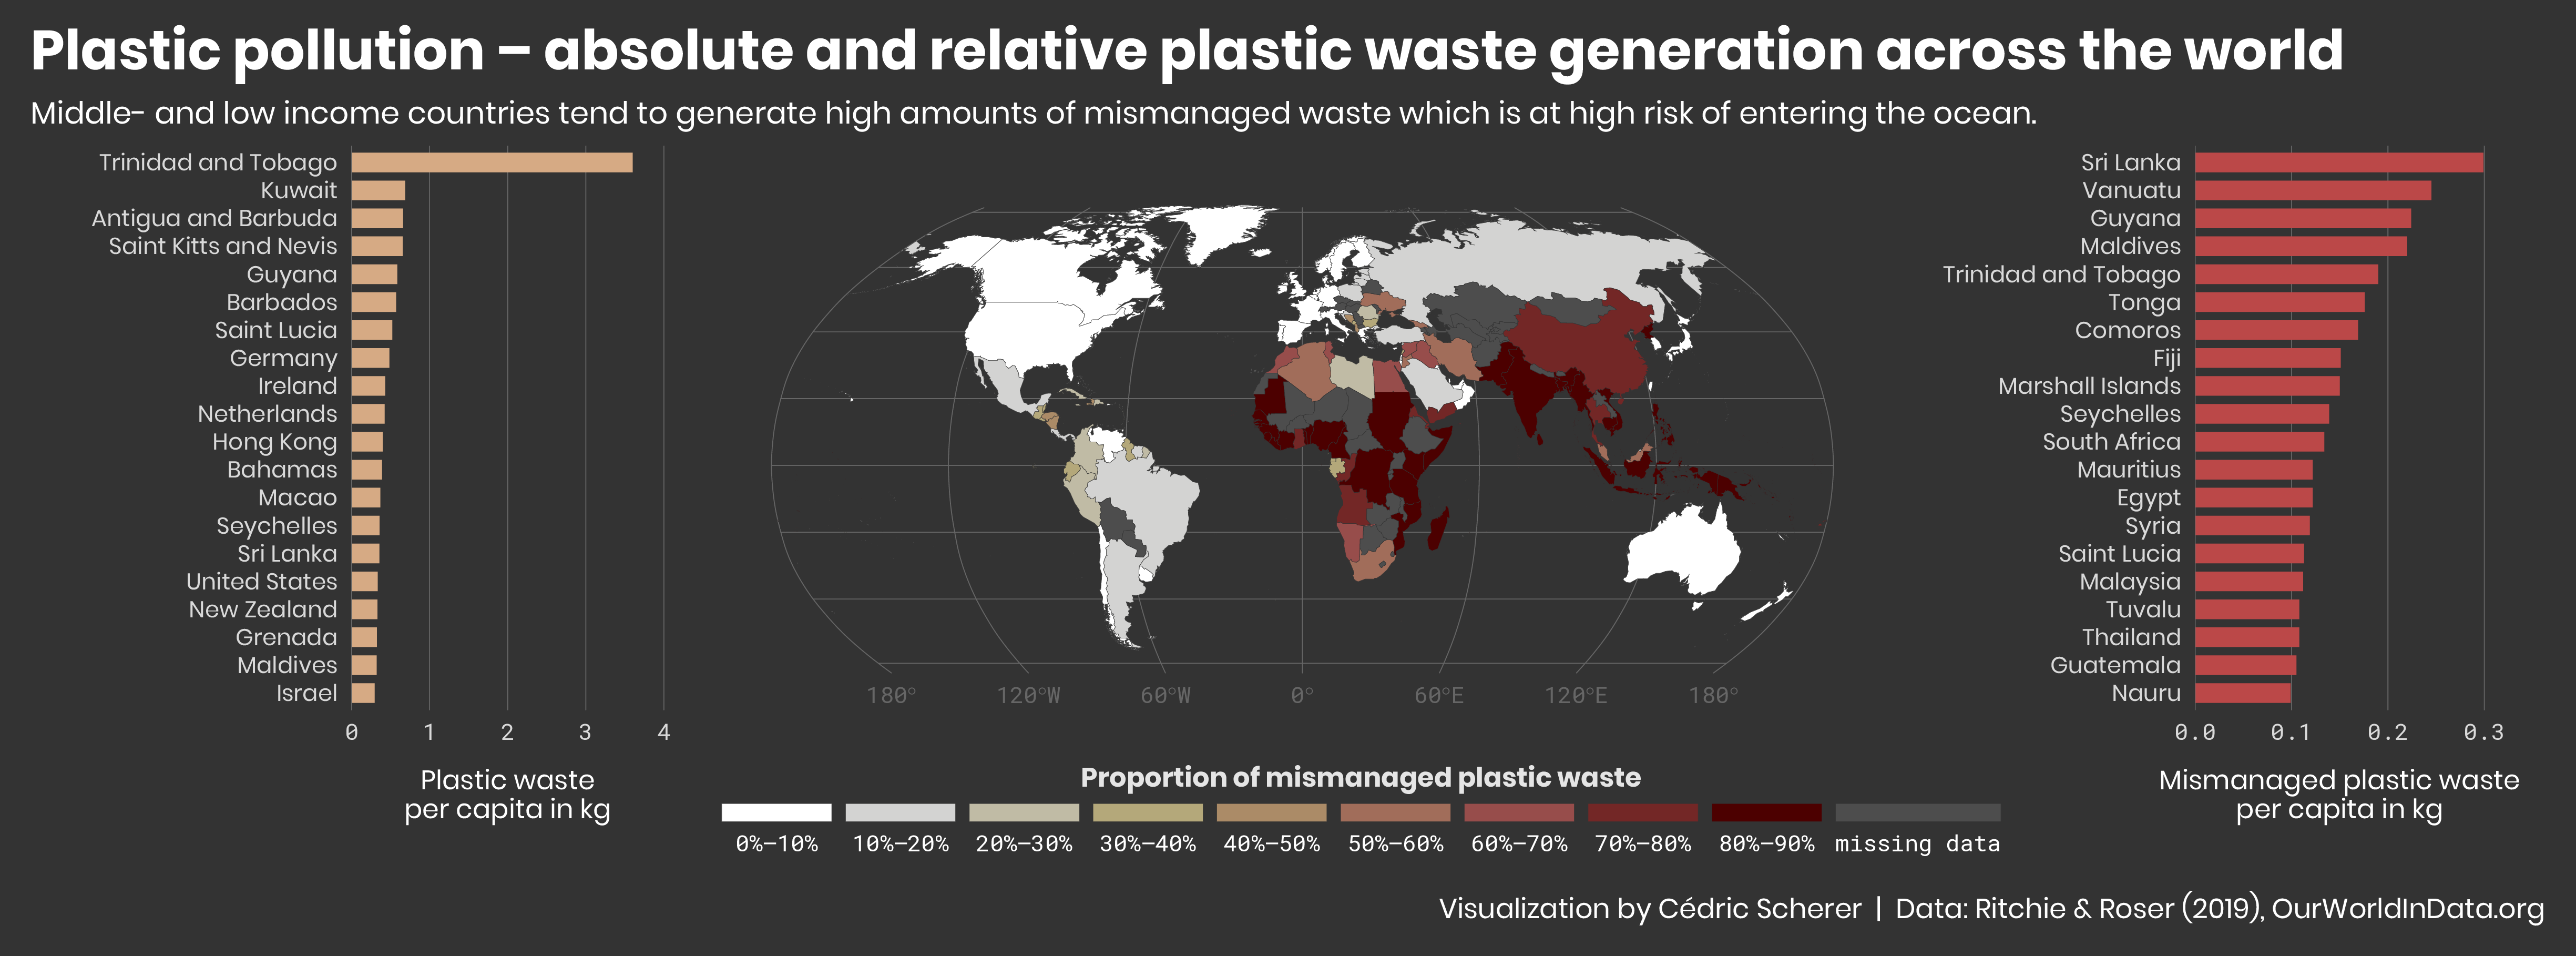
- 2019/21 🚮 Global Plastic Waste️
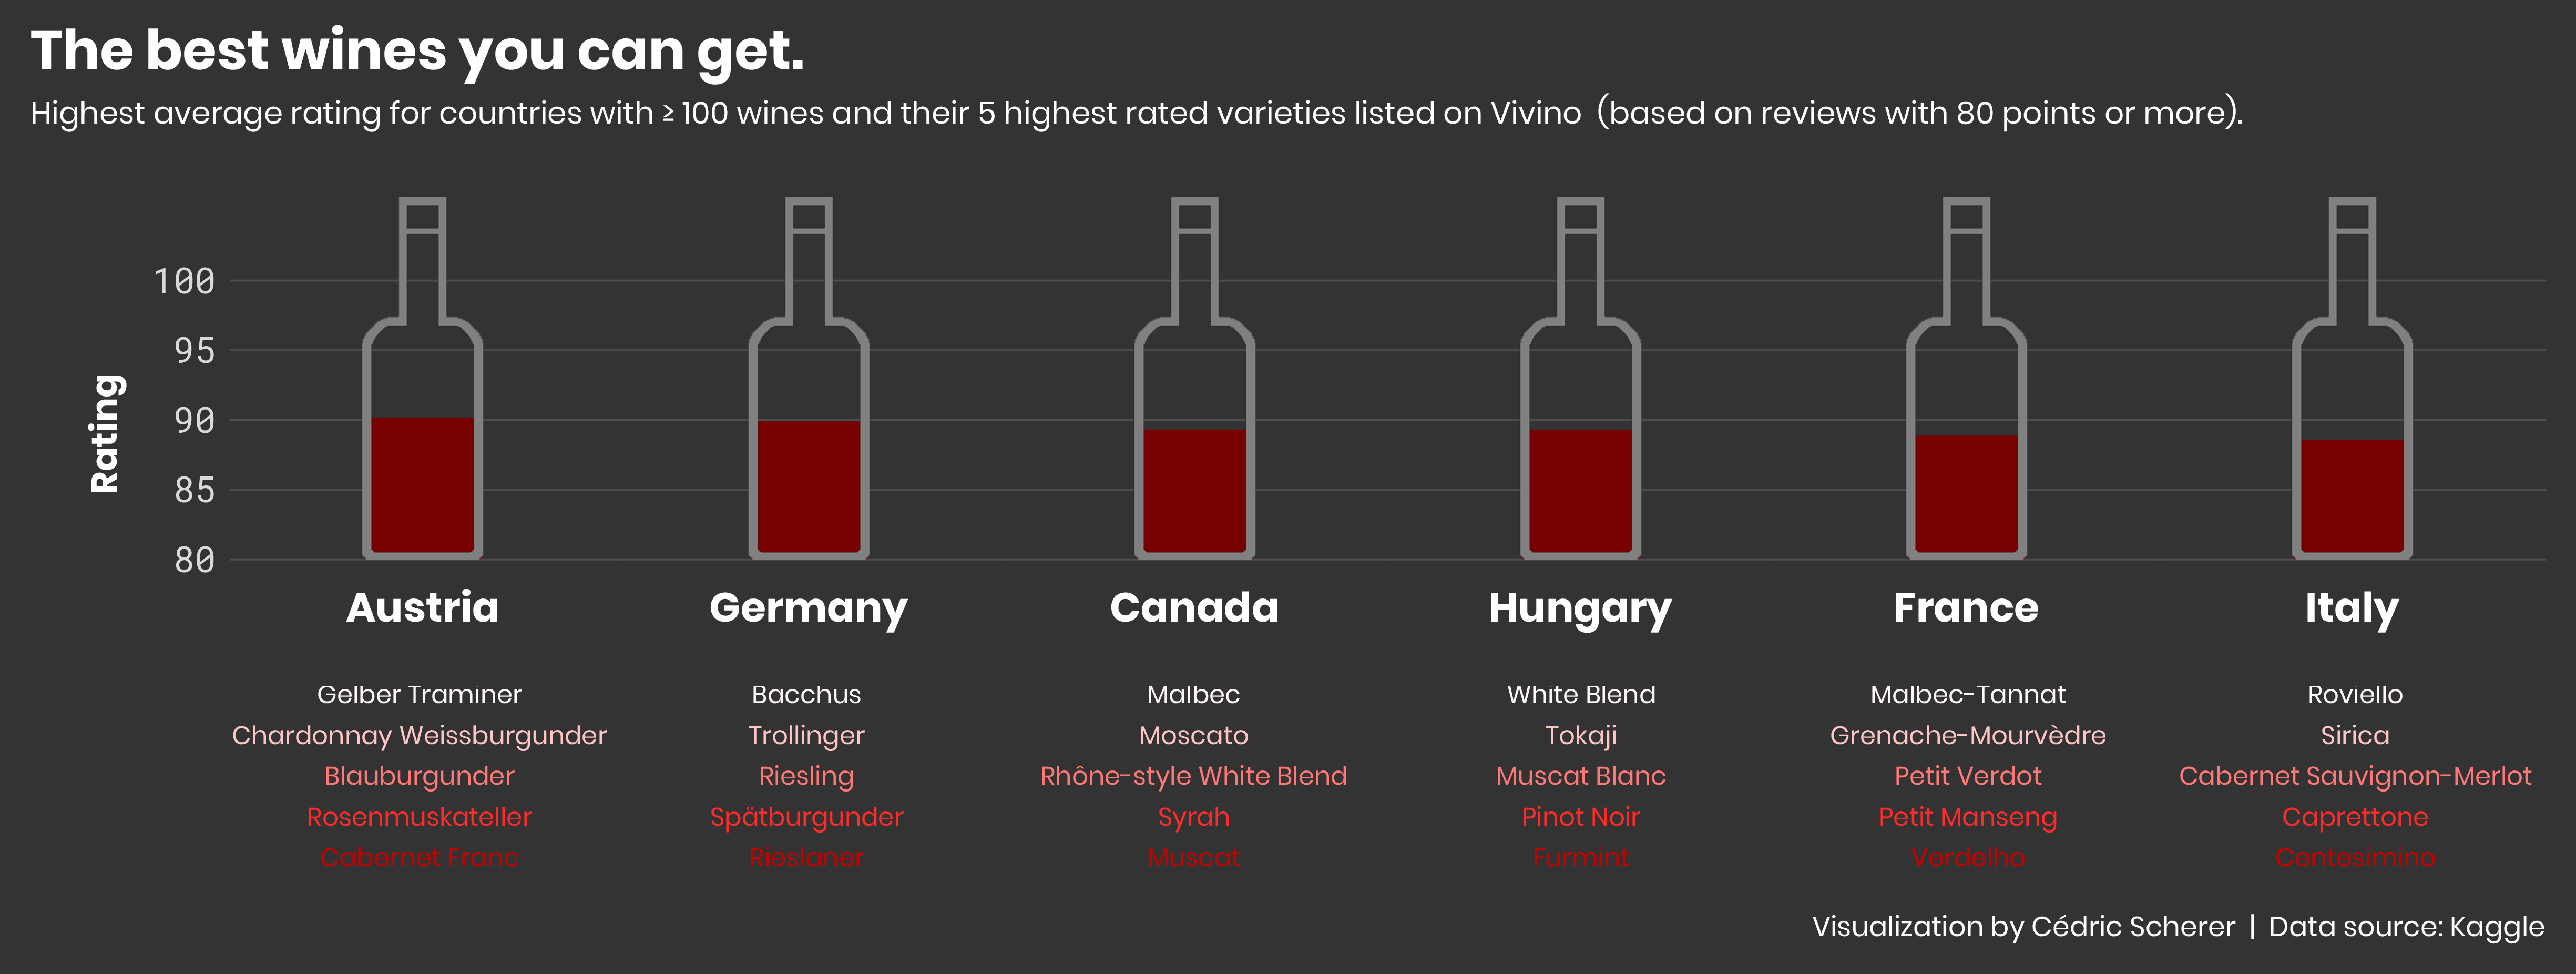
- 2019/22 🍷️ Wine Ratings
- 2019/24 🌠 Meteorites
- 2019/25 🐦 Christmas Bird Counts
- 2019/27 💰 Media Franchise Revenues️
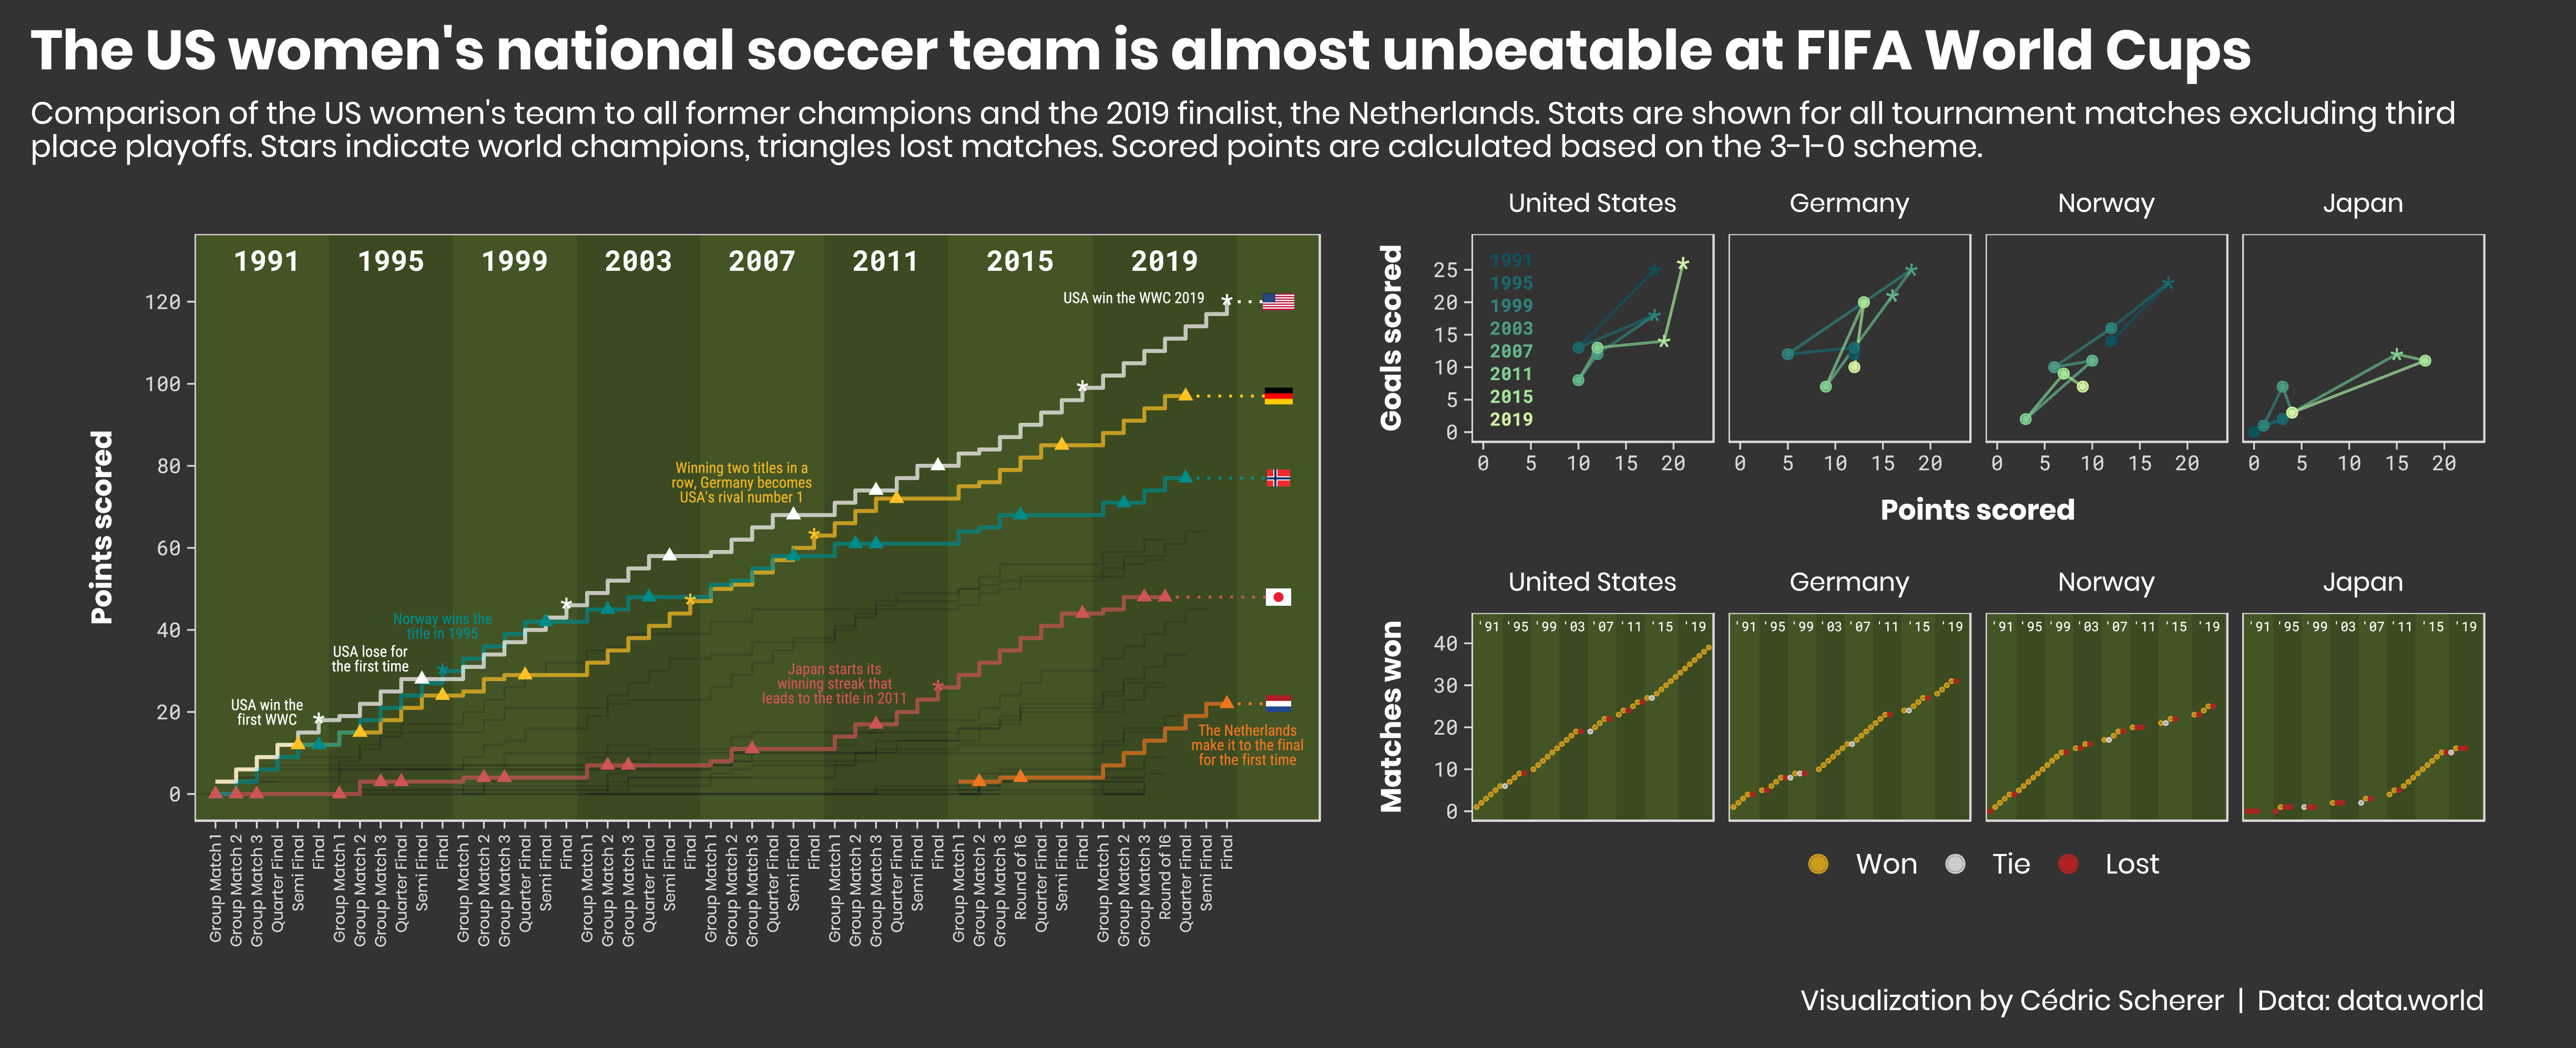
- 2019/28 ⚽ FIFA Women's World Cup️
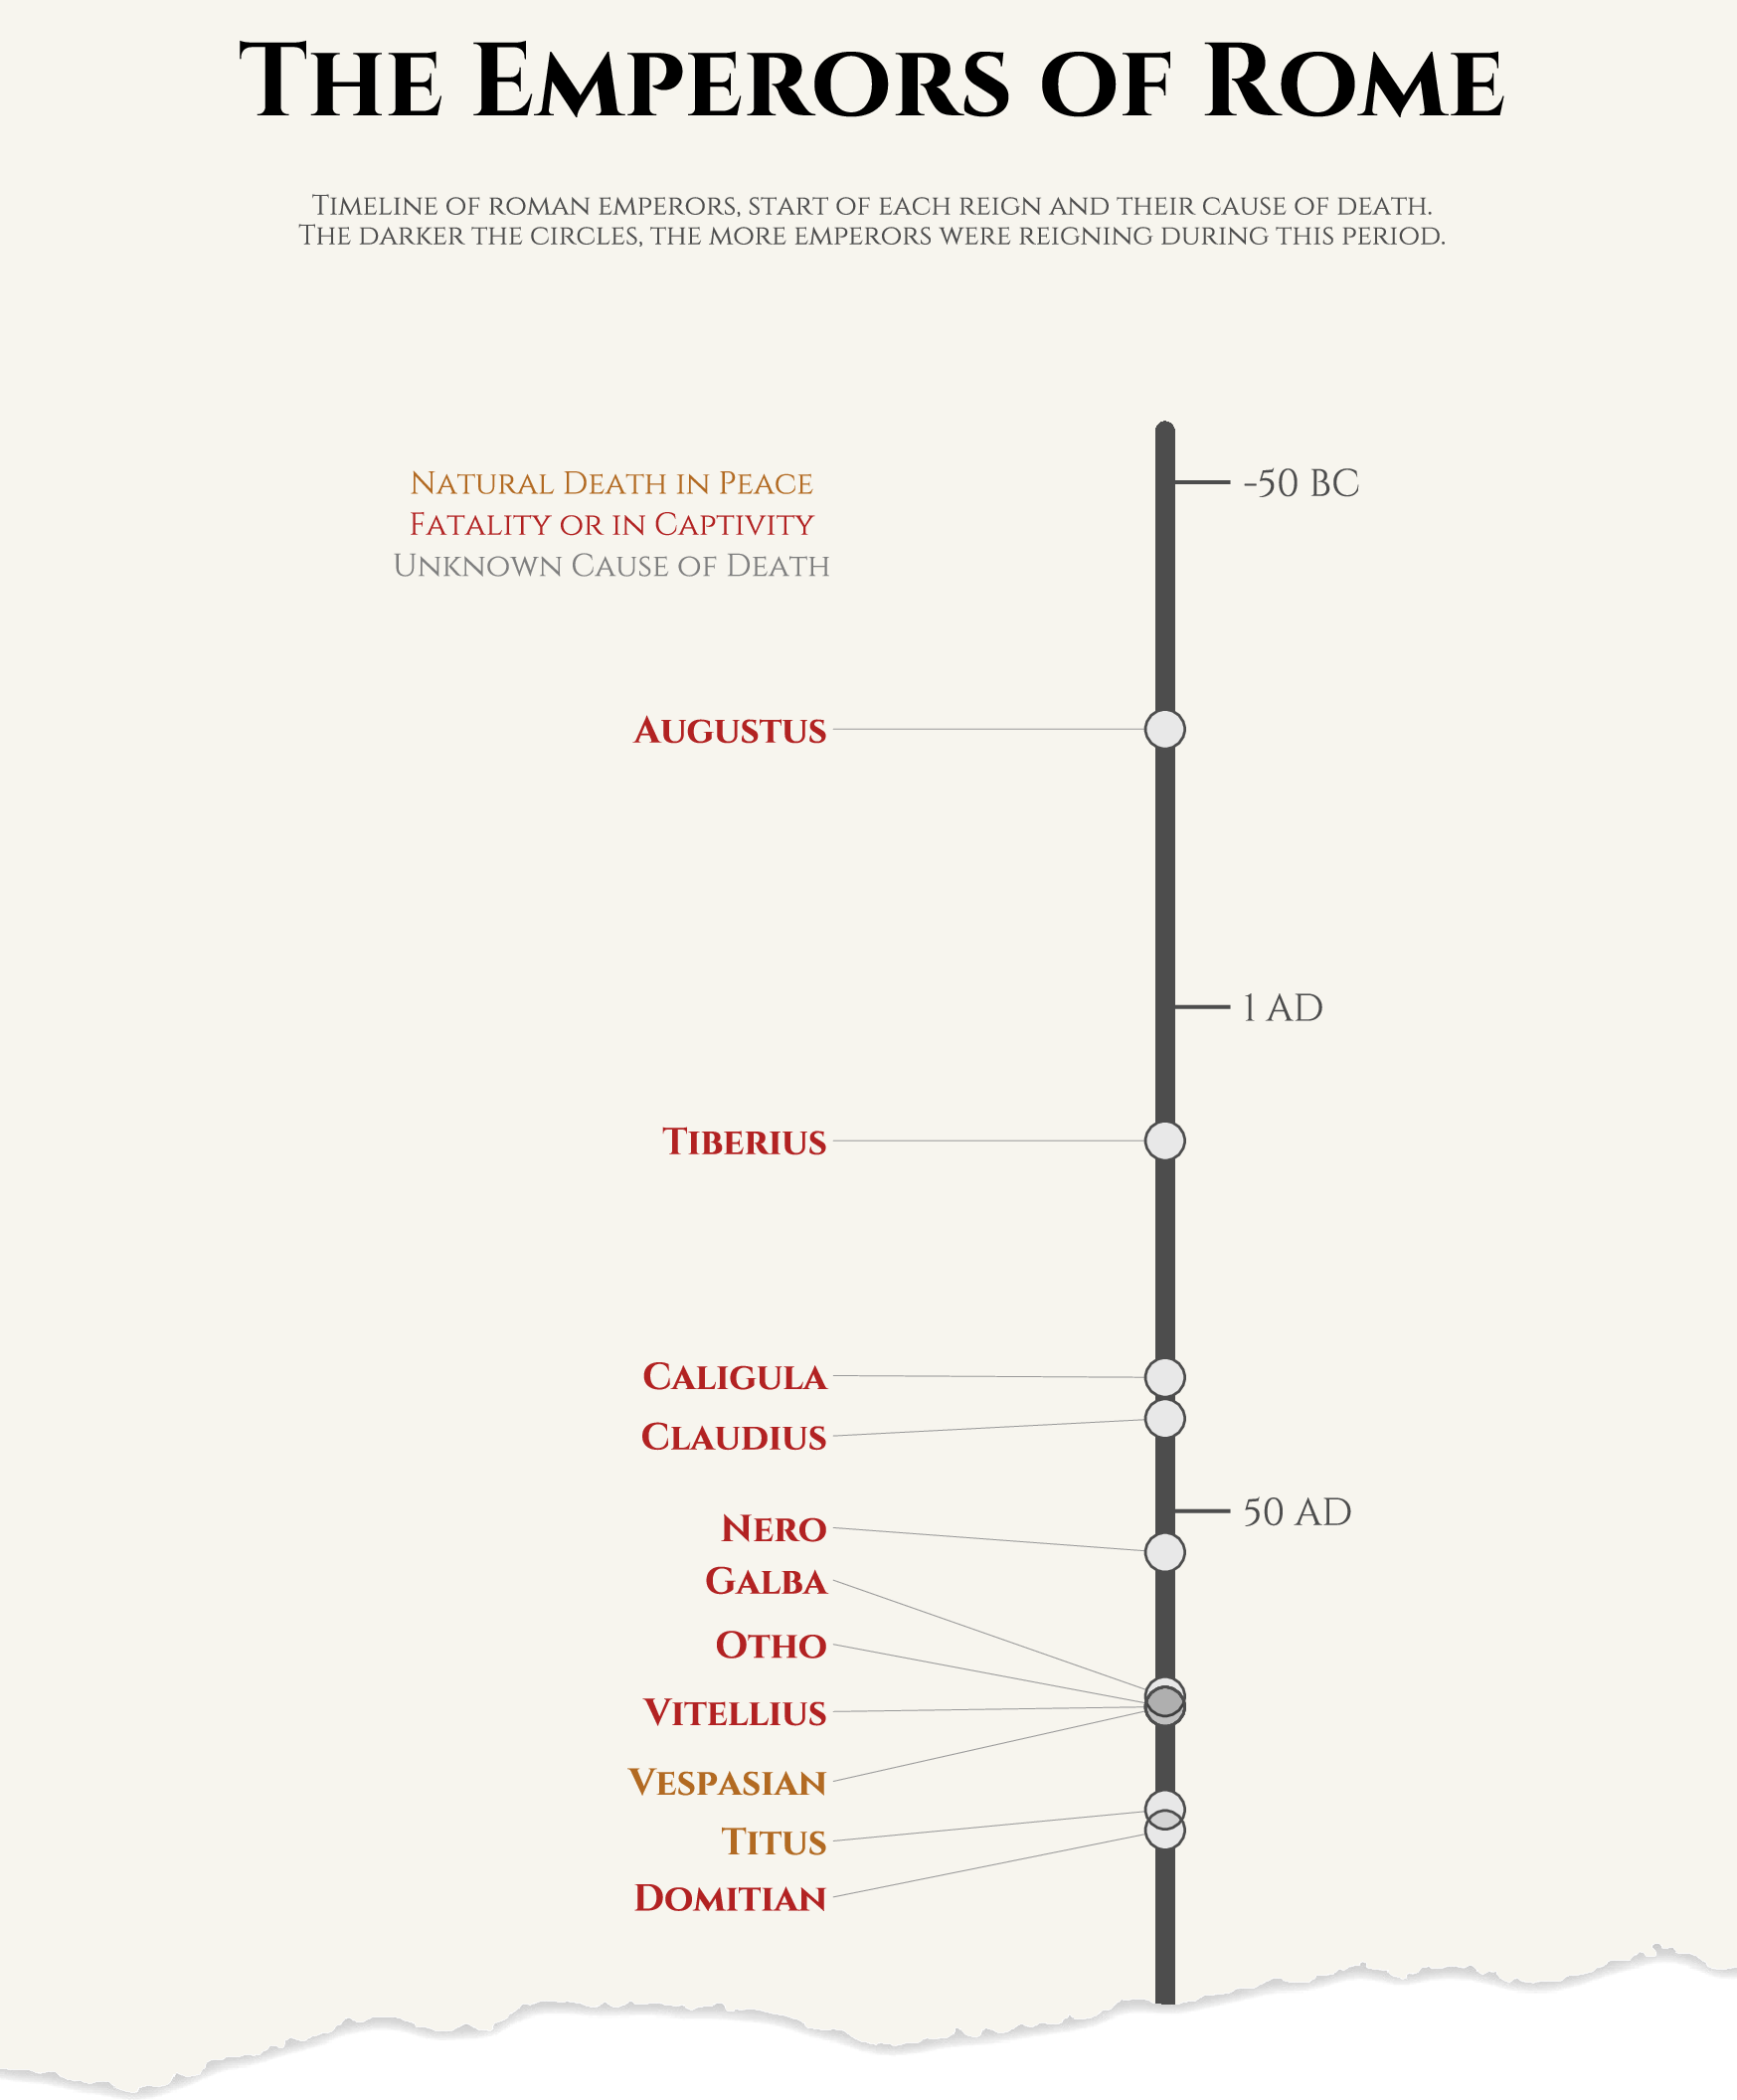
- 2019/33 🌿 Roman Emperors️
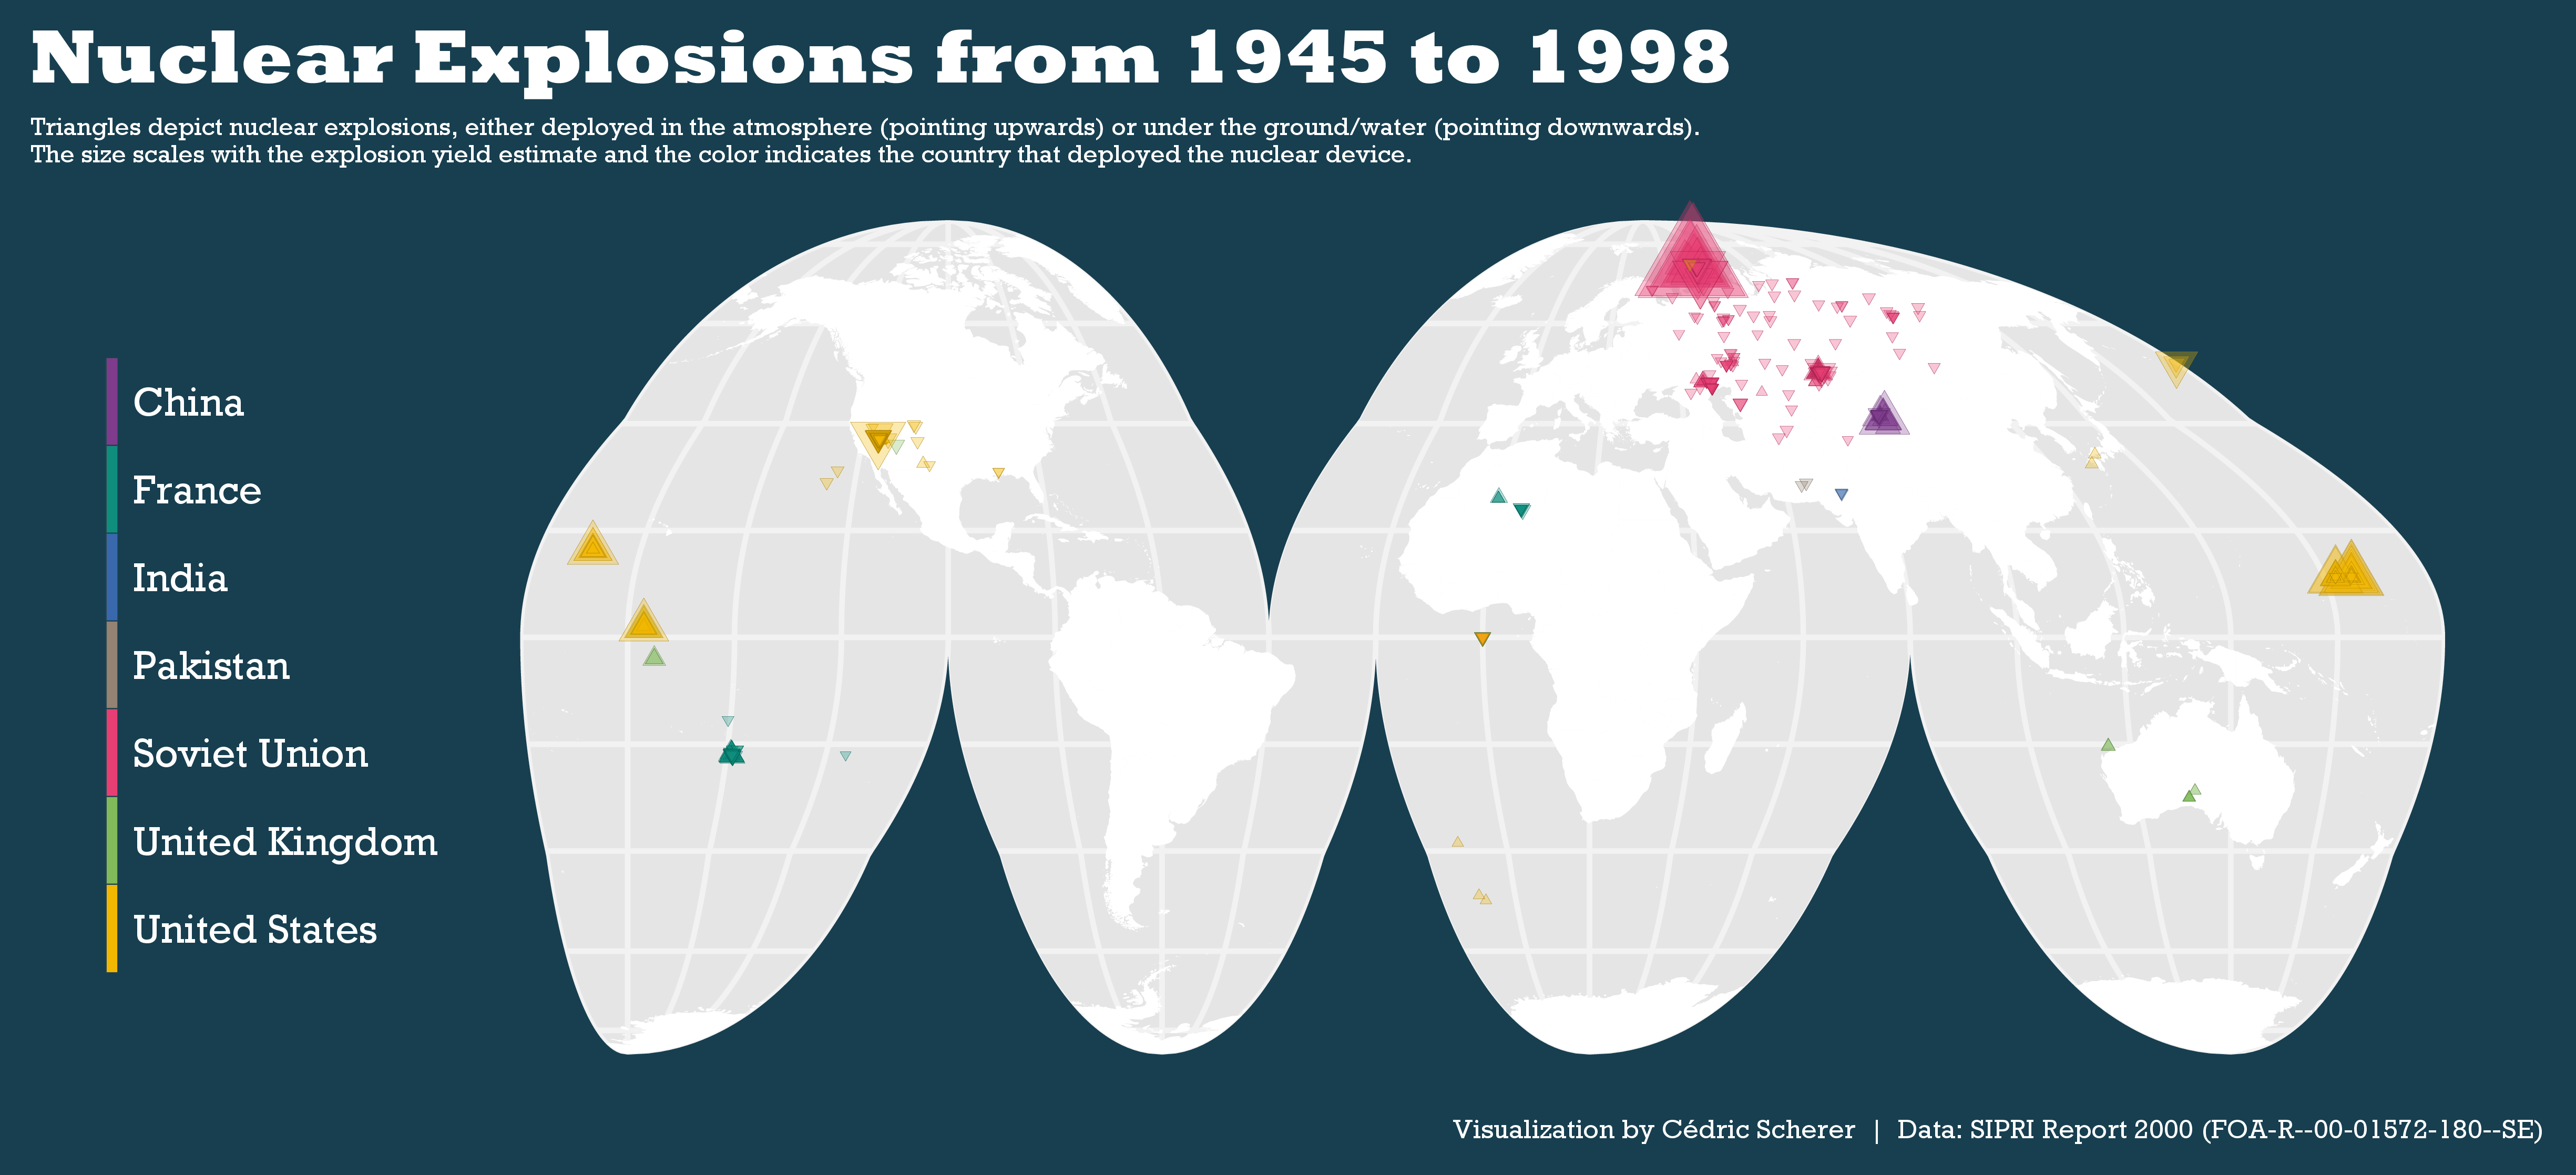
- 2019/34 ☢️ Nuclear Explosions️
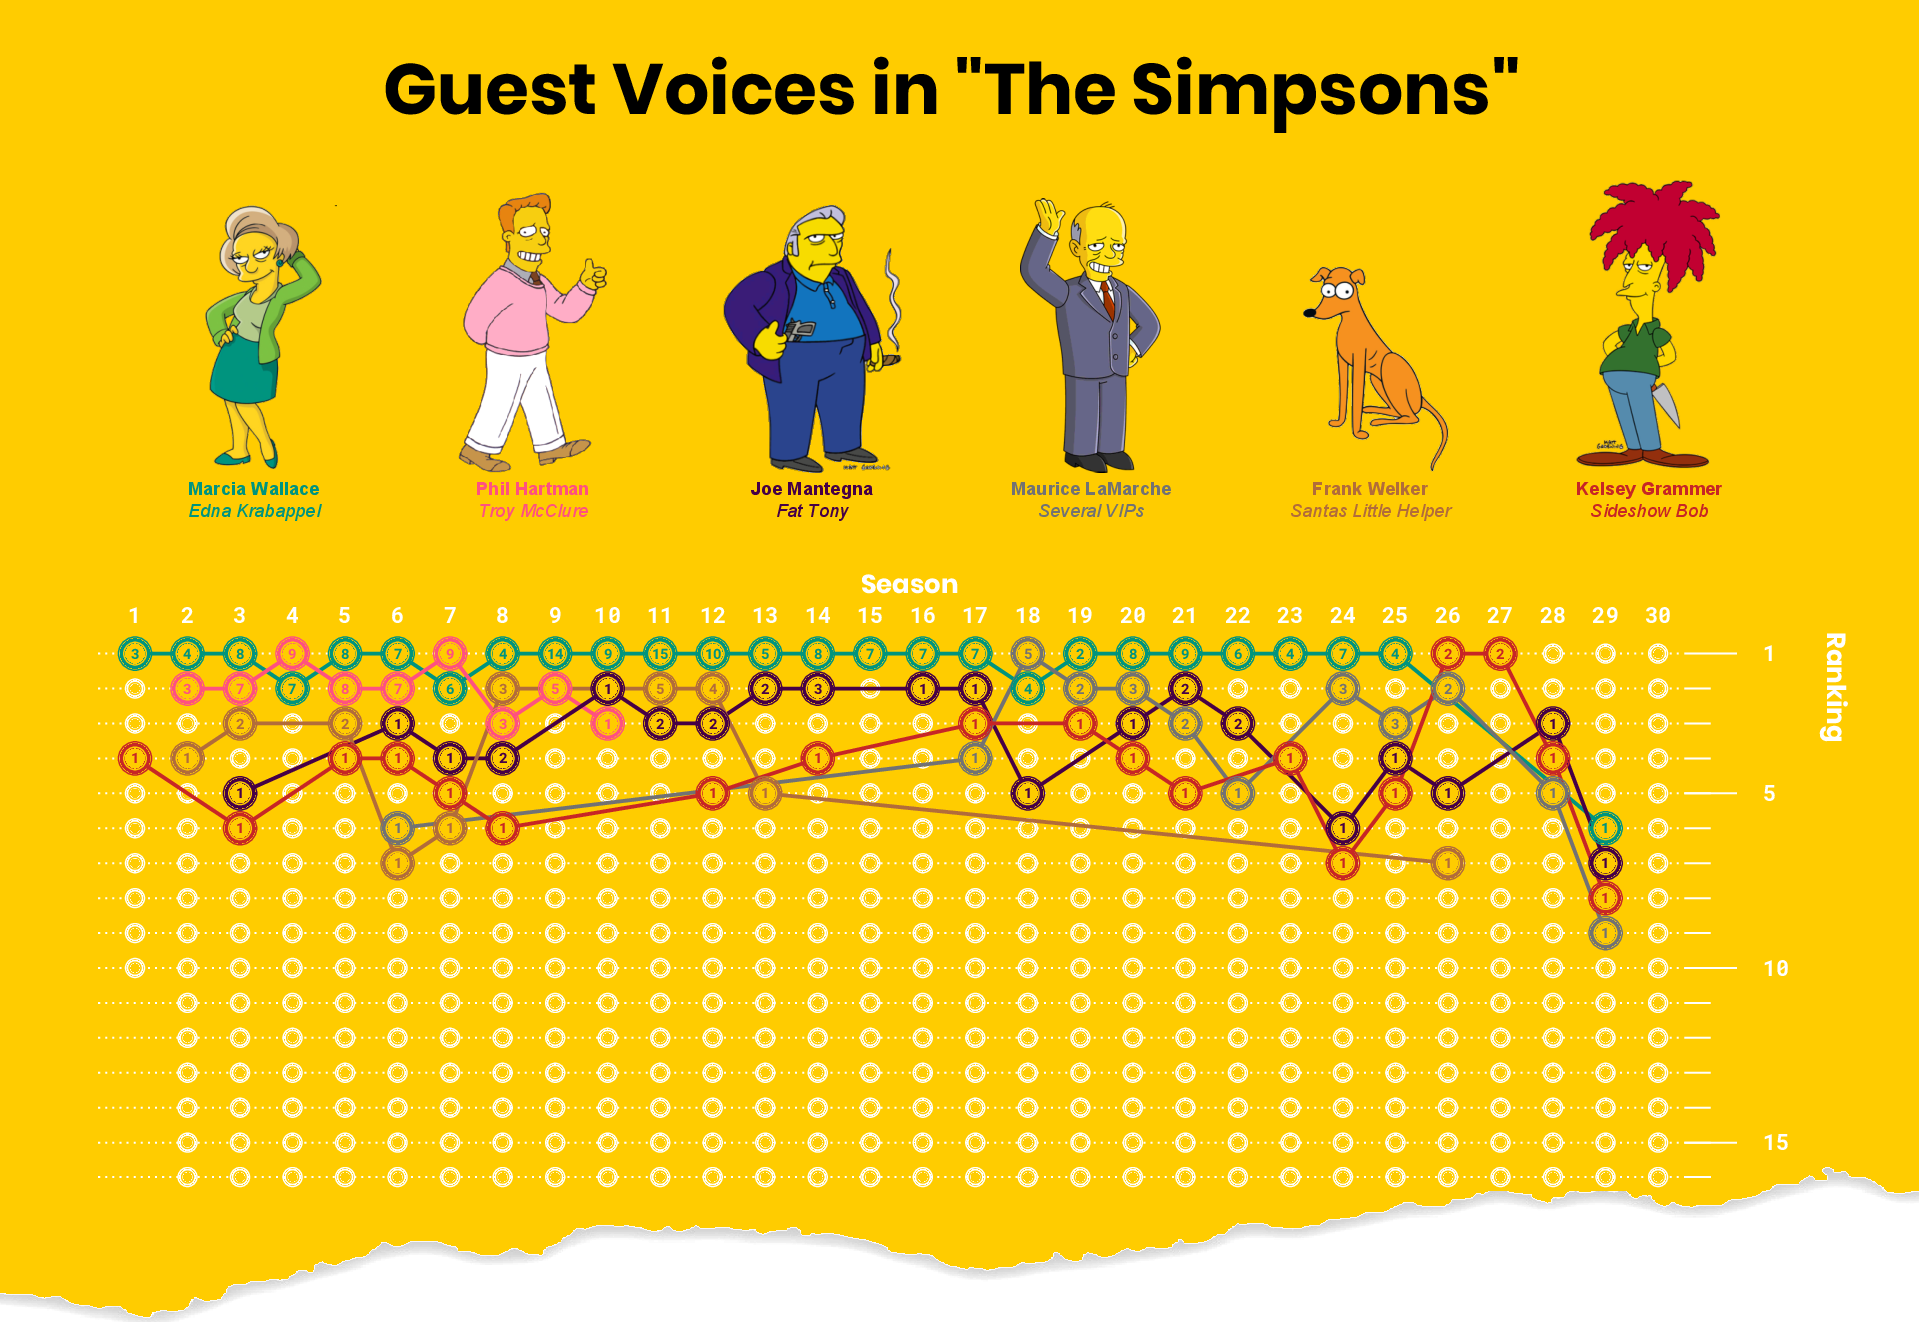
- 2019/35 💛 Simpsons Guest Stars️
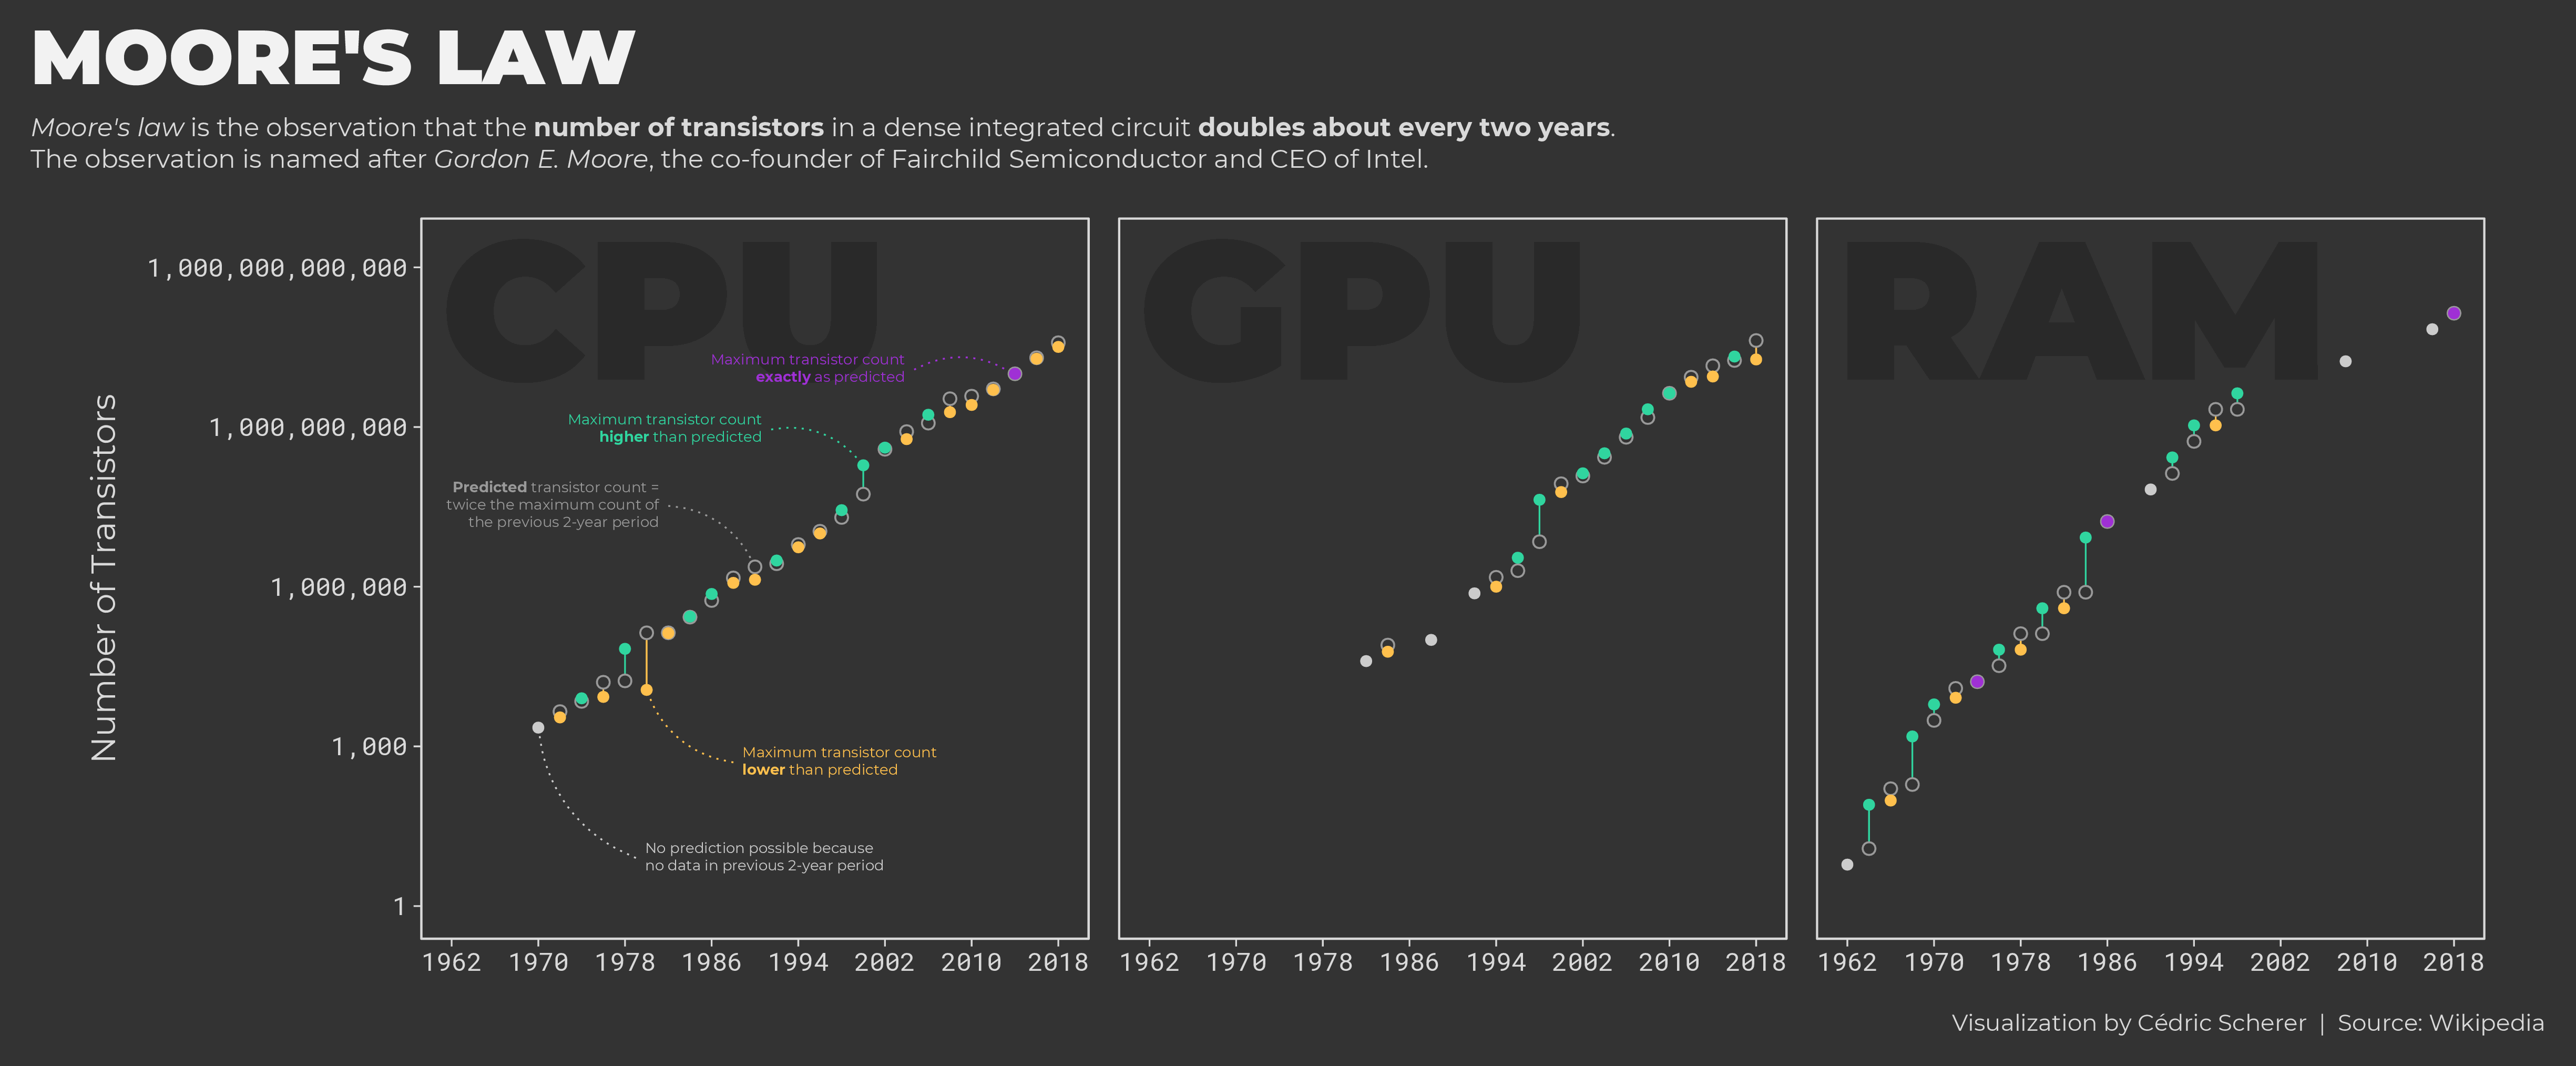
- 2019/36 🖥️ Moore's Law️
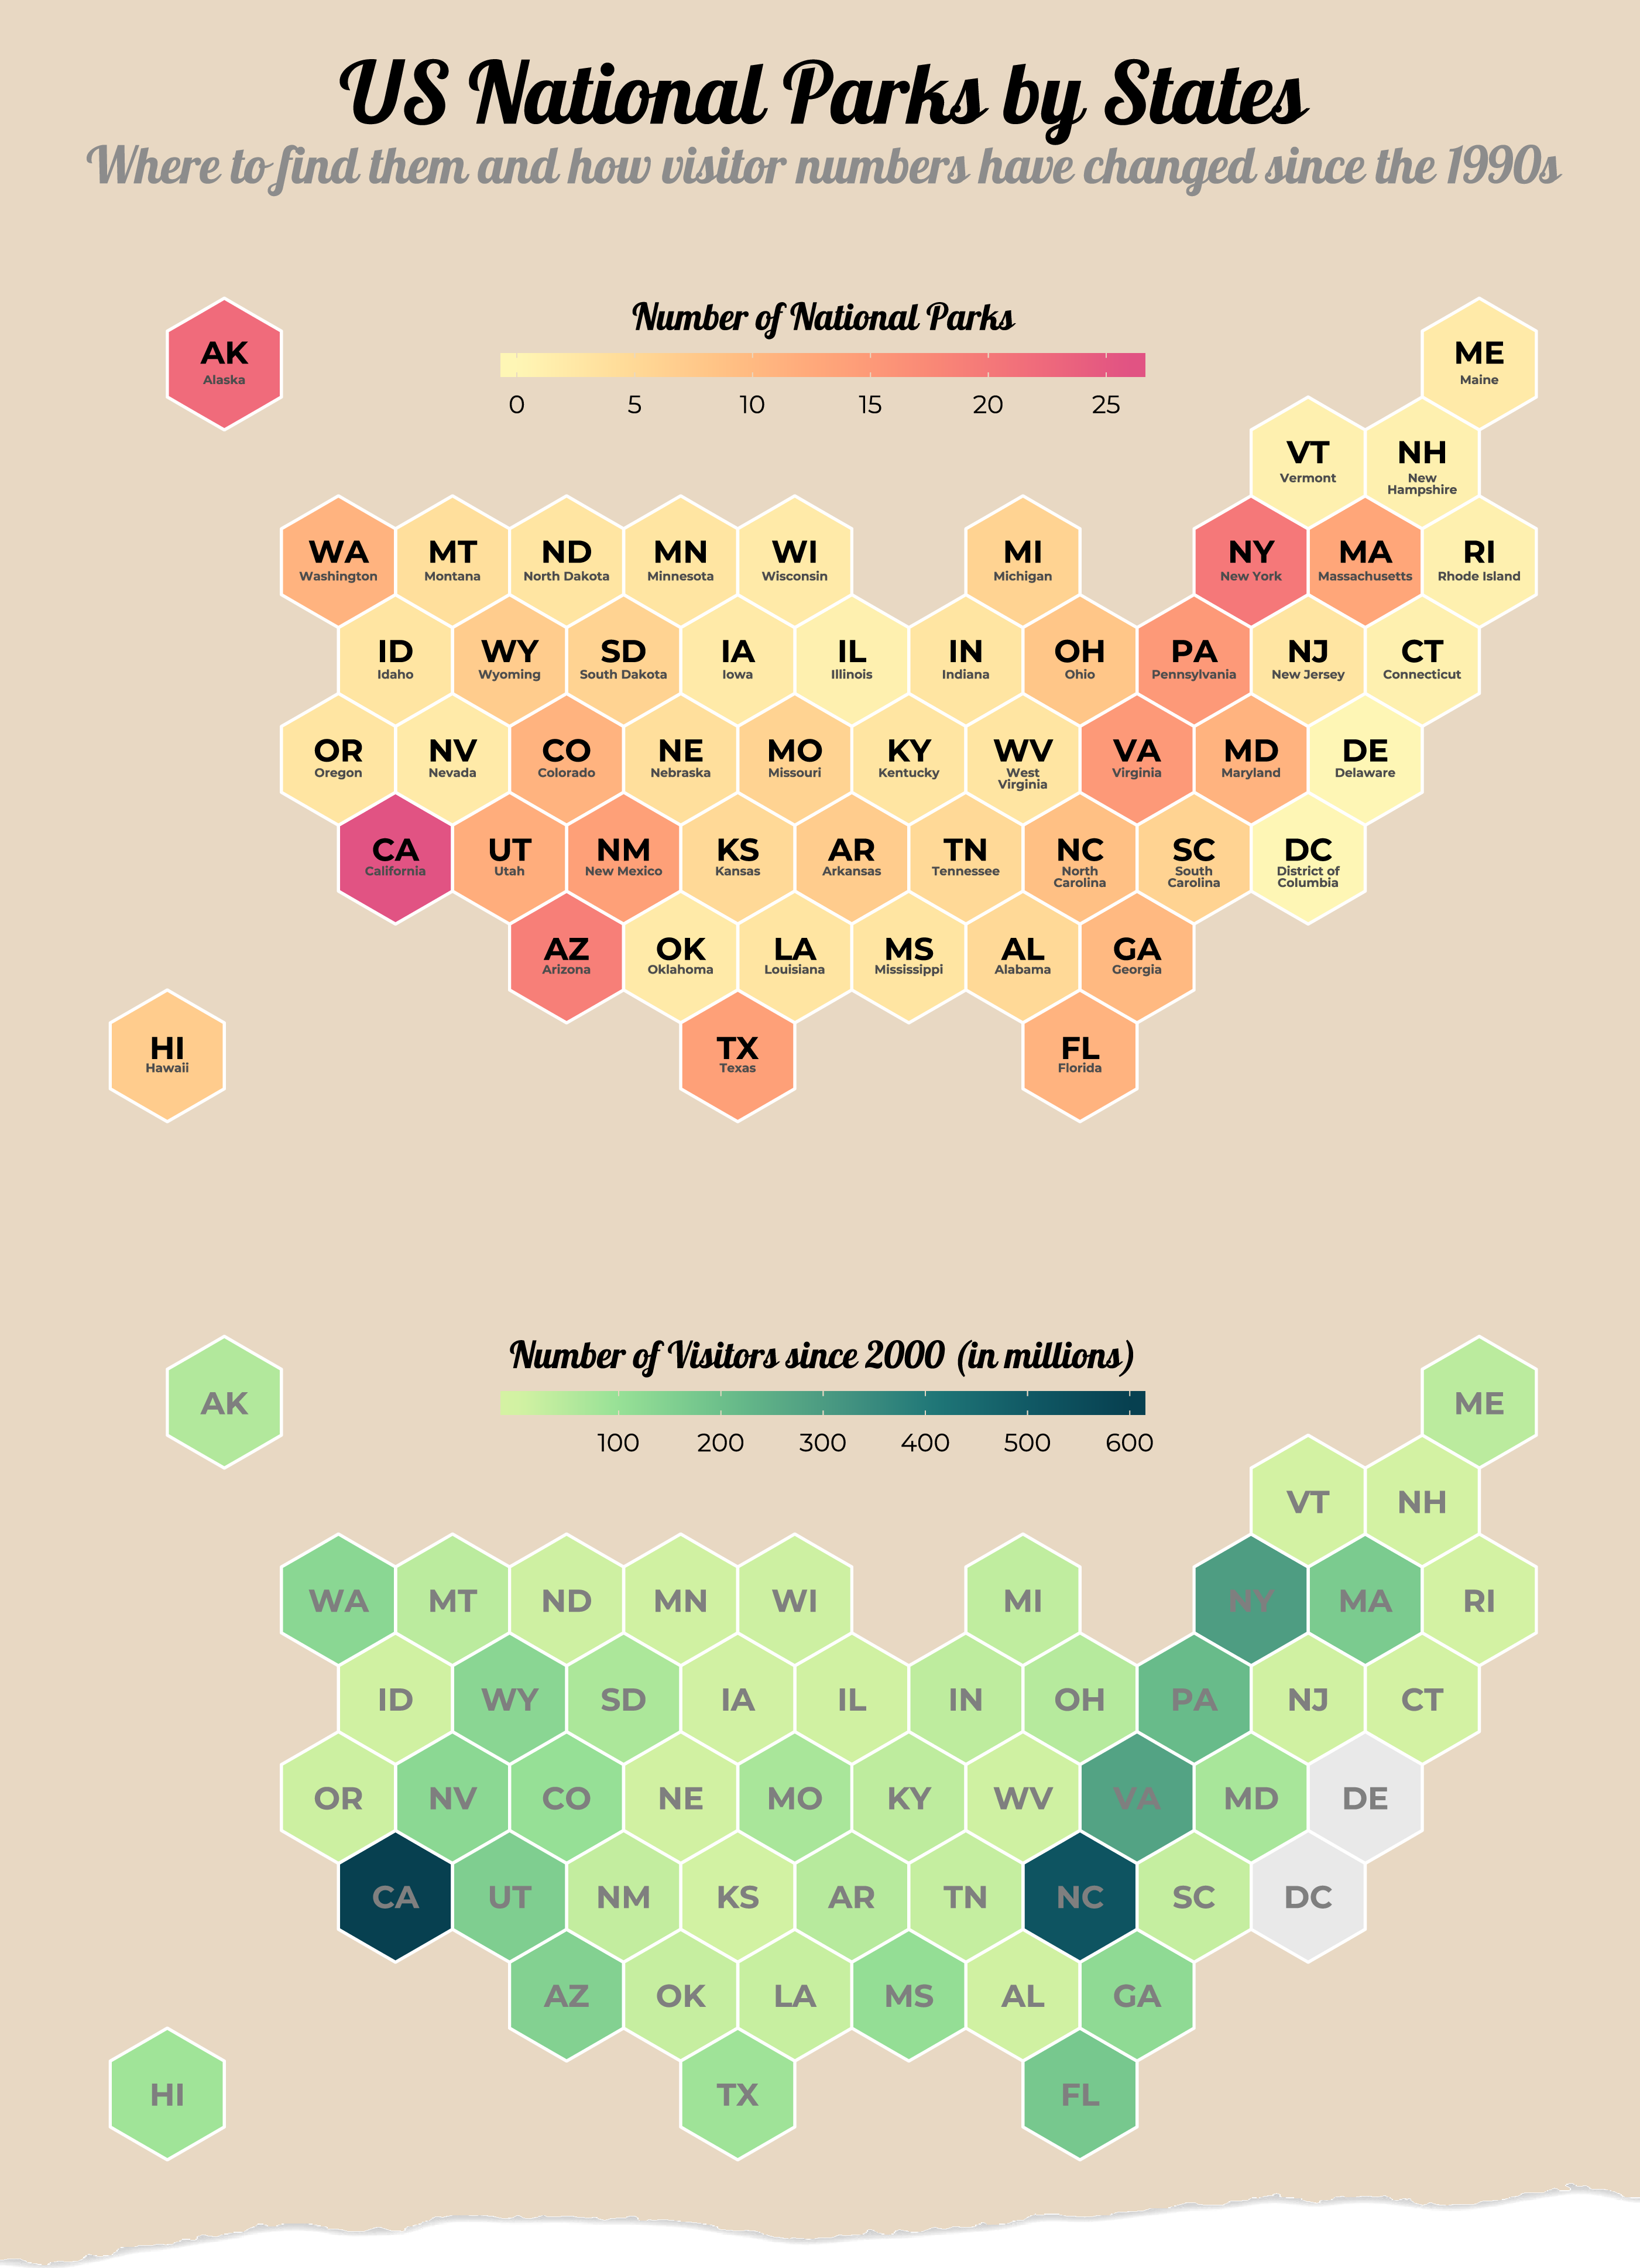
- 2019/38 🏞️ US National Park Visits
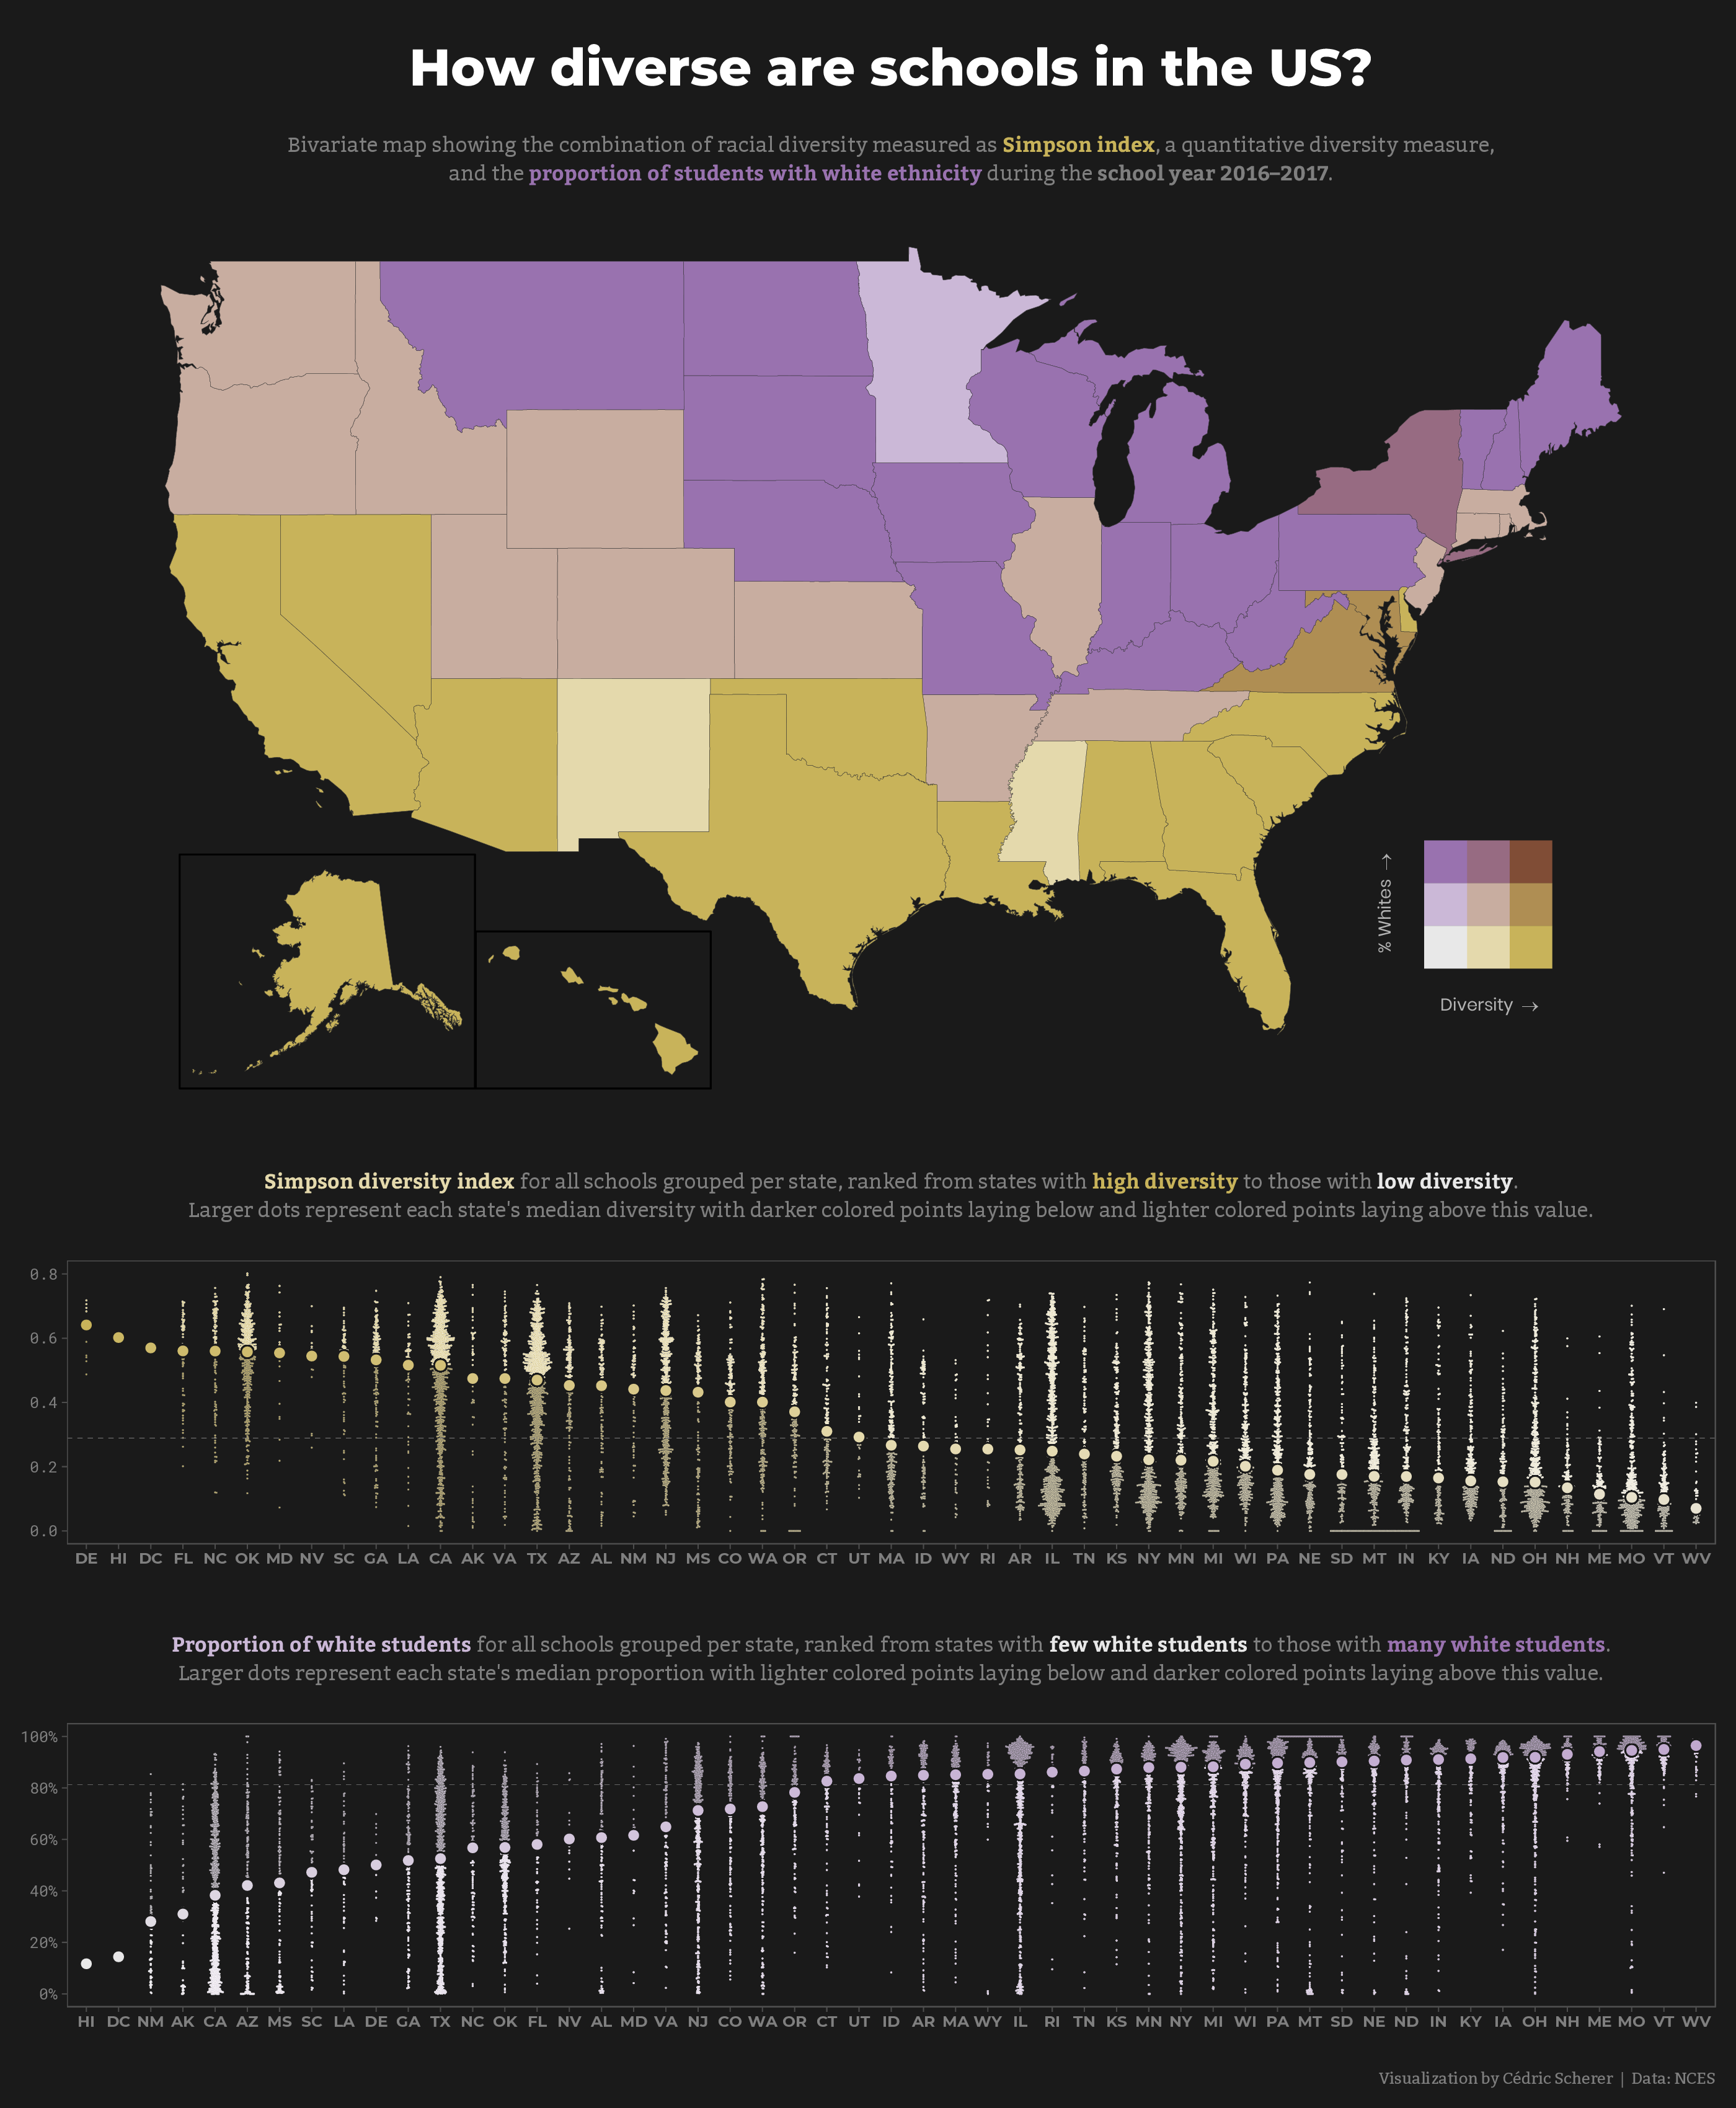
- 2019/39 🏫️ US School Diversity️
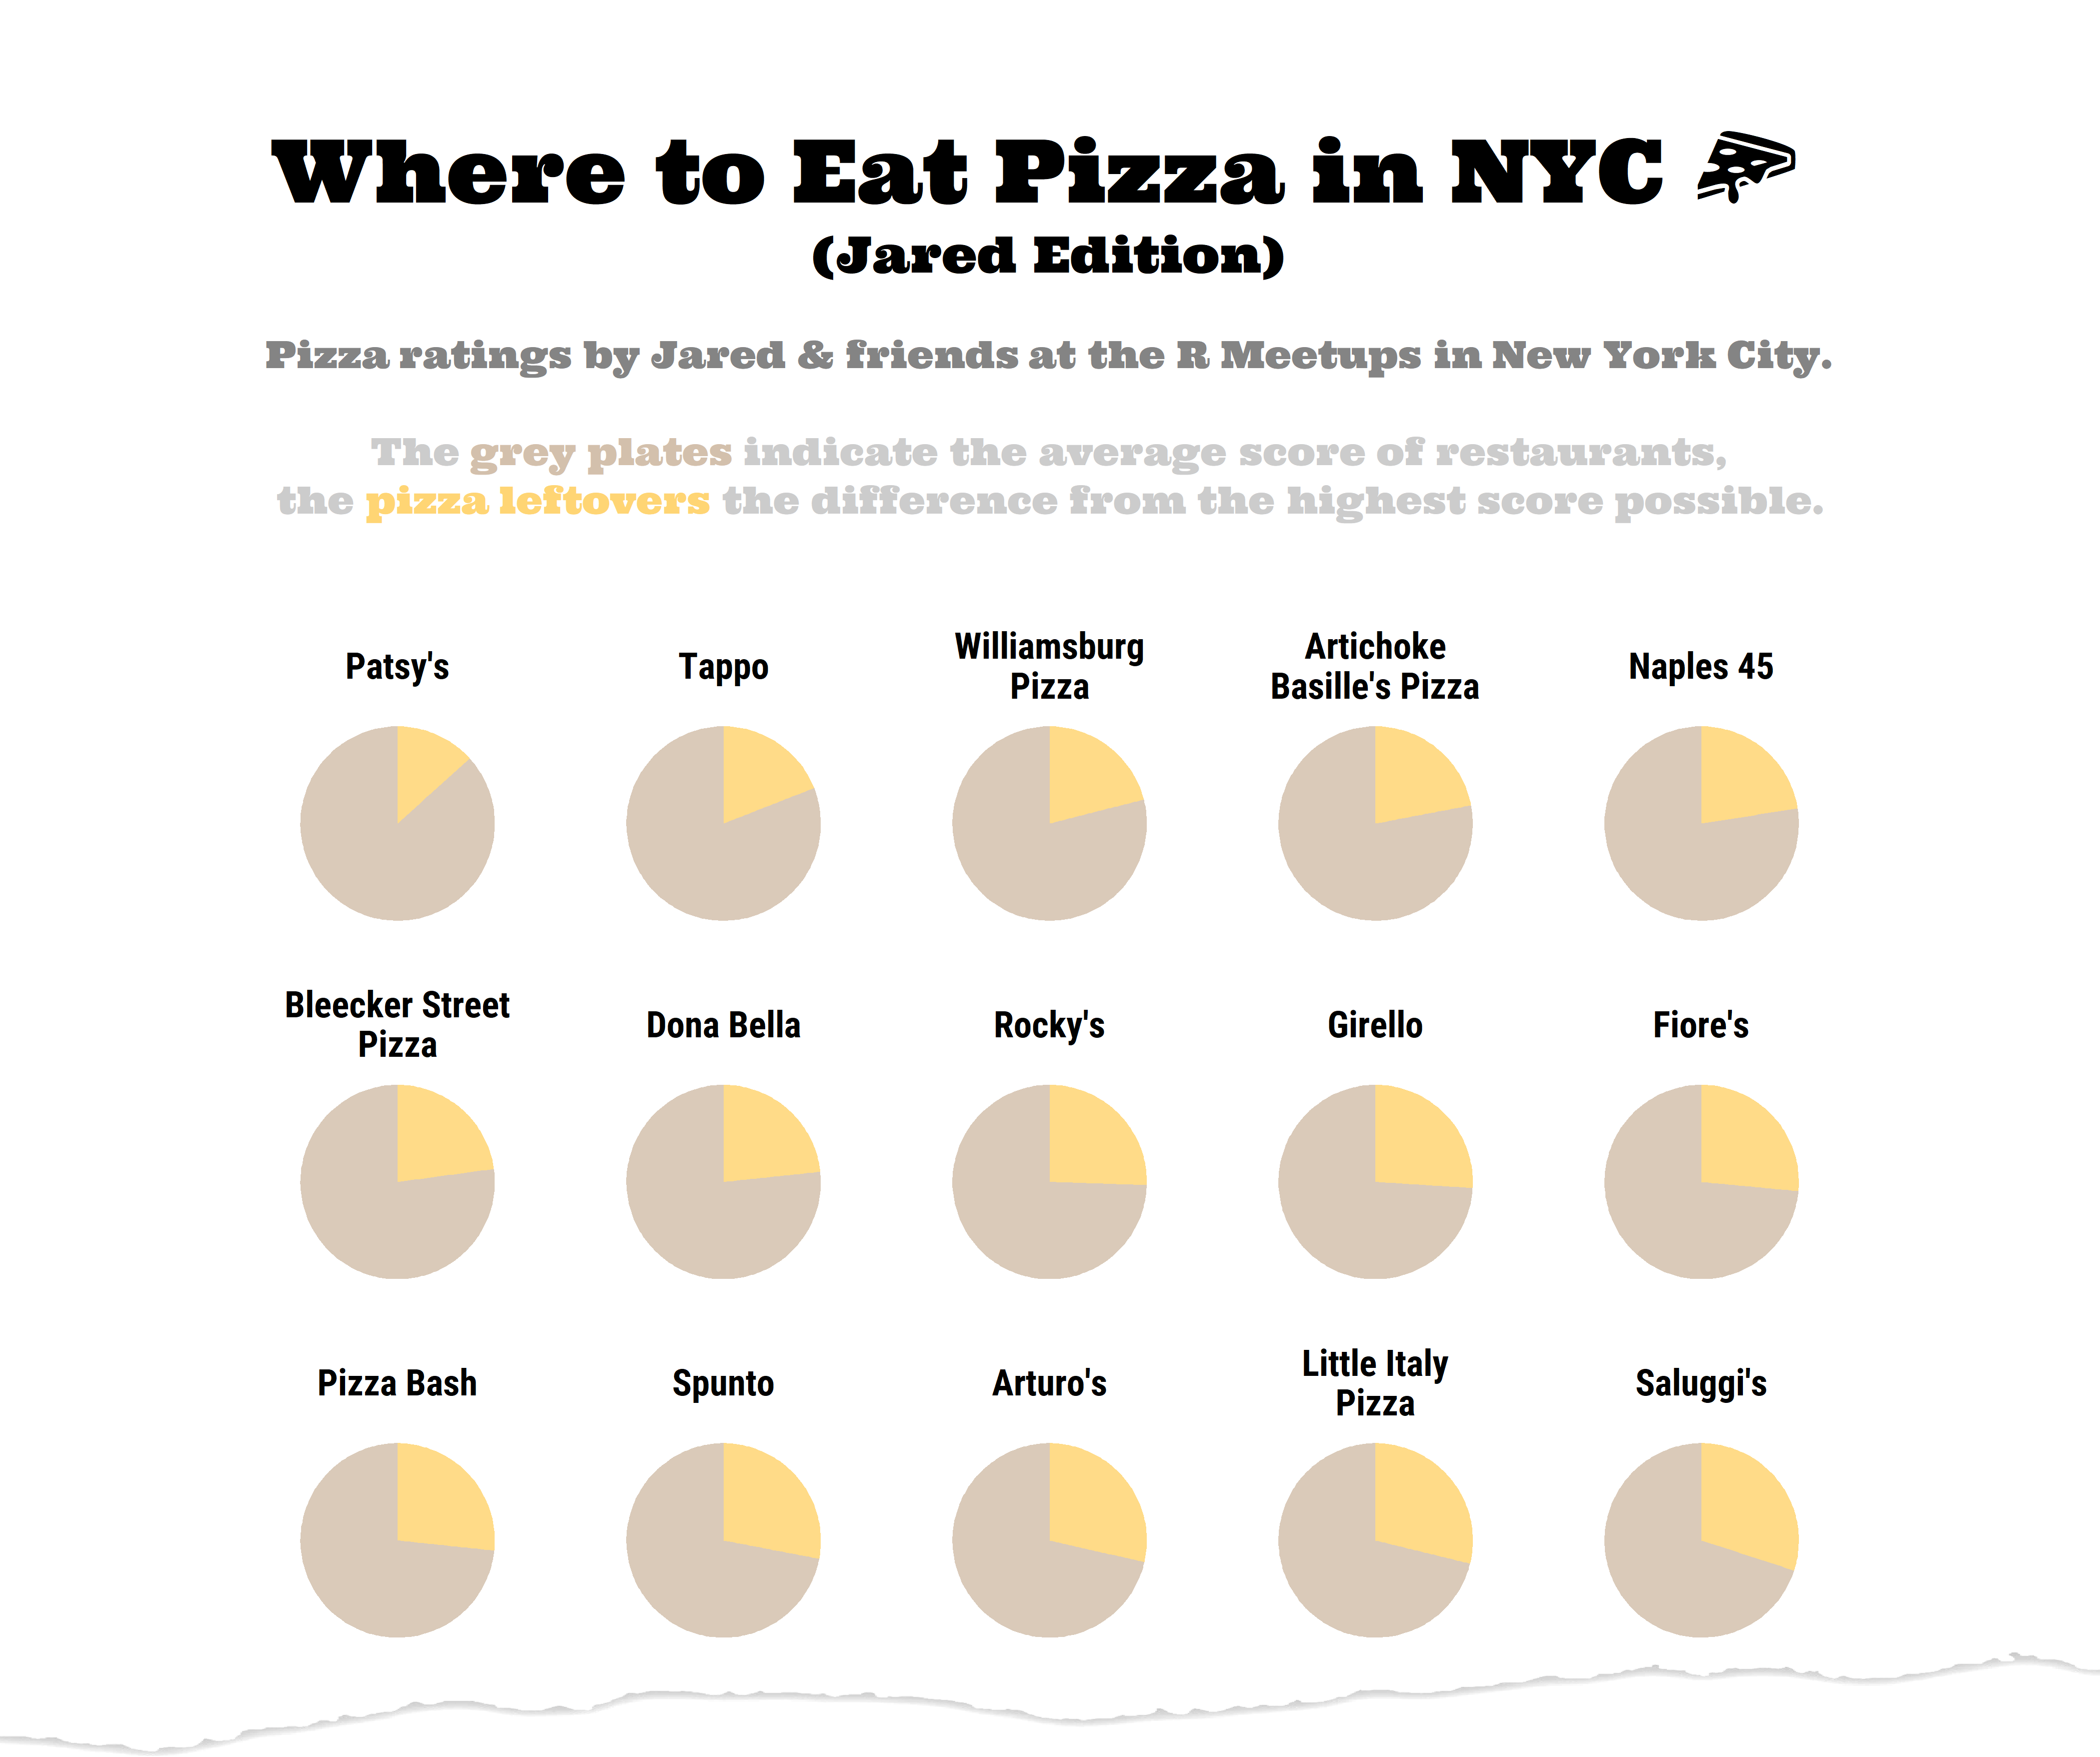
- 2019/40 🍕 NYC Pizza Ratings️
- 2019/42 🚘 Big Cars️
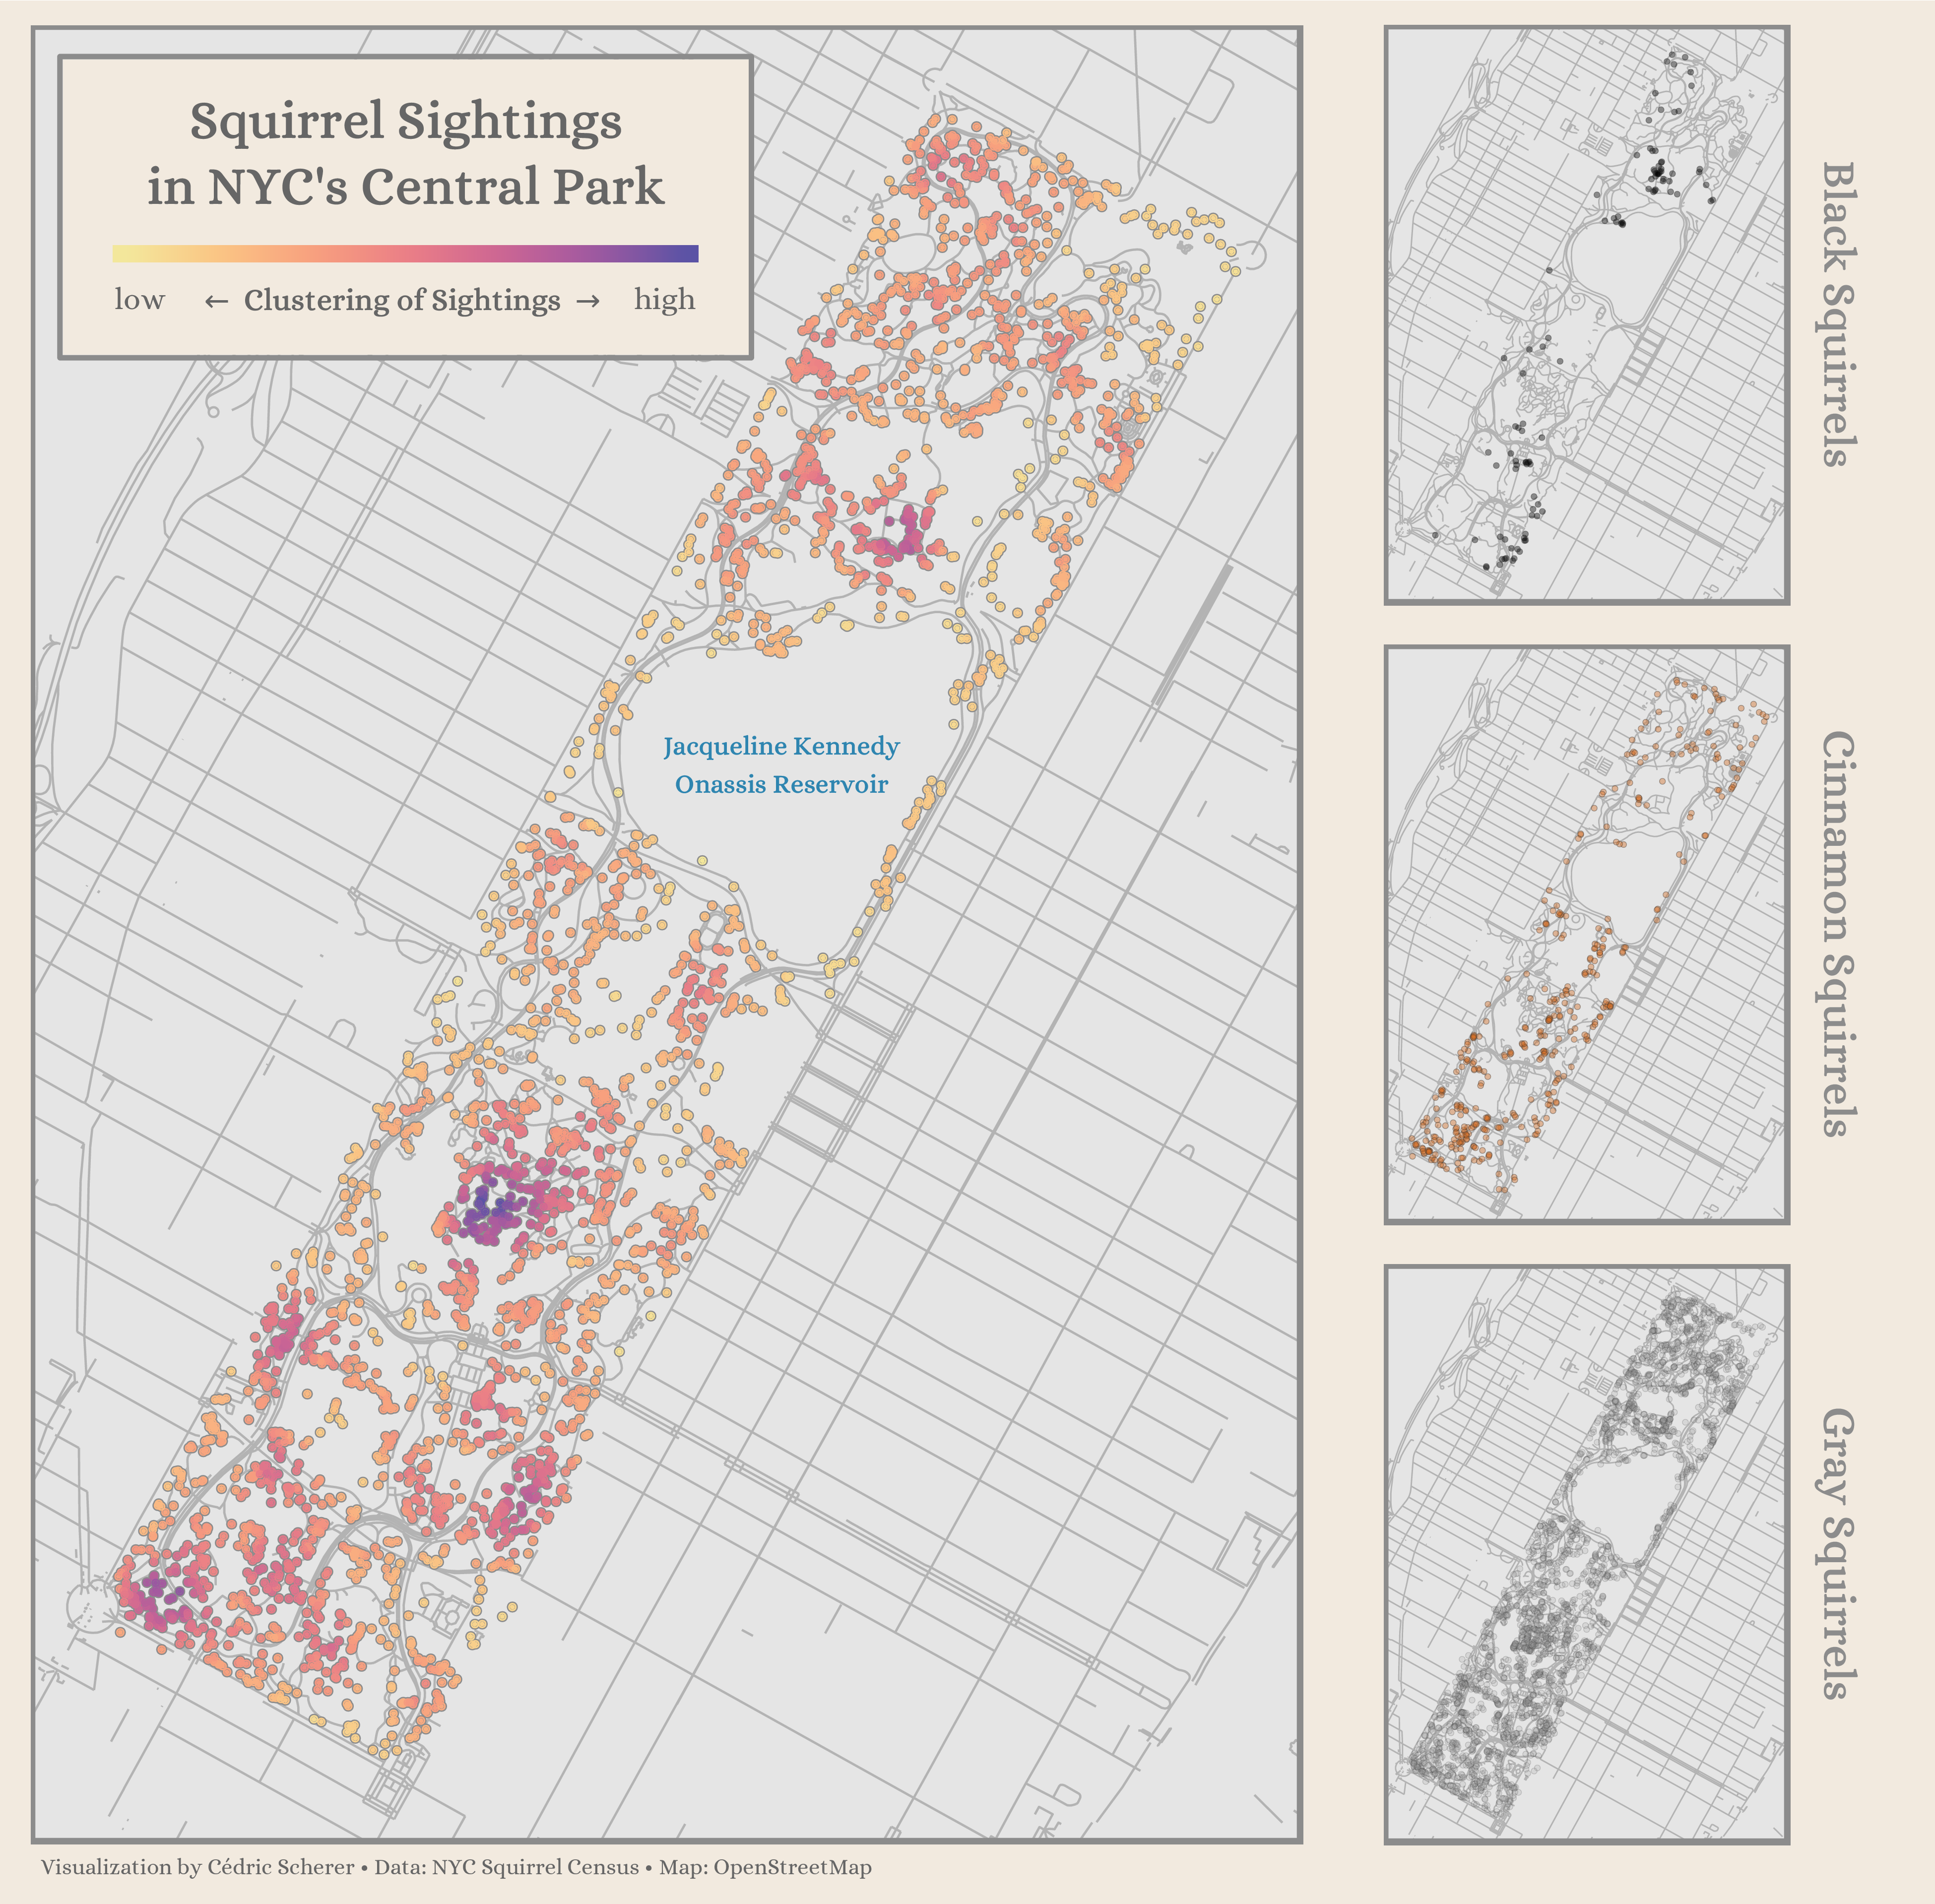
- 2019/44 🐿️ NYC Squirrels️
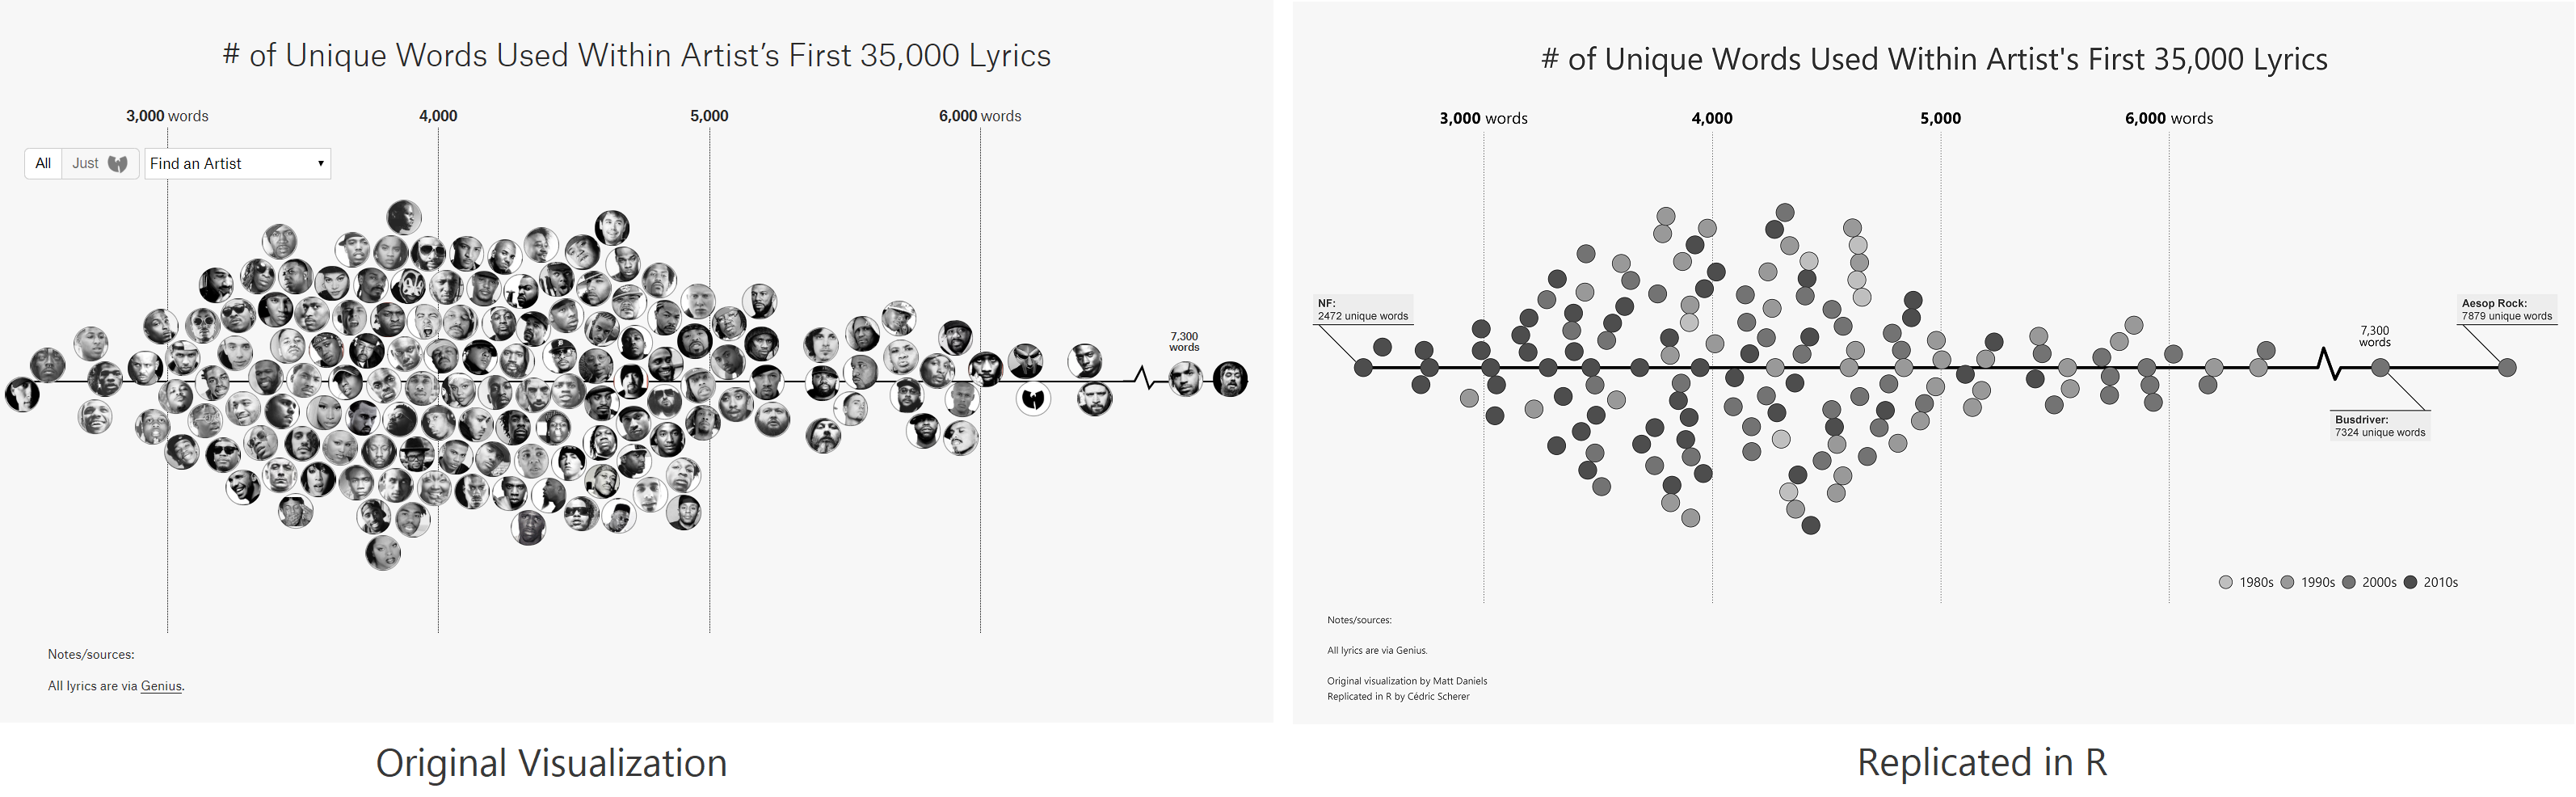
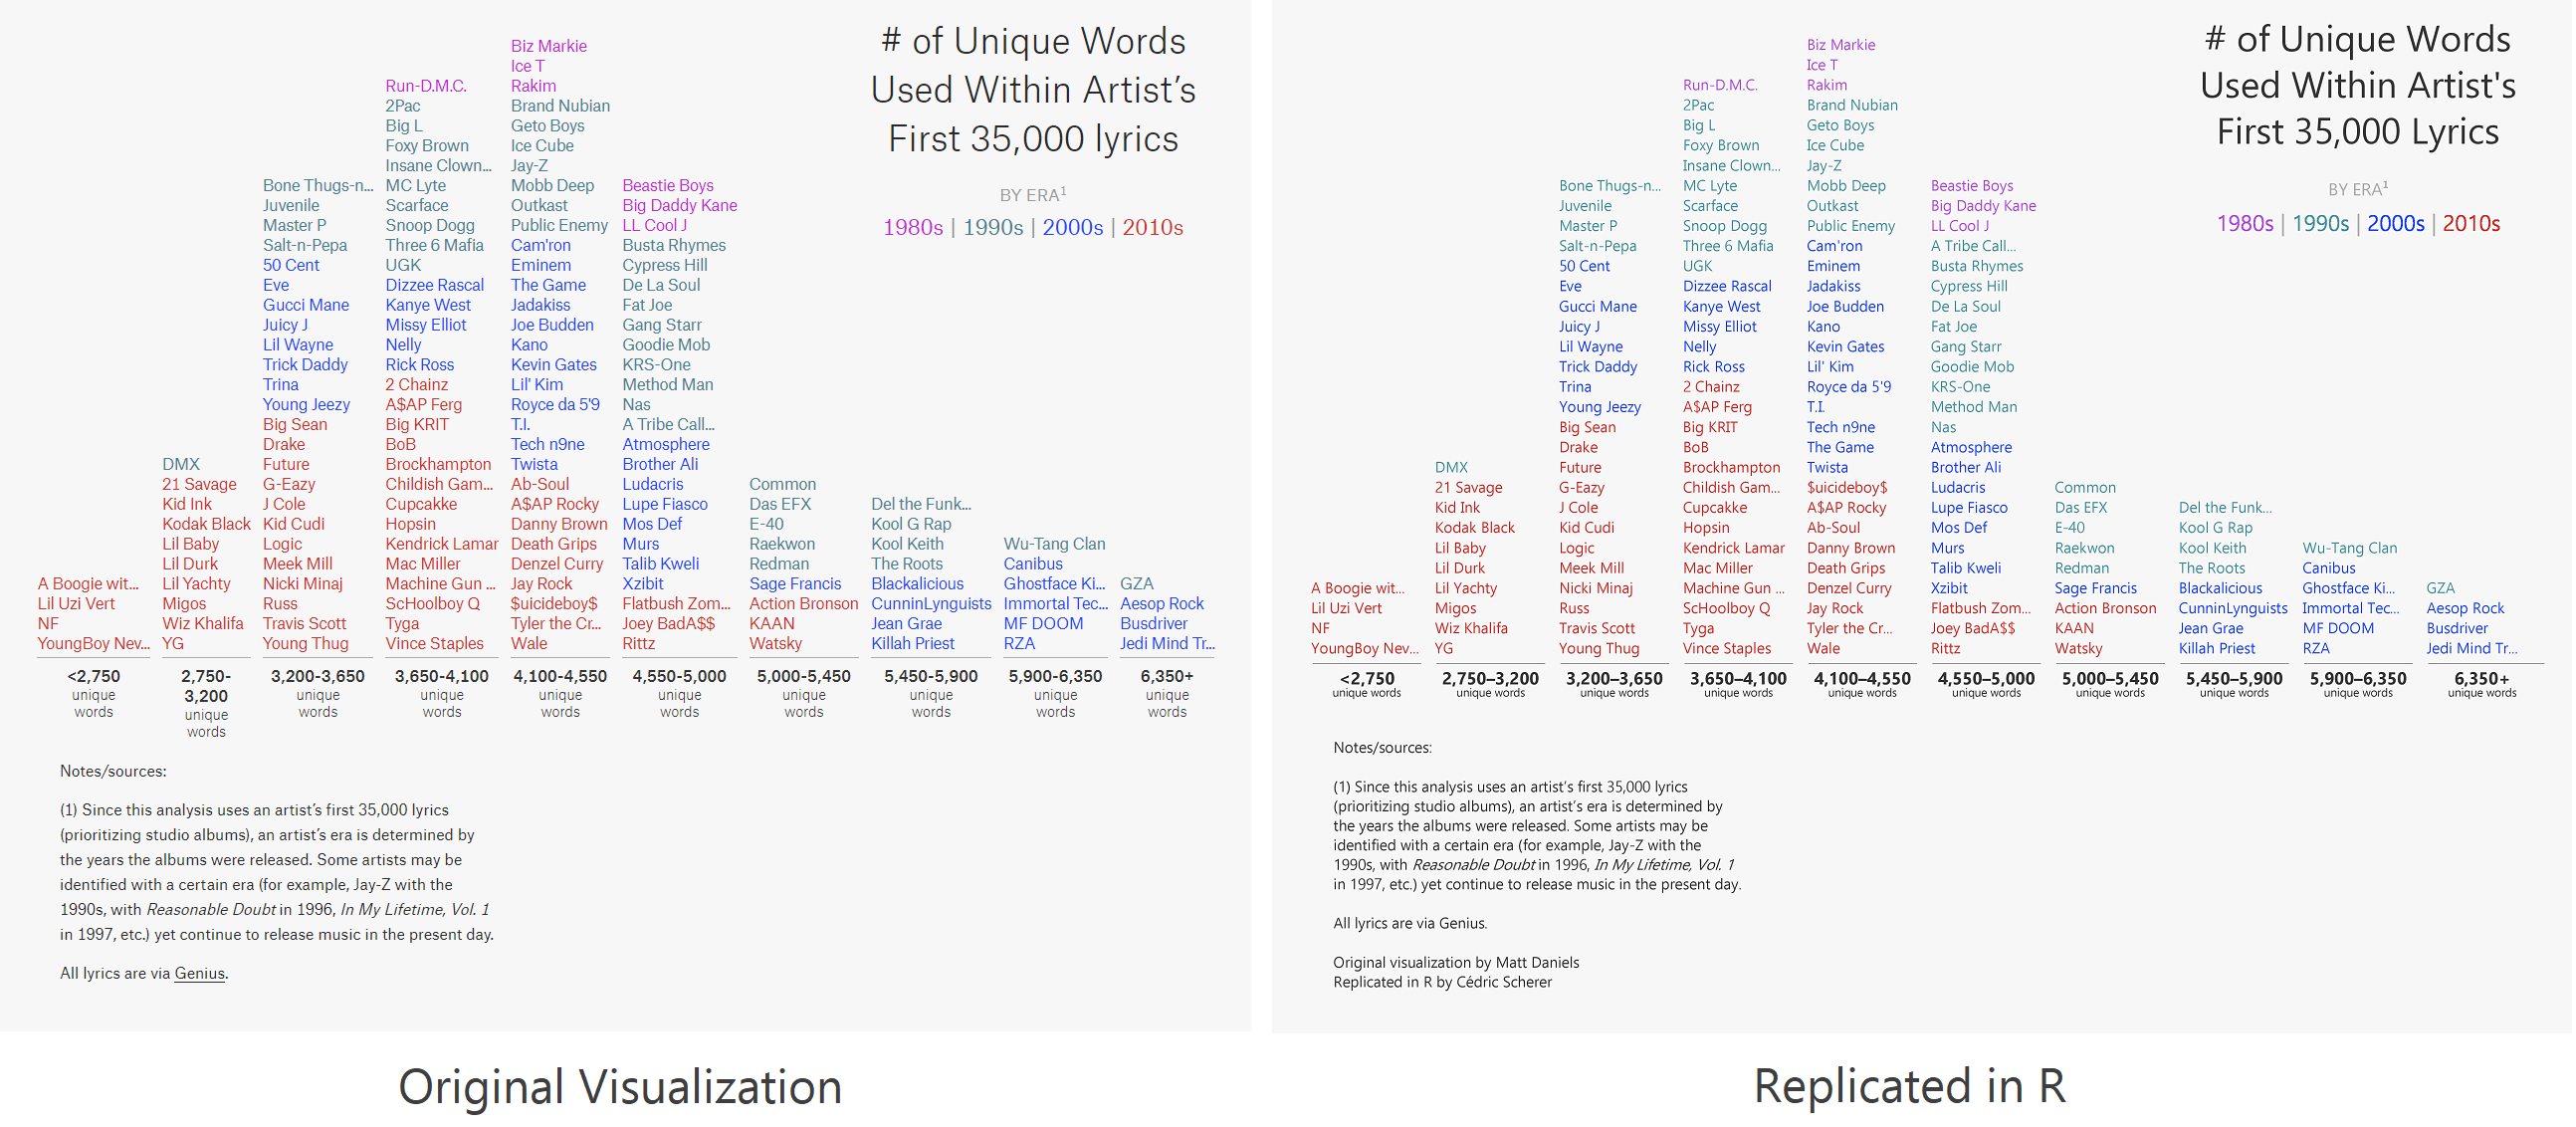
- 2019/50 🎤 Replicating Plots (Rap Edition)
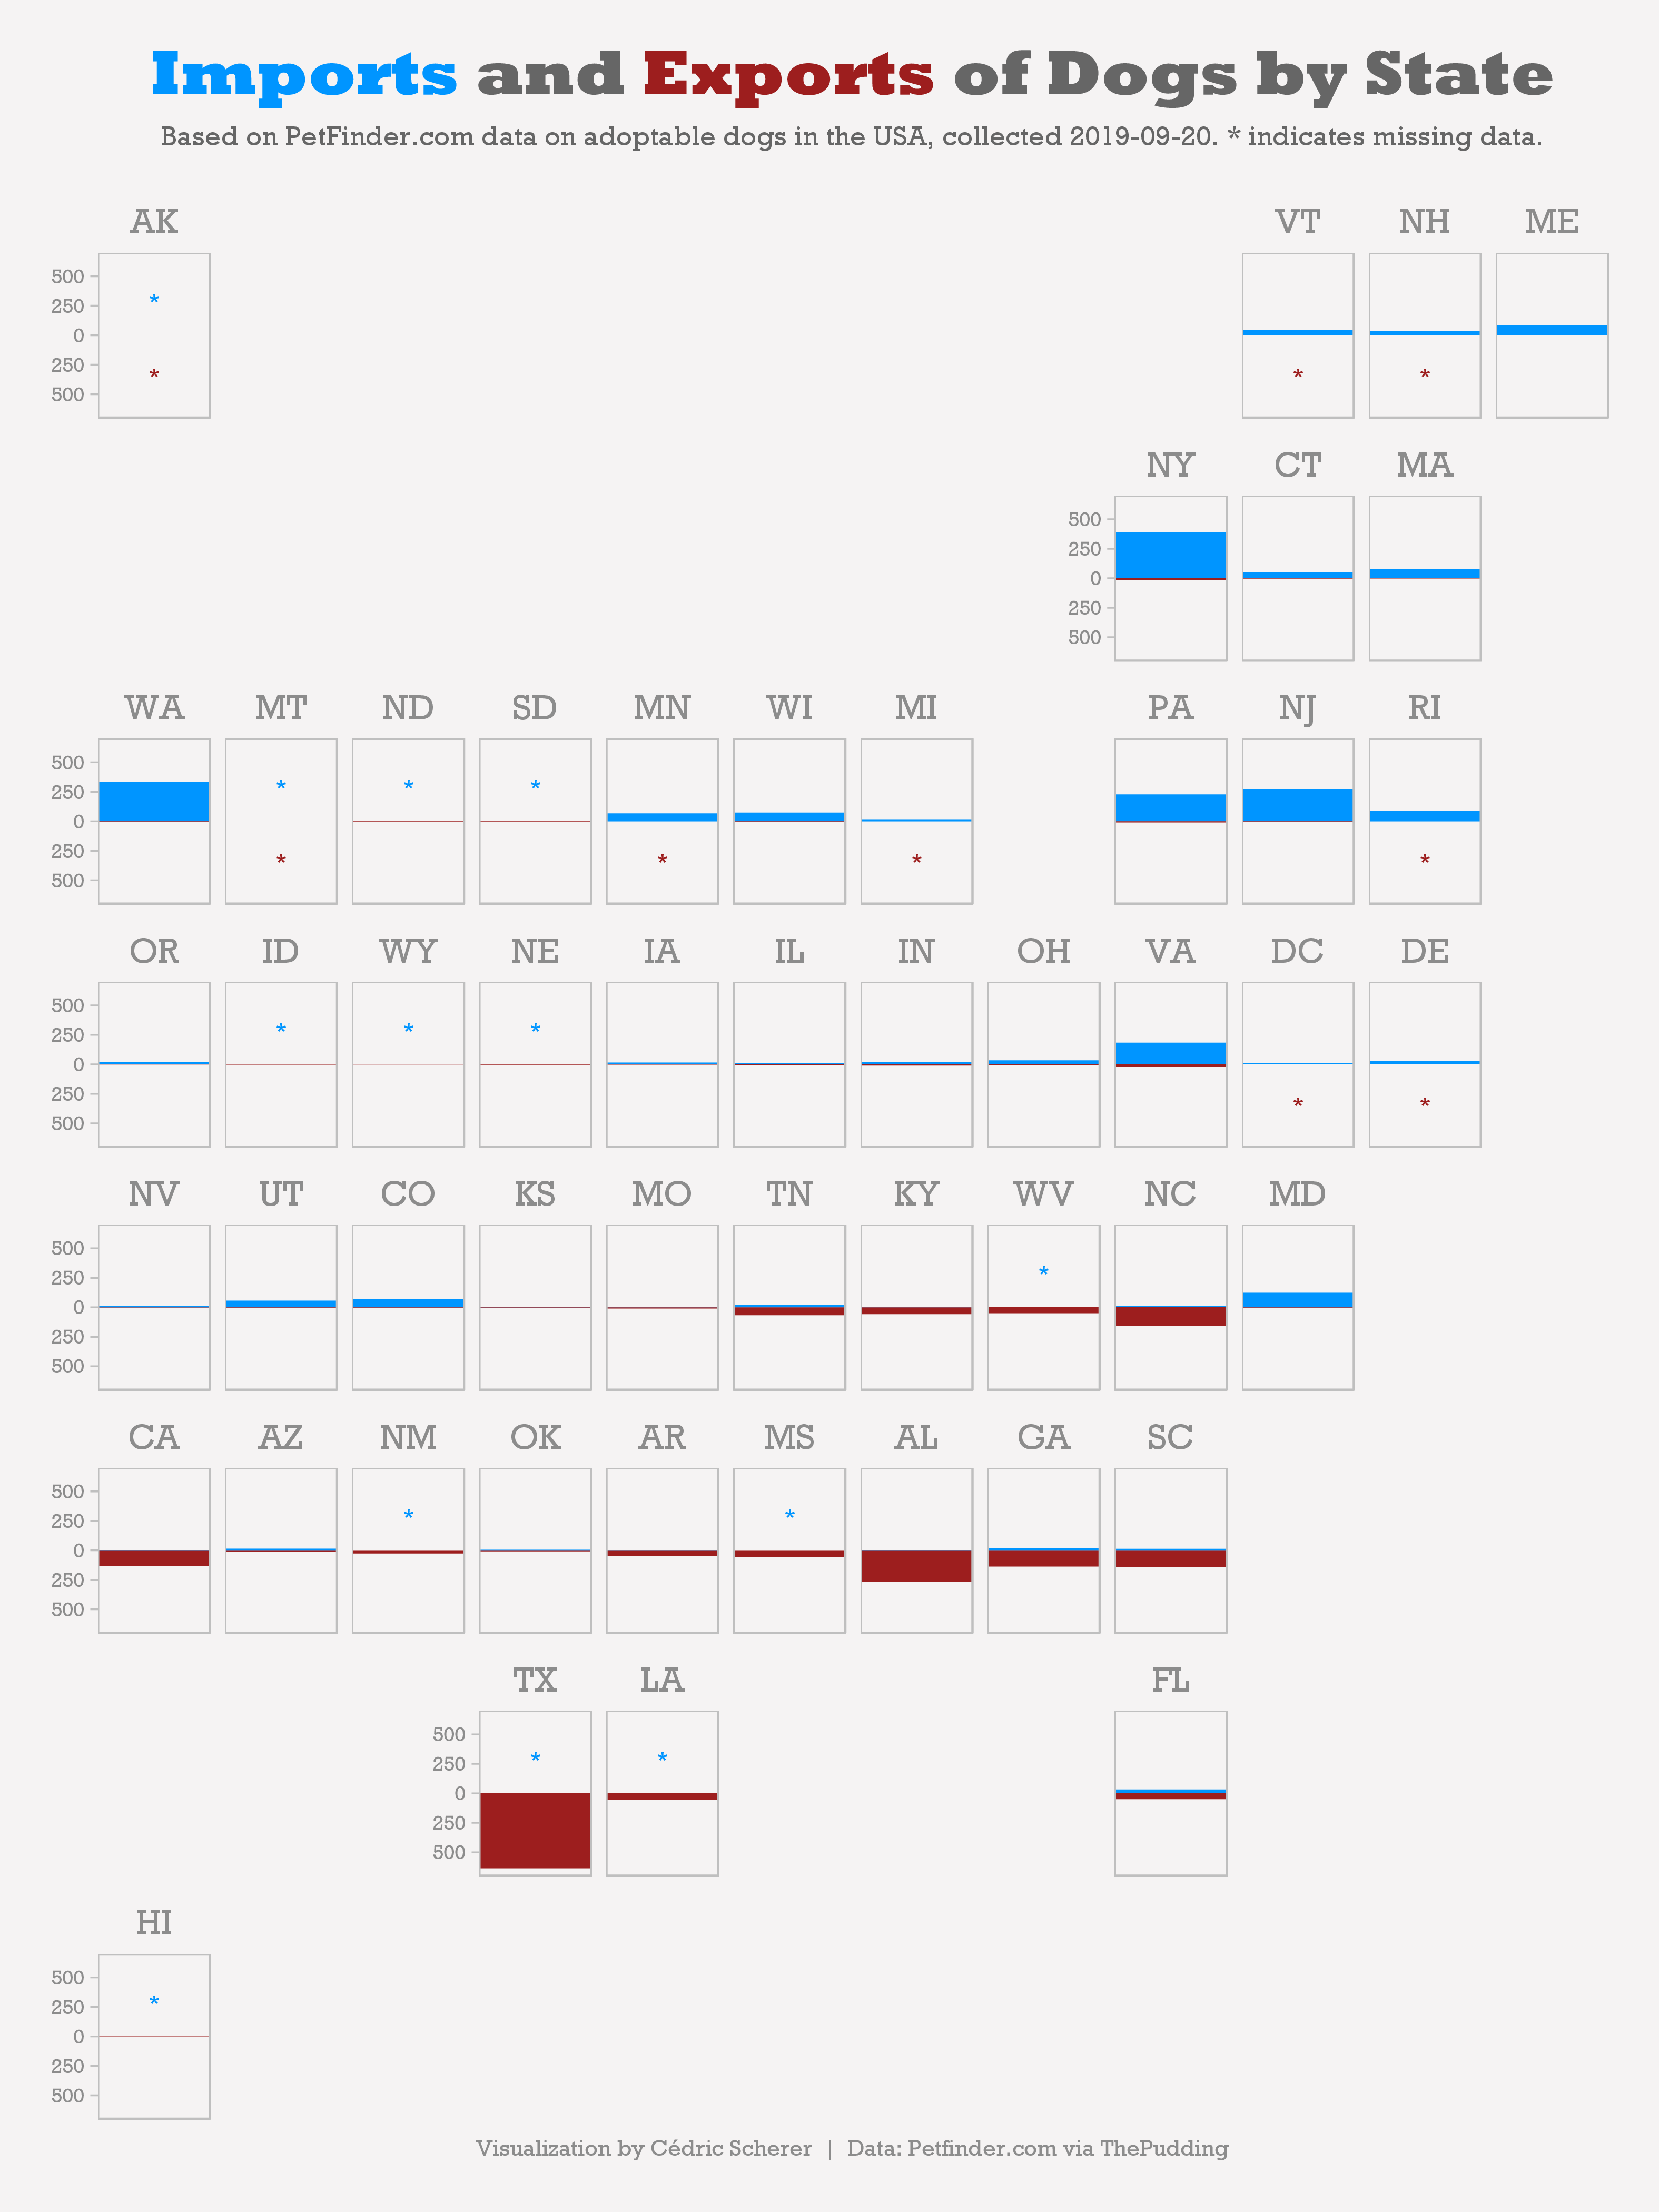
- 2019/51 🐩 Adoptable Dogs
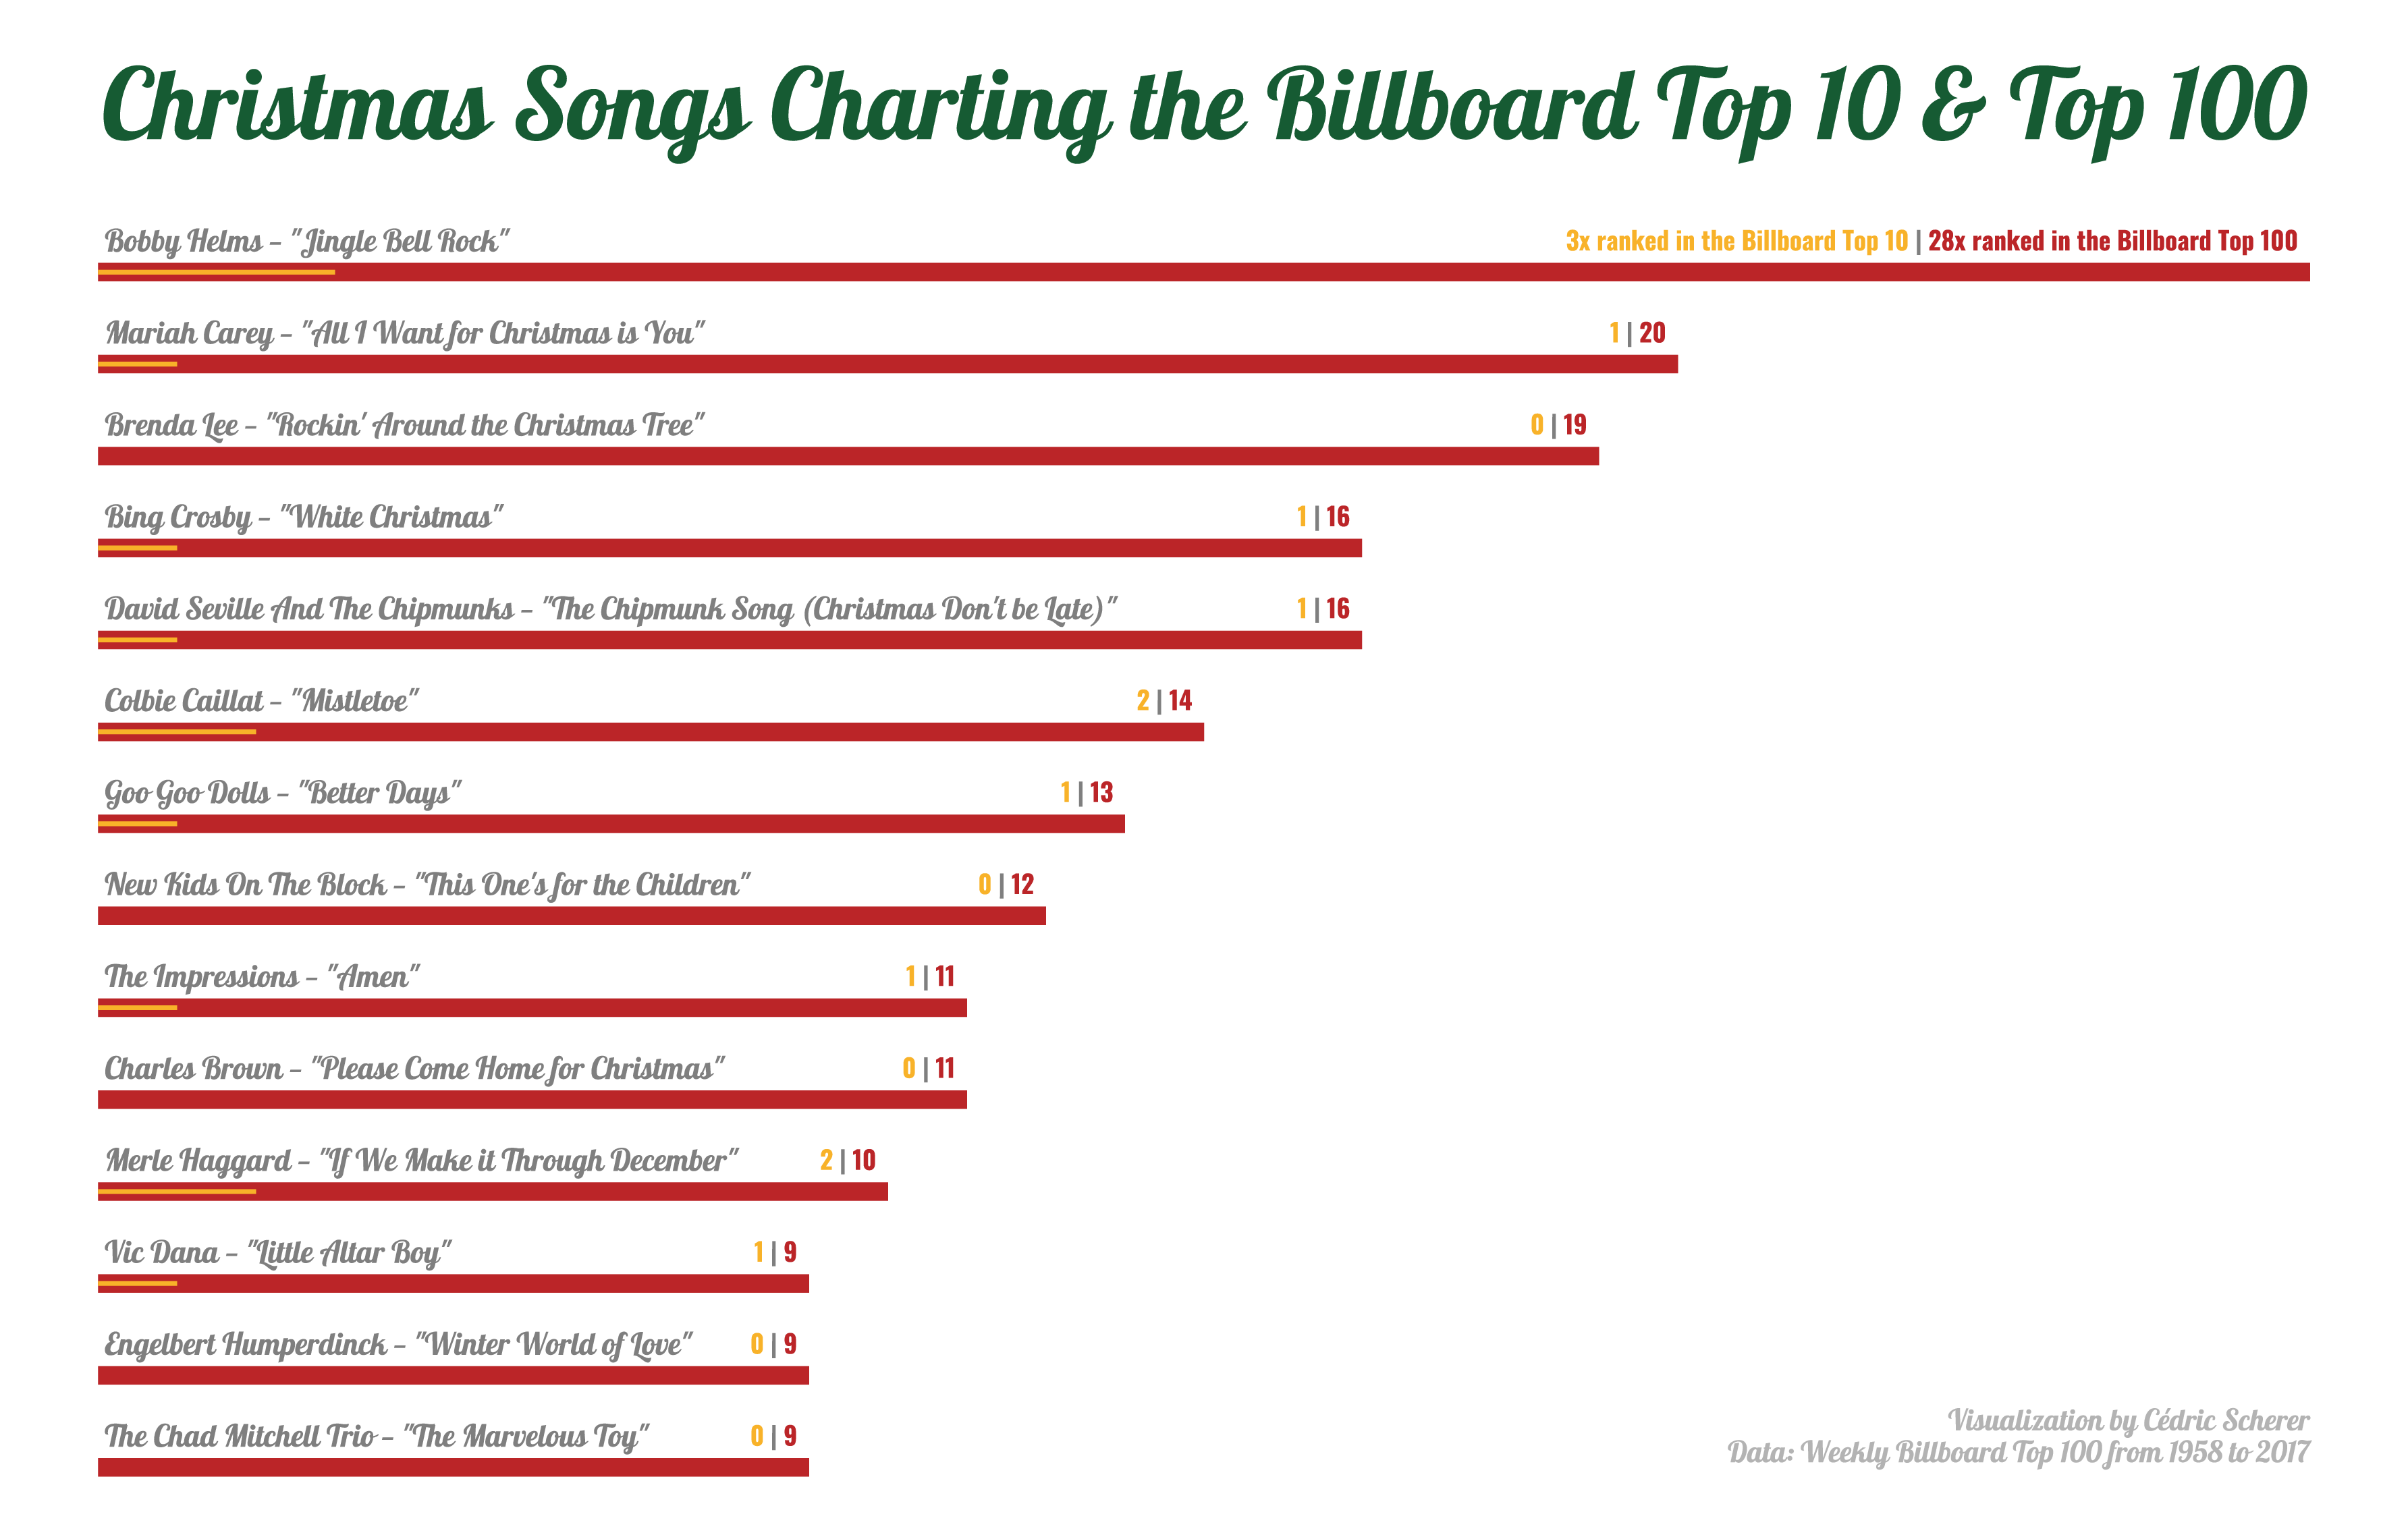
- 2019/52 🎄 Christmas Songs
-
Challenges 2020
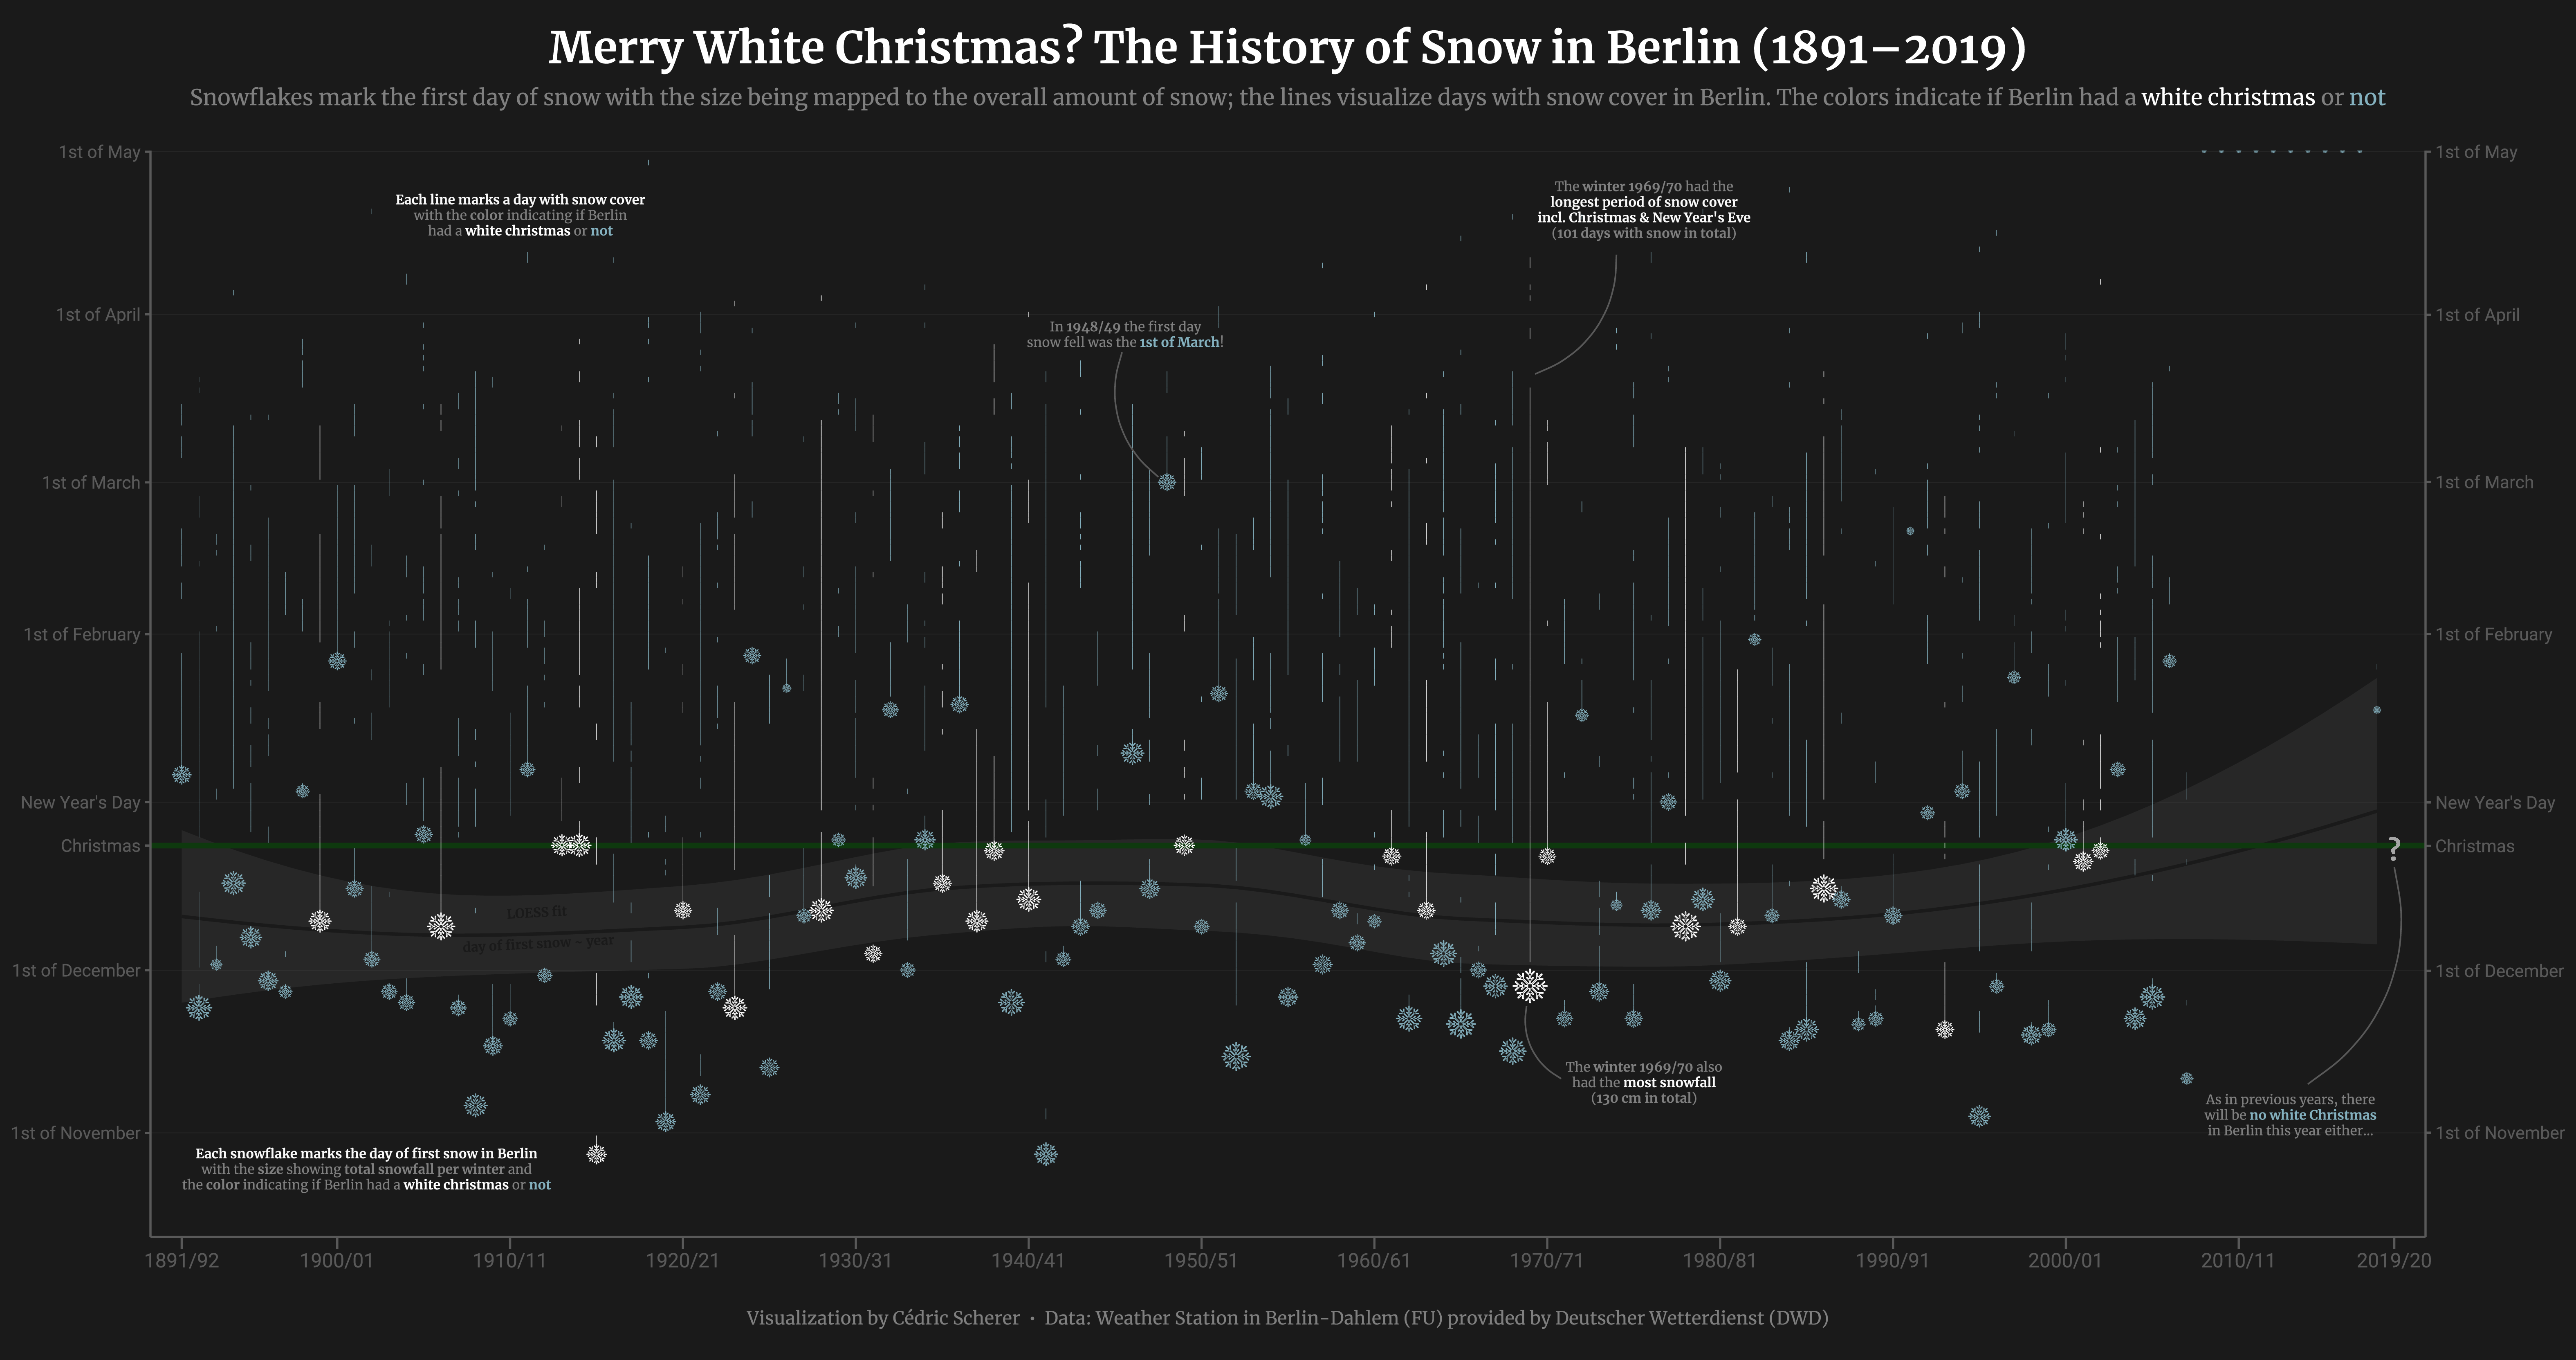
- 2020/01 ❄️️ Bring Your Own Data: White Christmas in Berlin
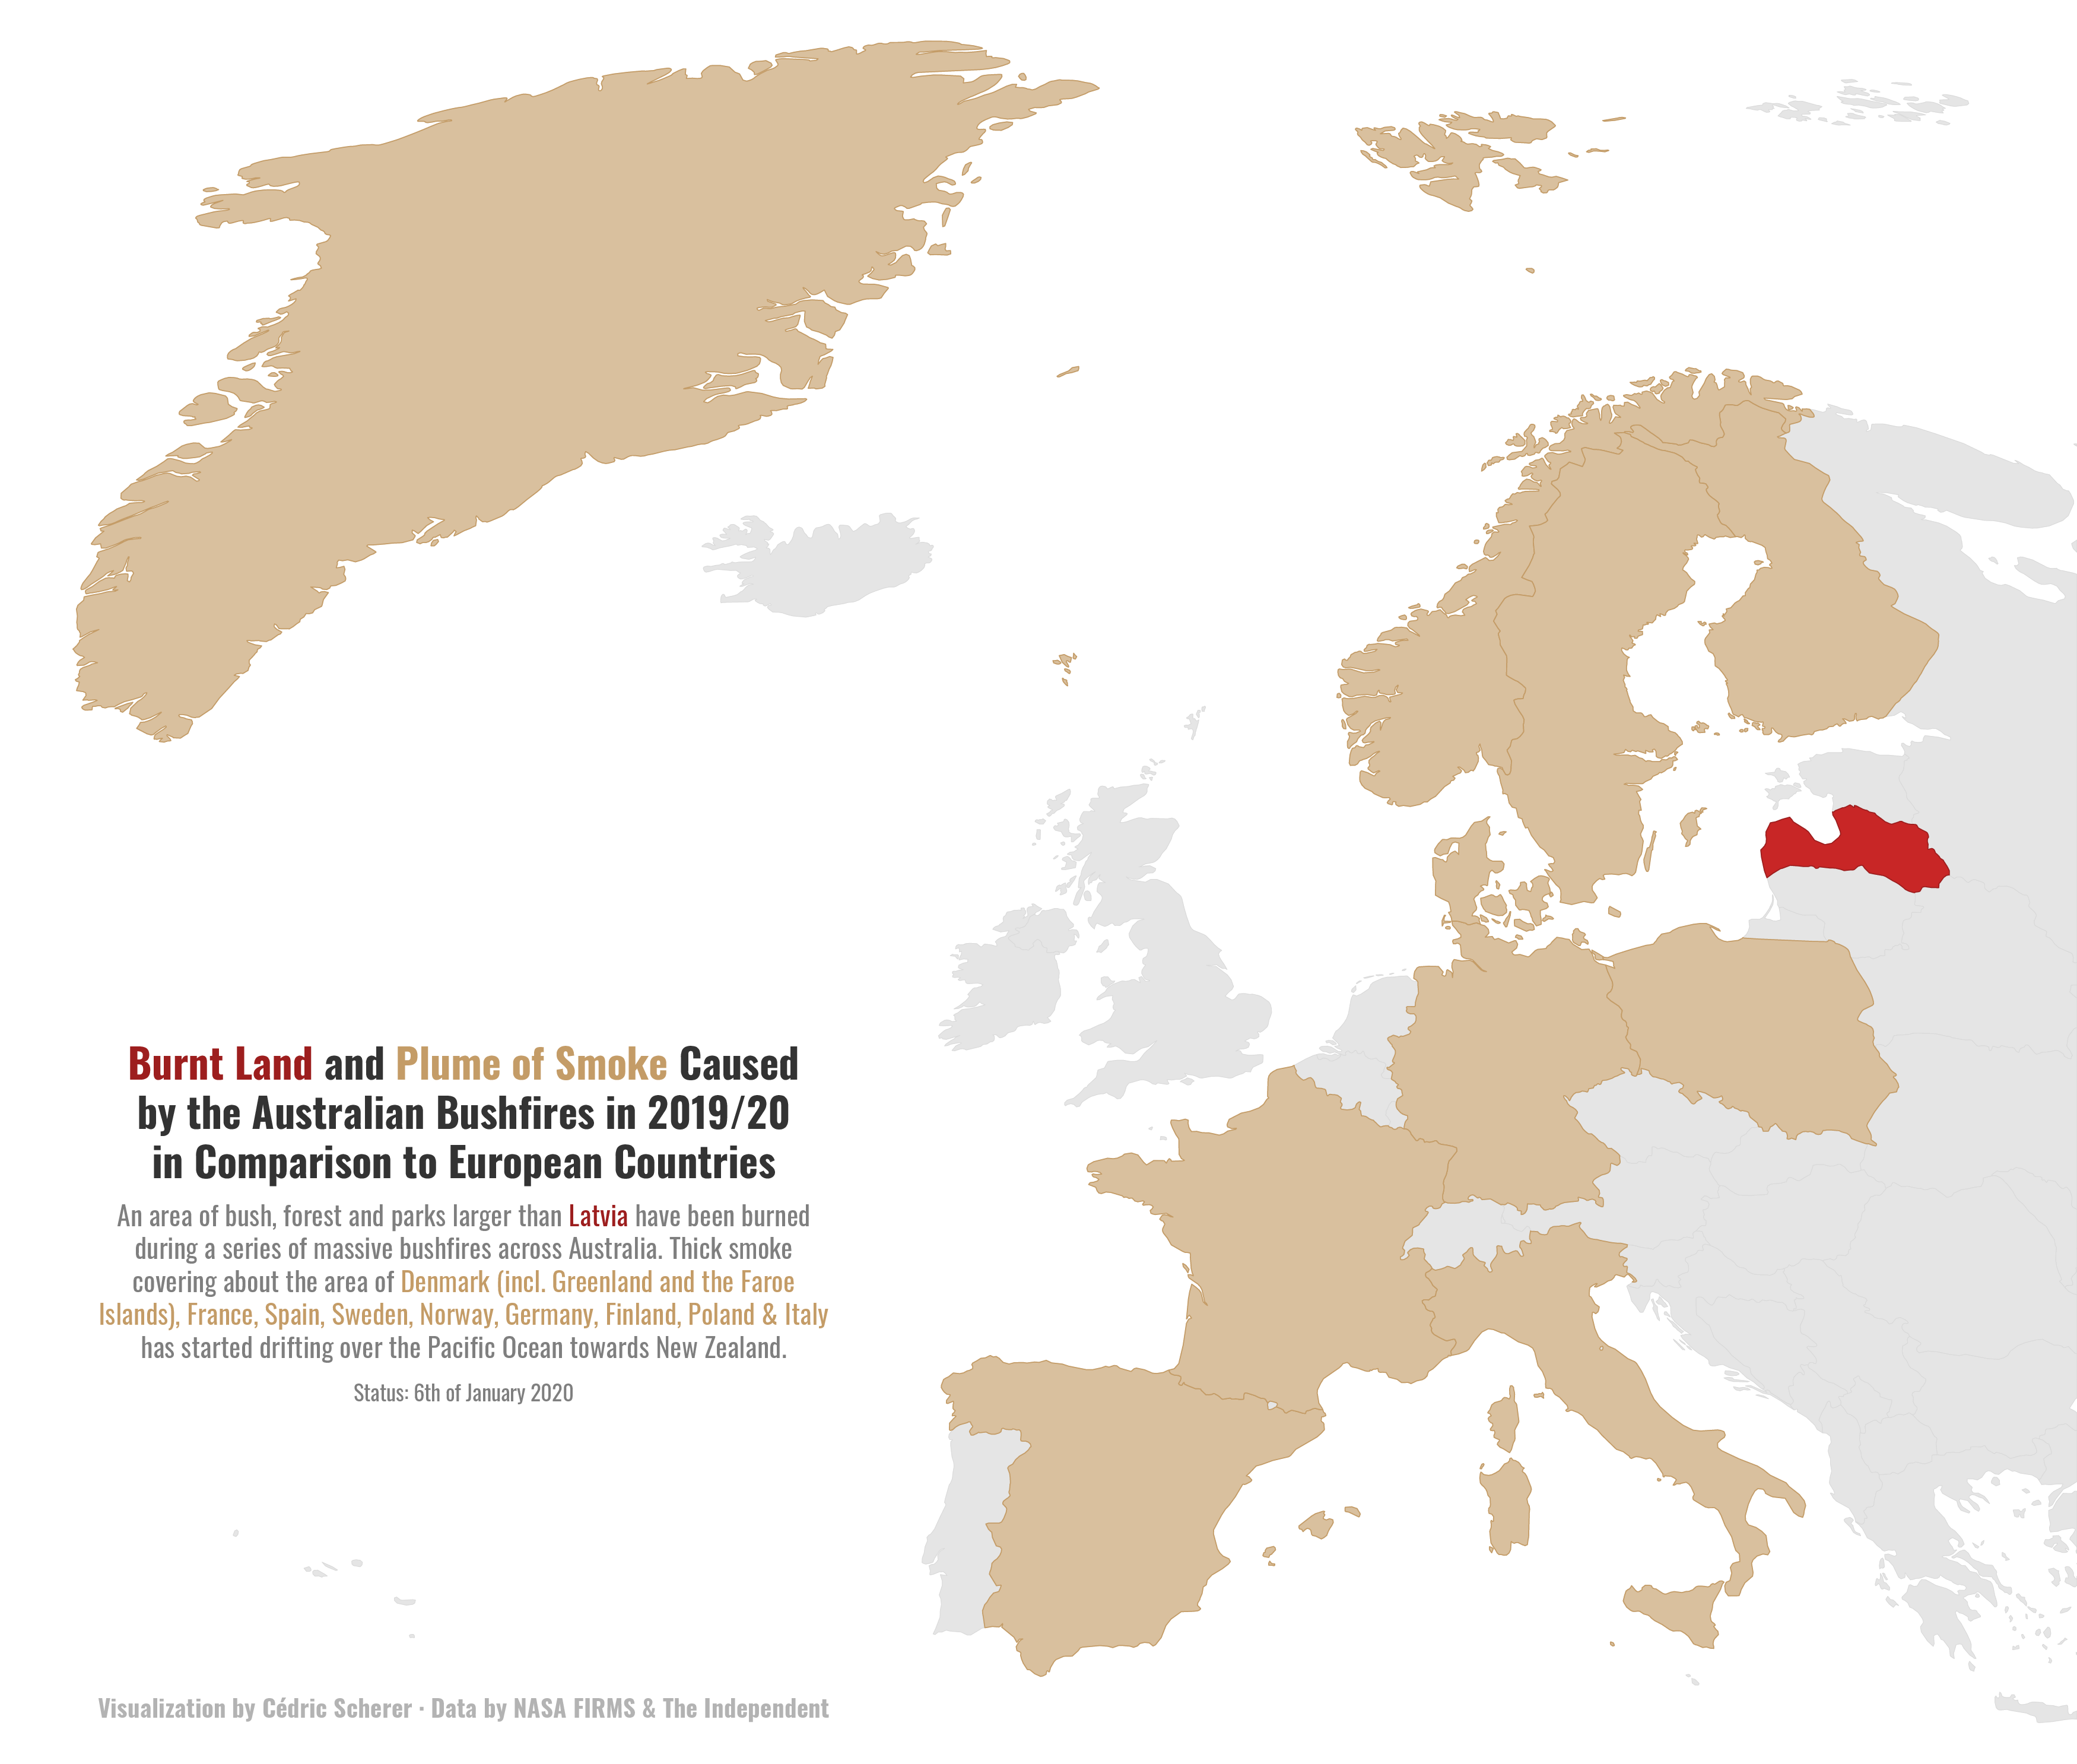
- 2020/02 🔥 Australian Fires
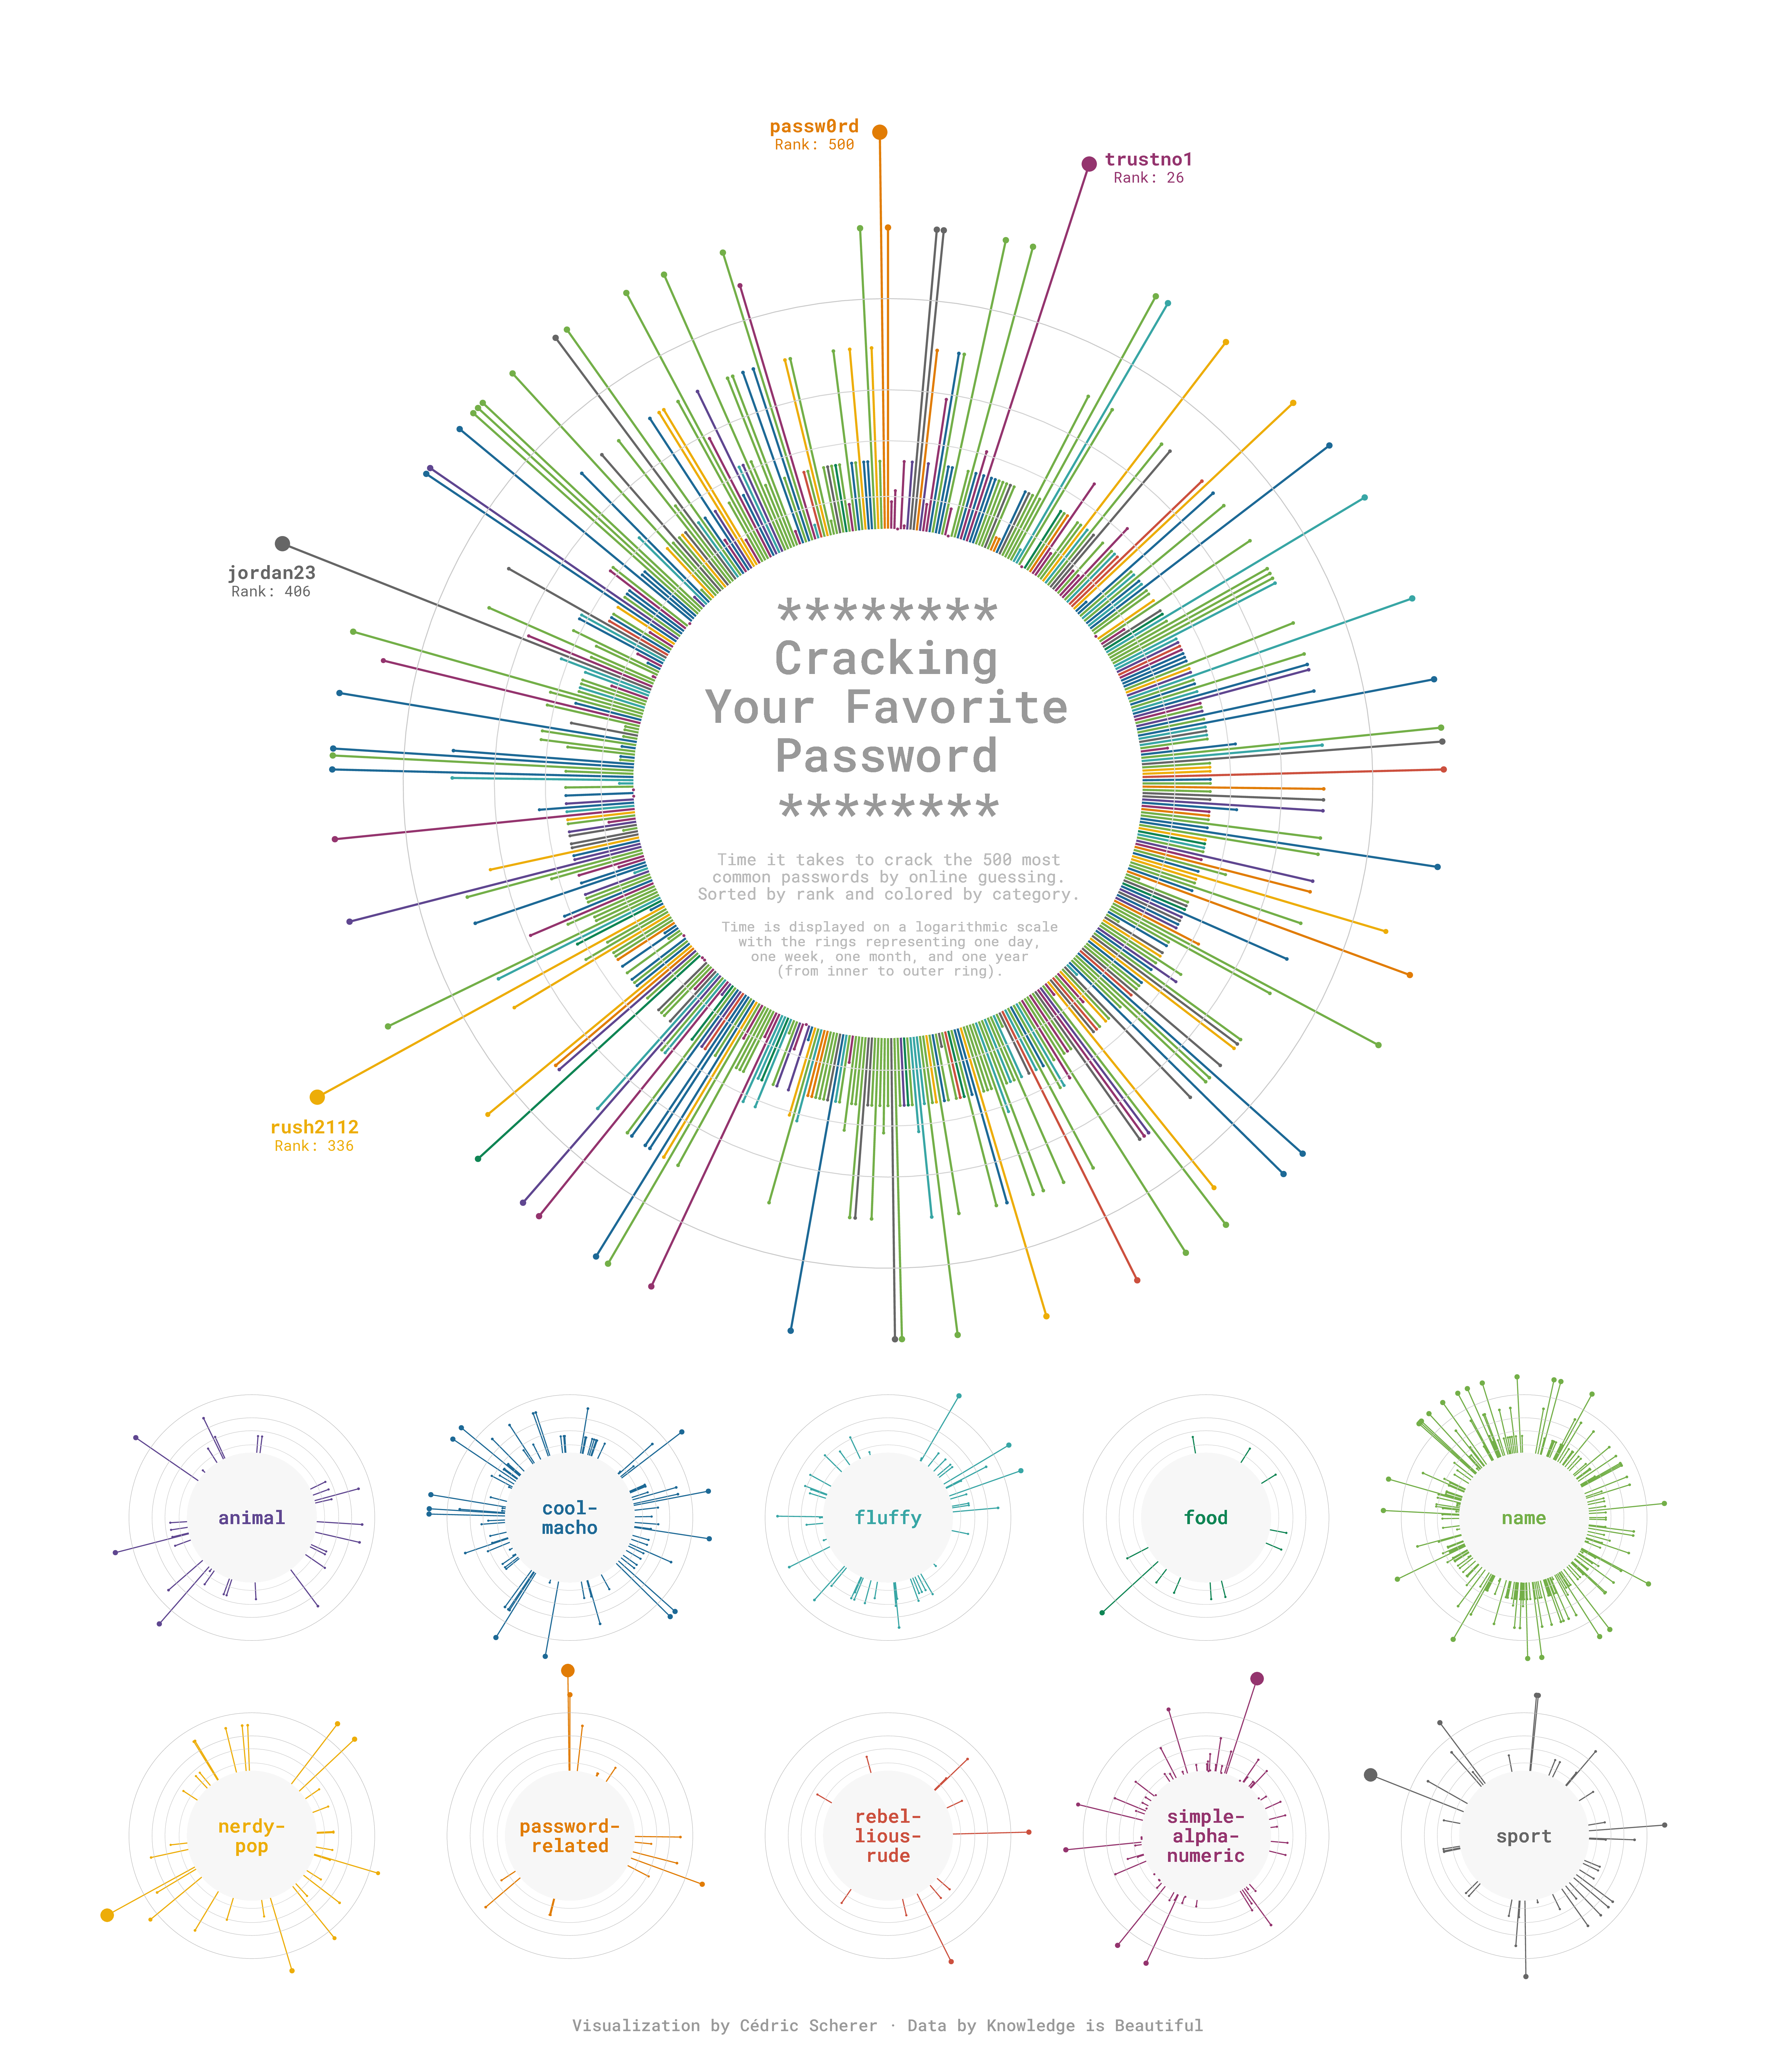
- 2020/03 🔑 Passwords
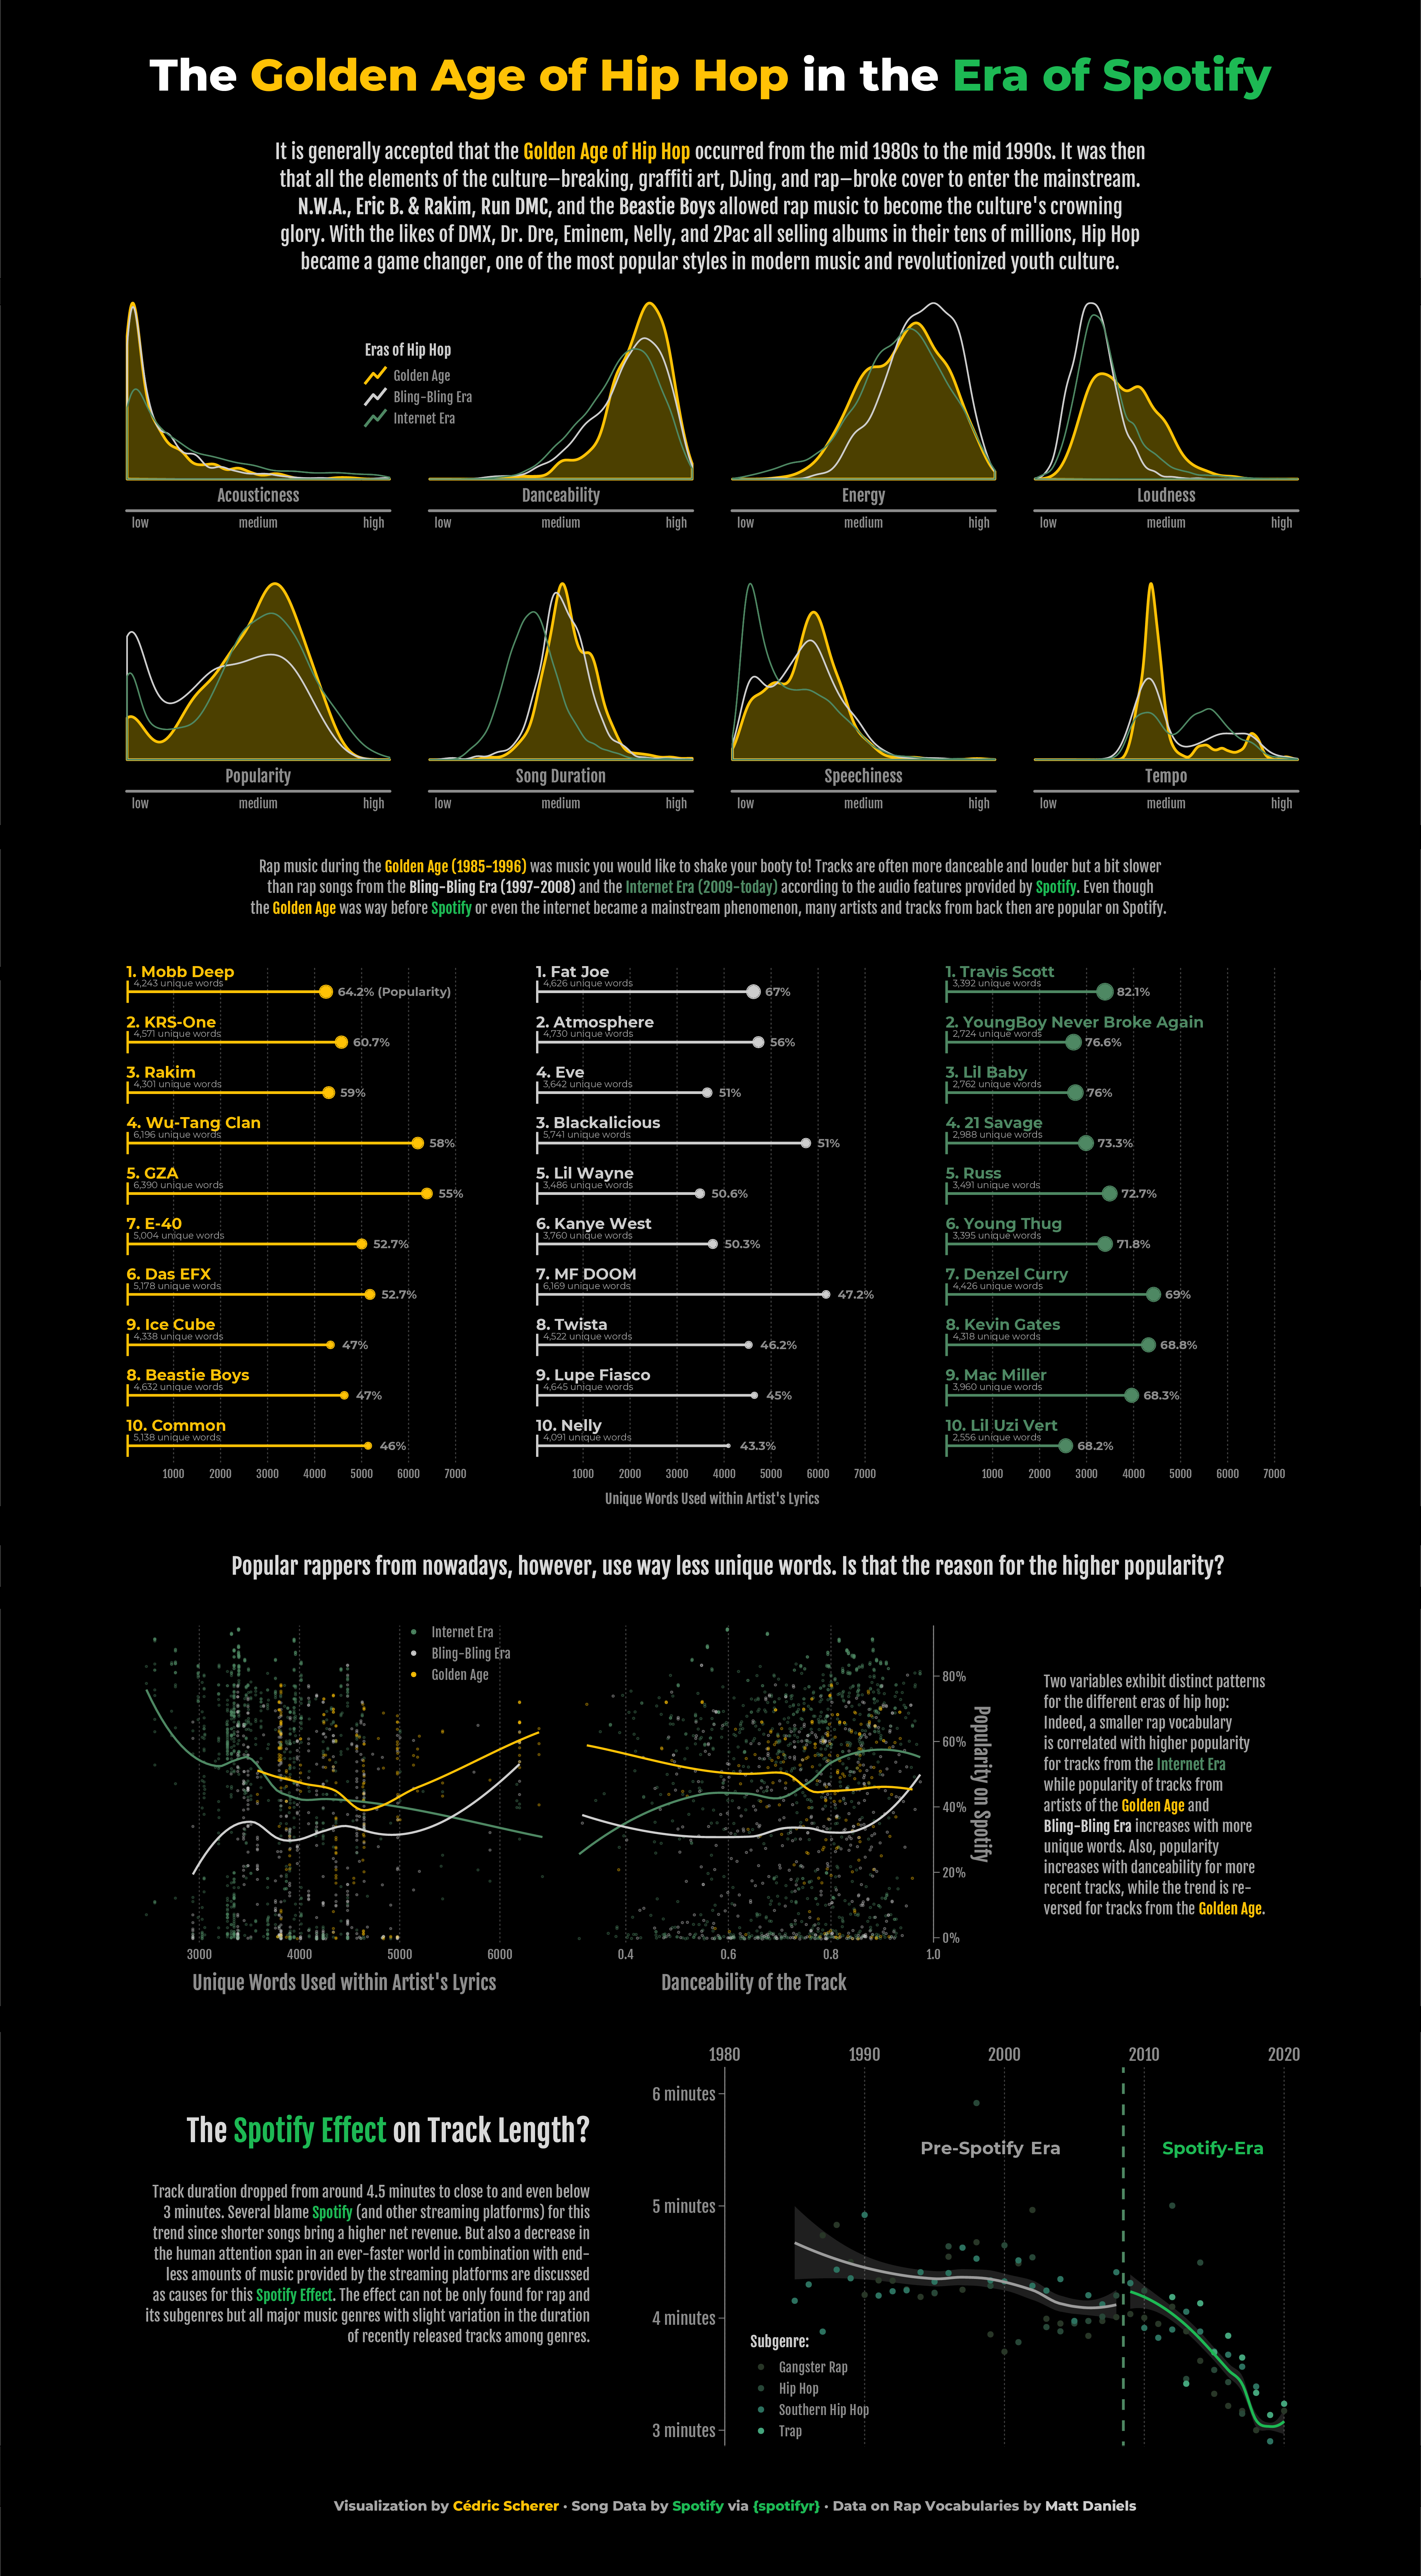
- 2020/04 🎶 Spotify Songs: The Golden Age of Hip Hop
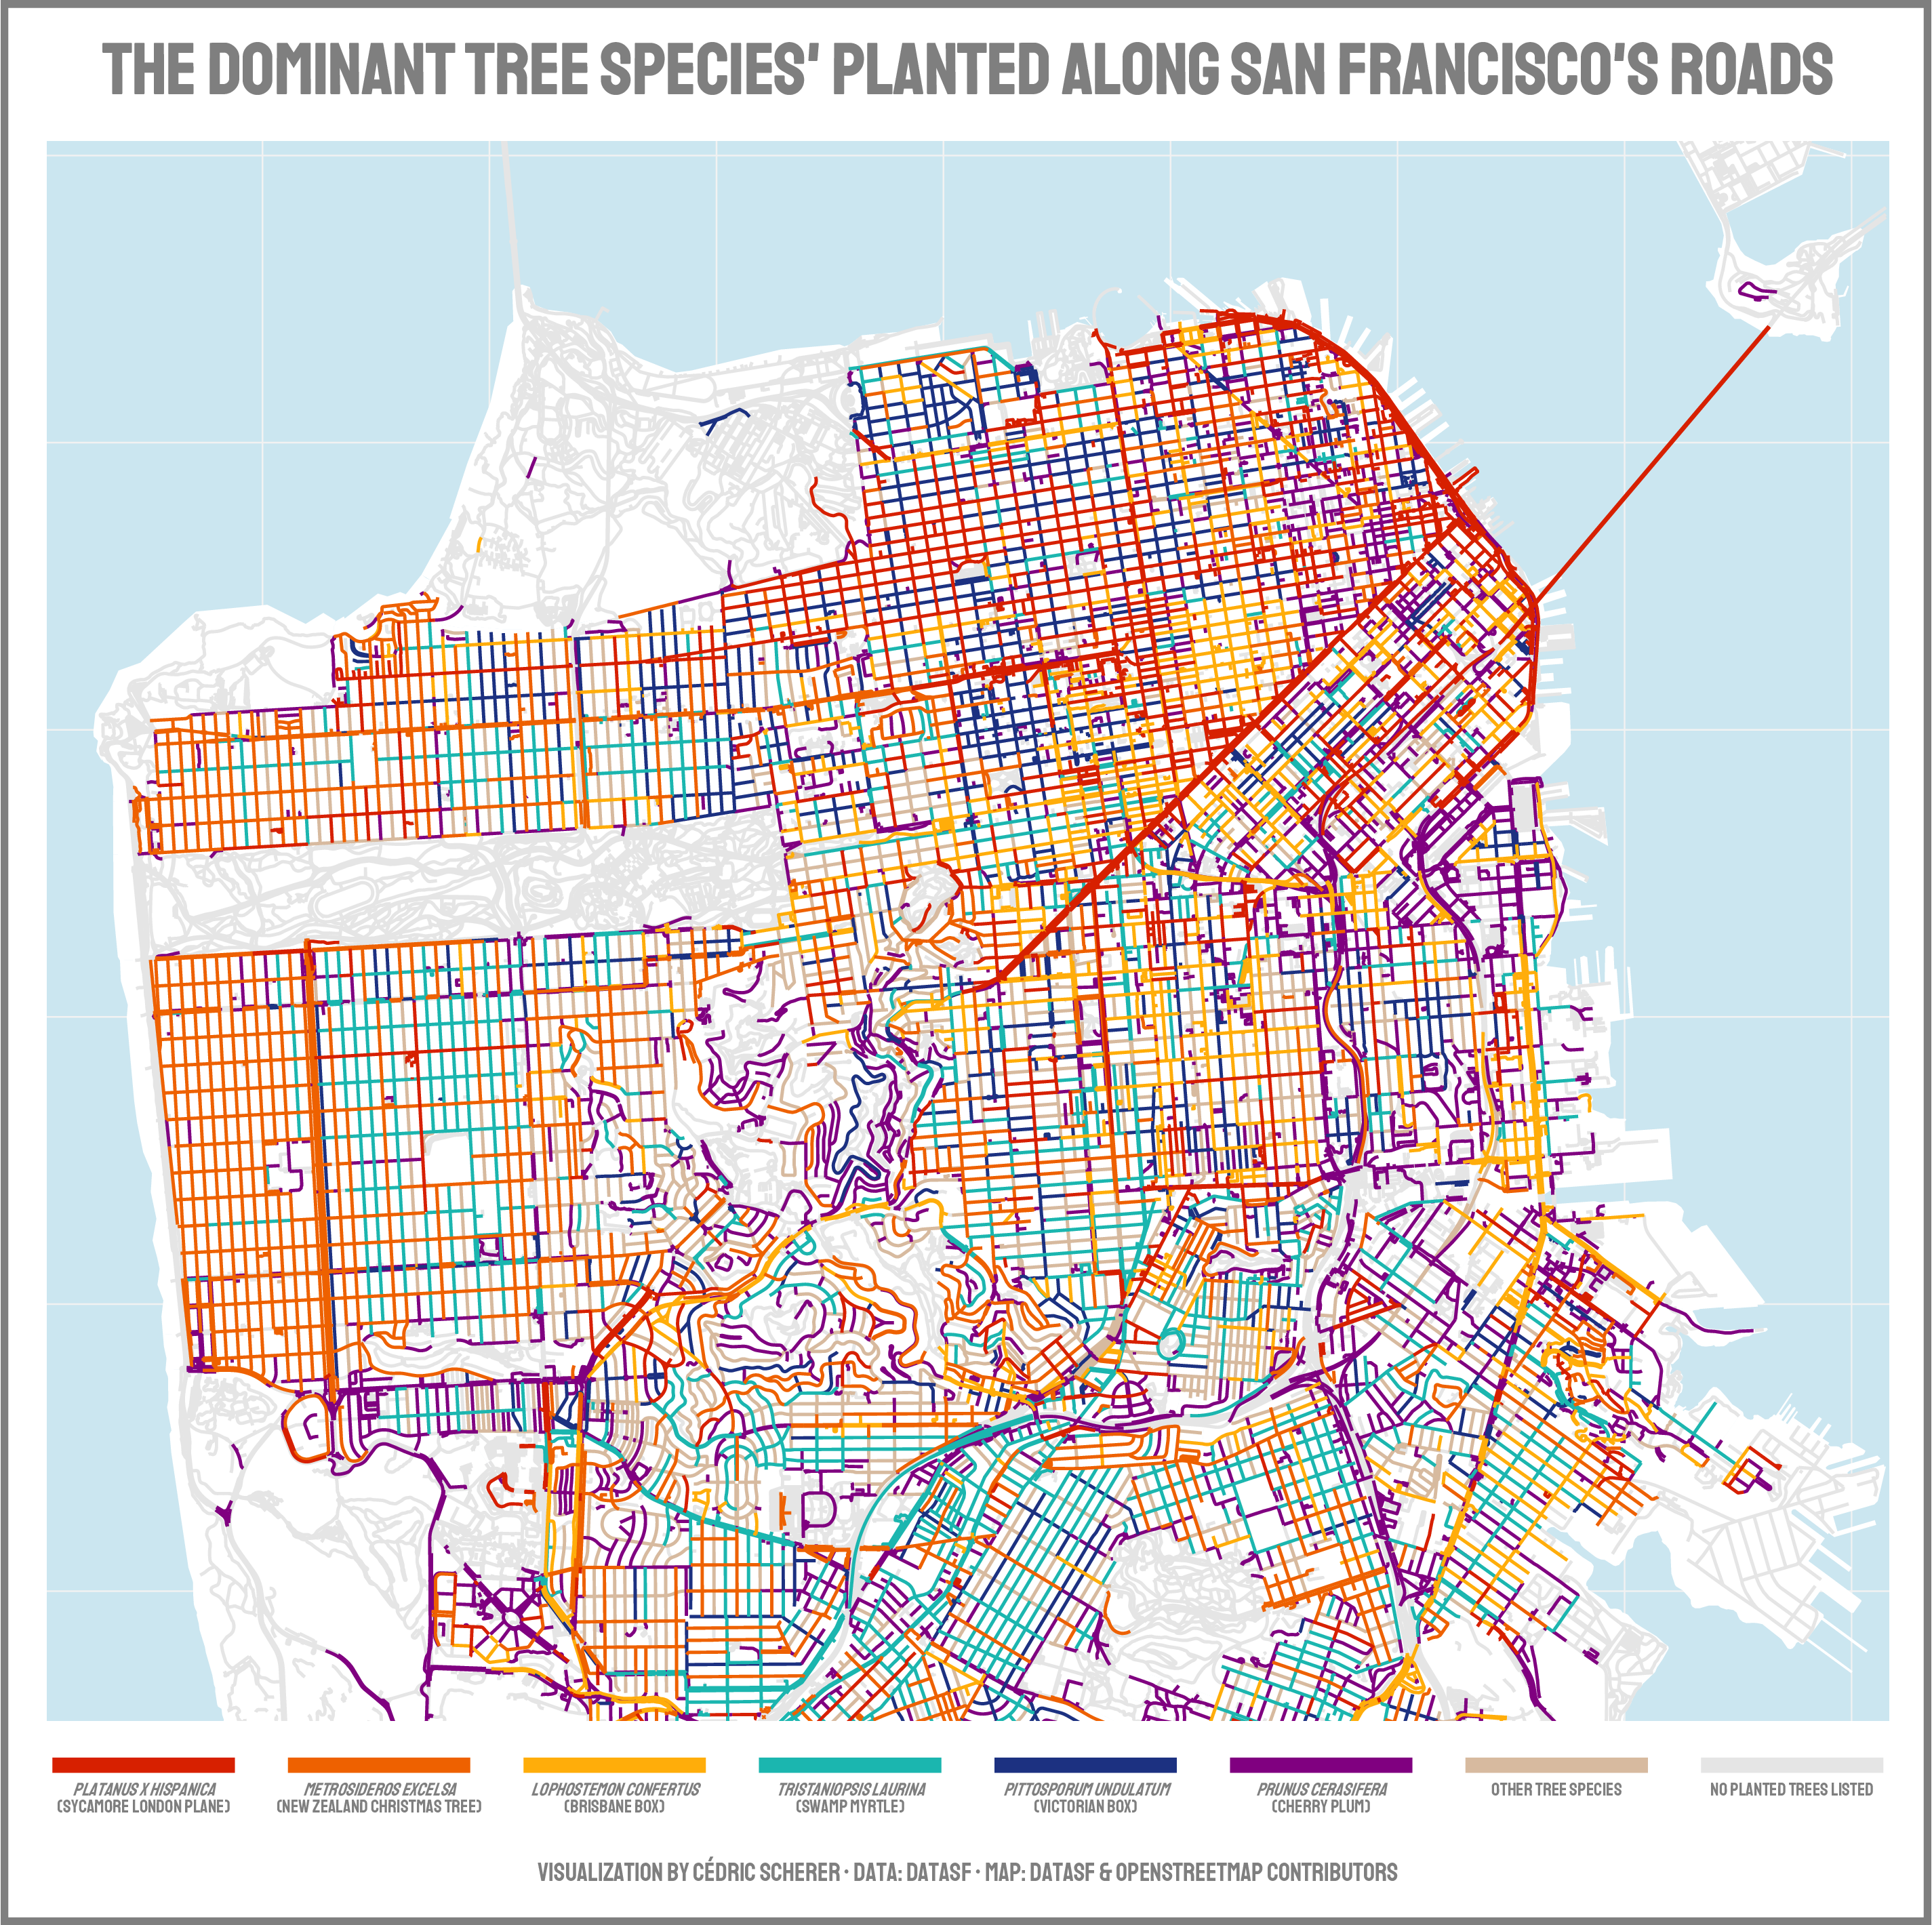
- 2020/05 🌳 San Francisco Trees
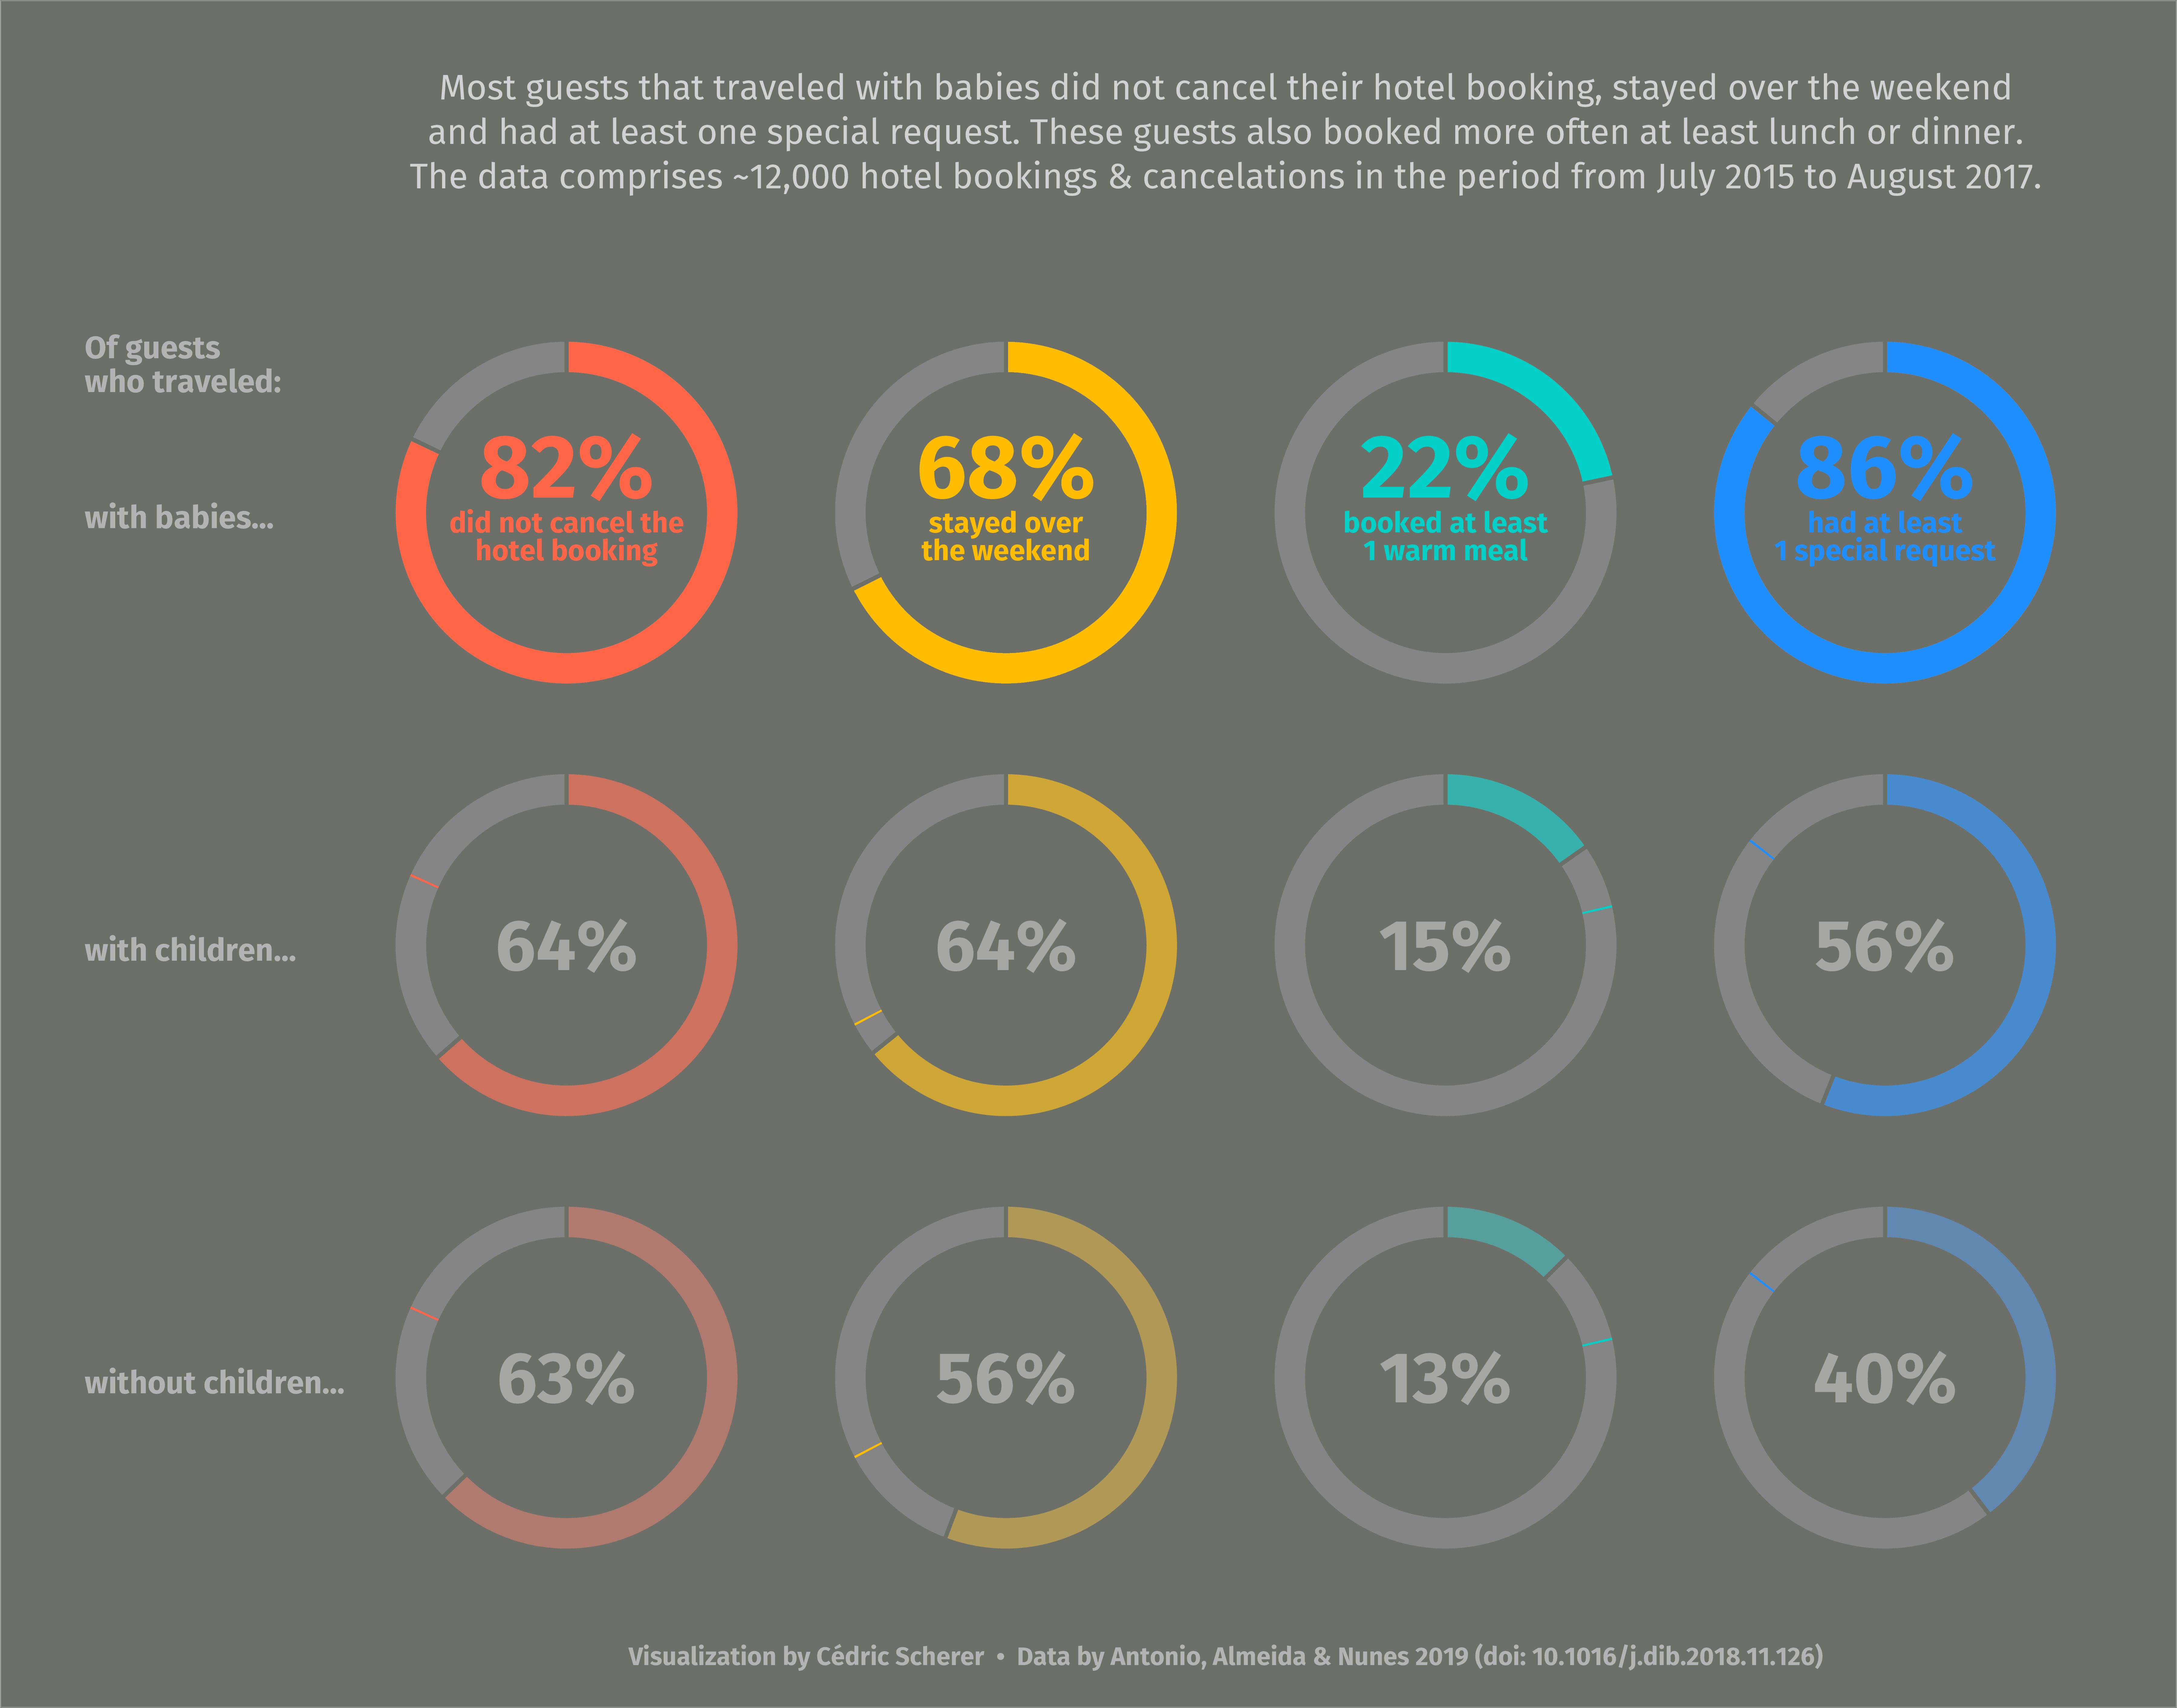
- 2020/07 🛏️ Hotel Bookings
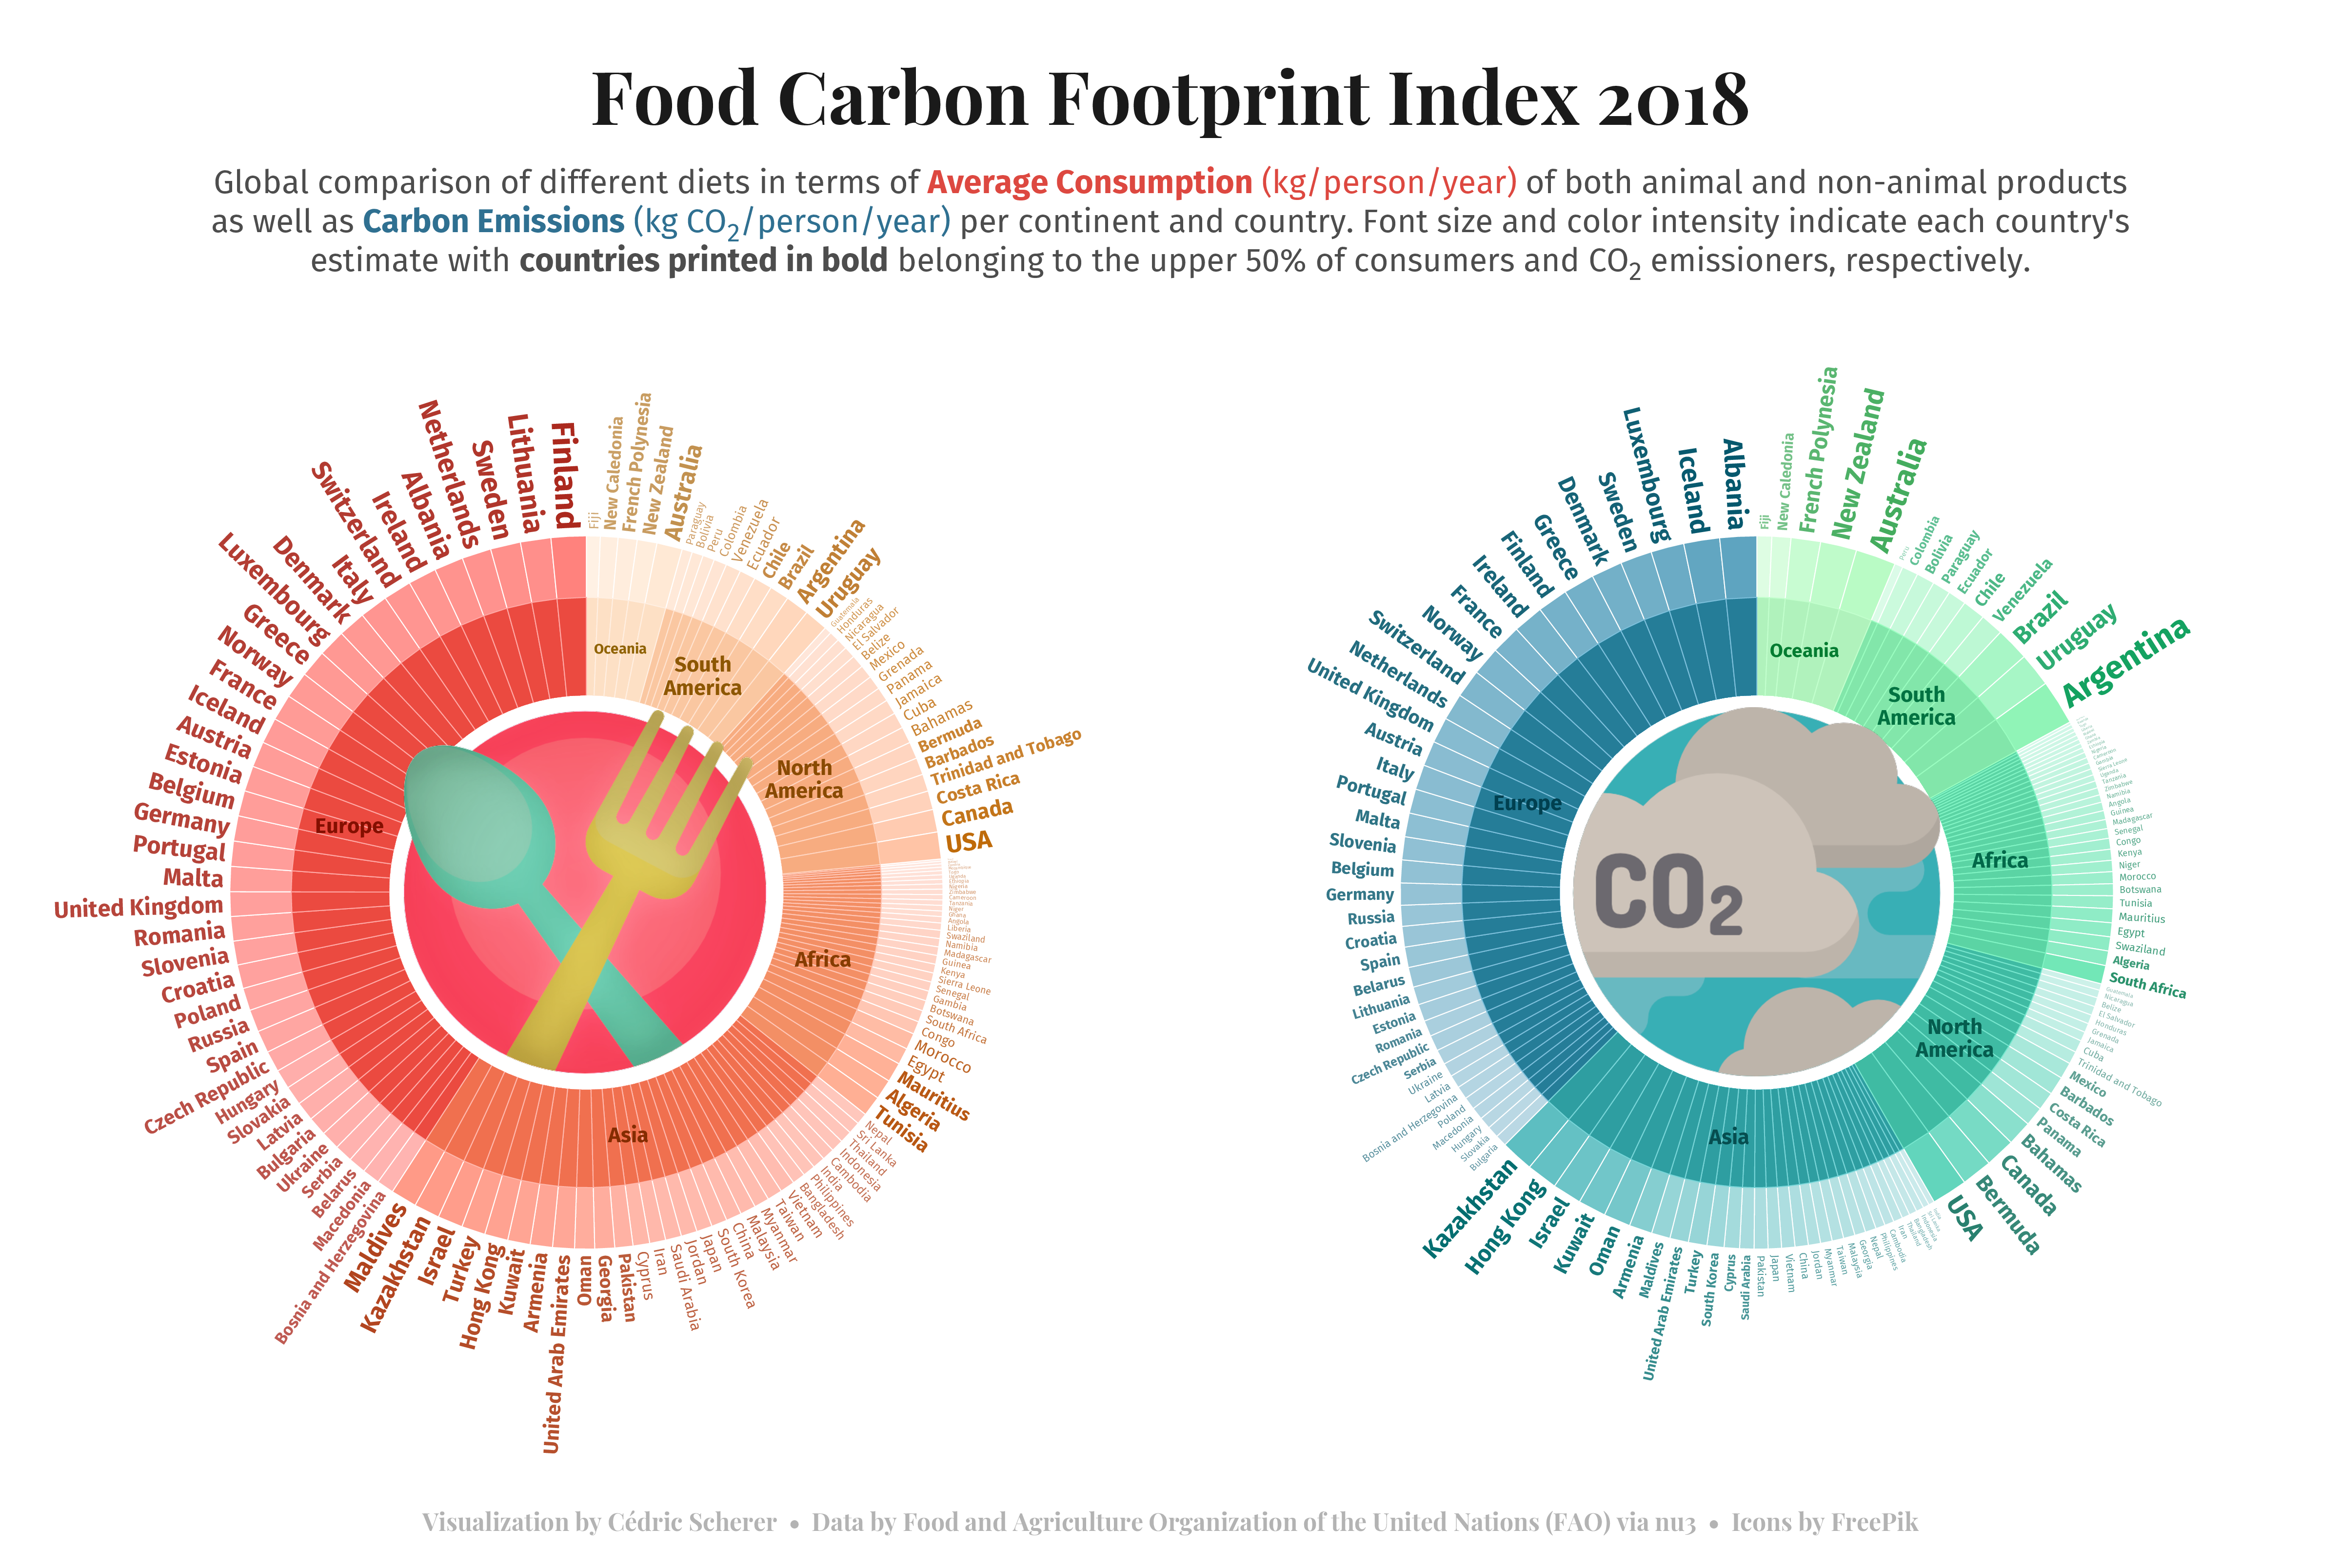
- 2020/08 🍖 Foot Carbon Footprint
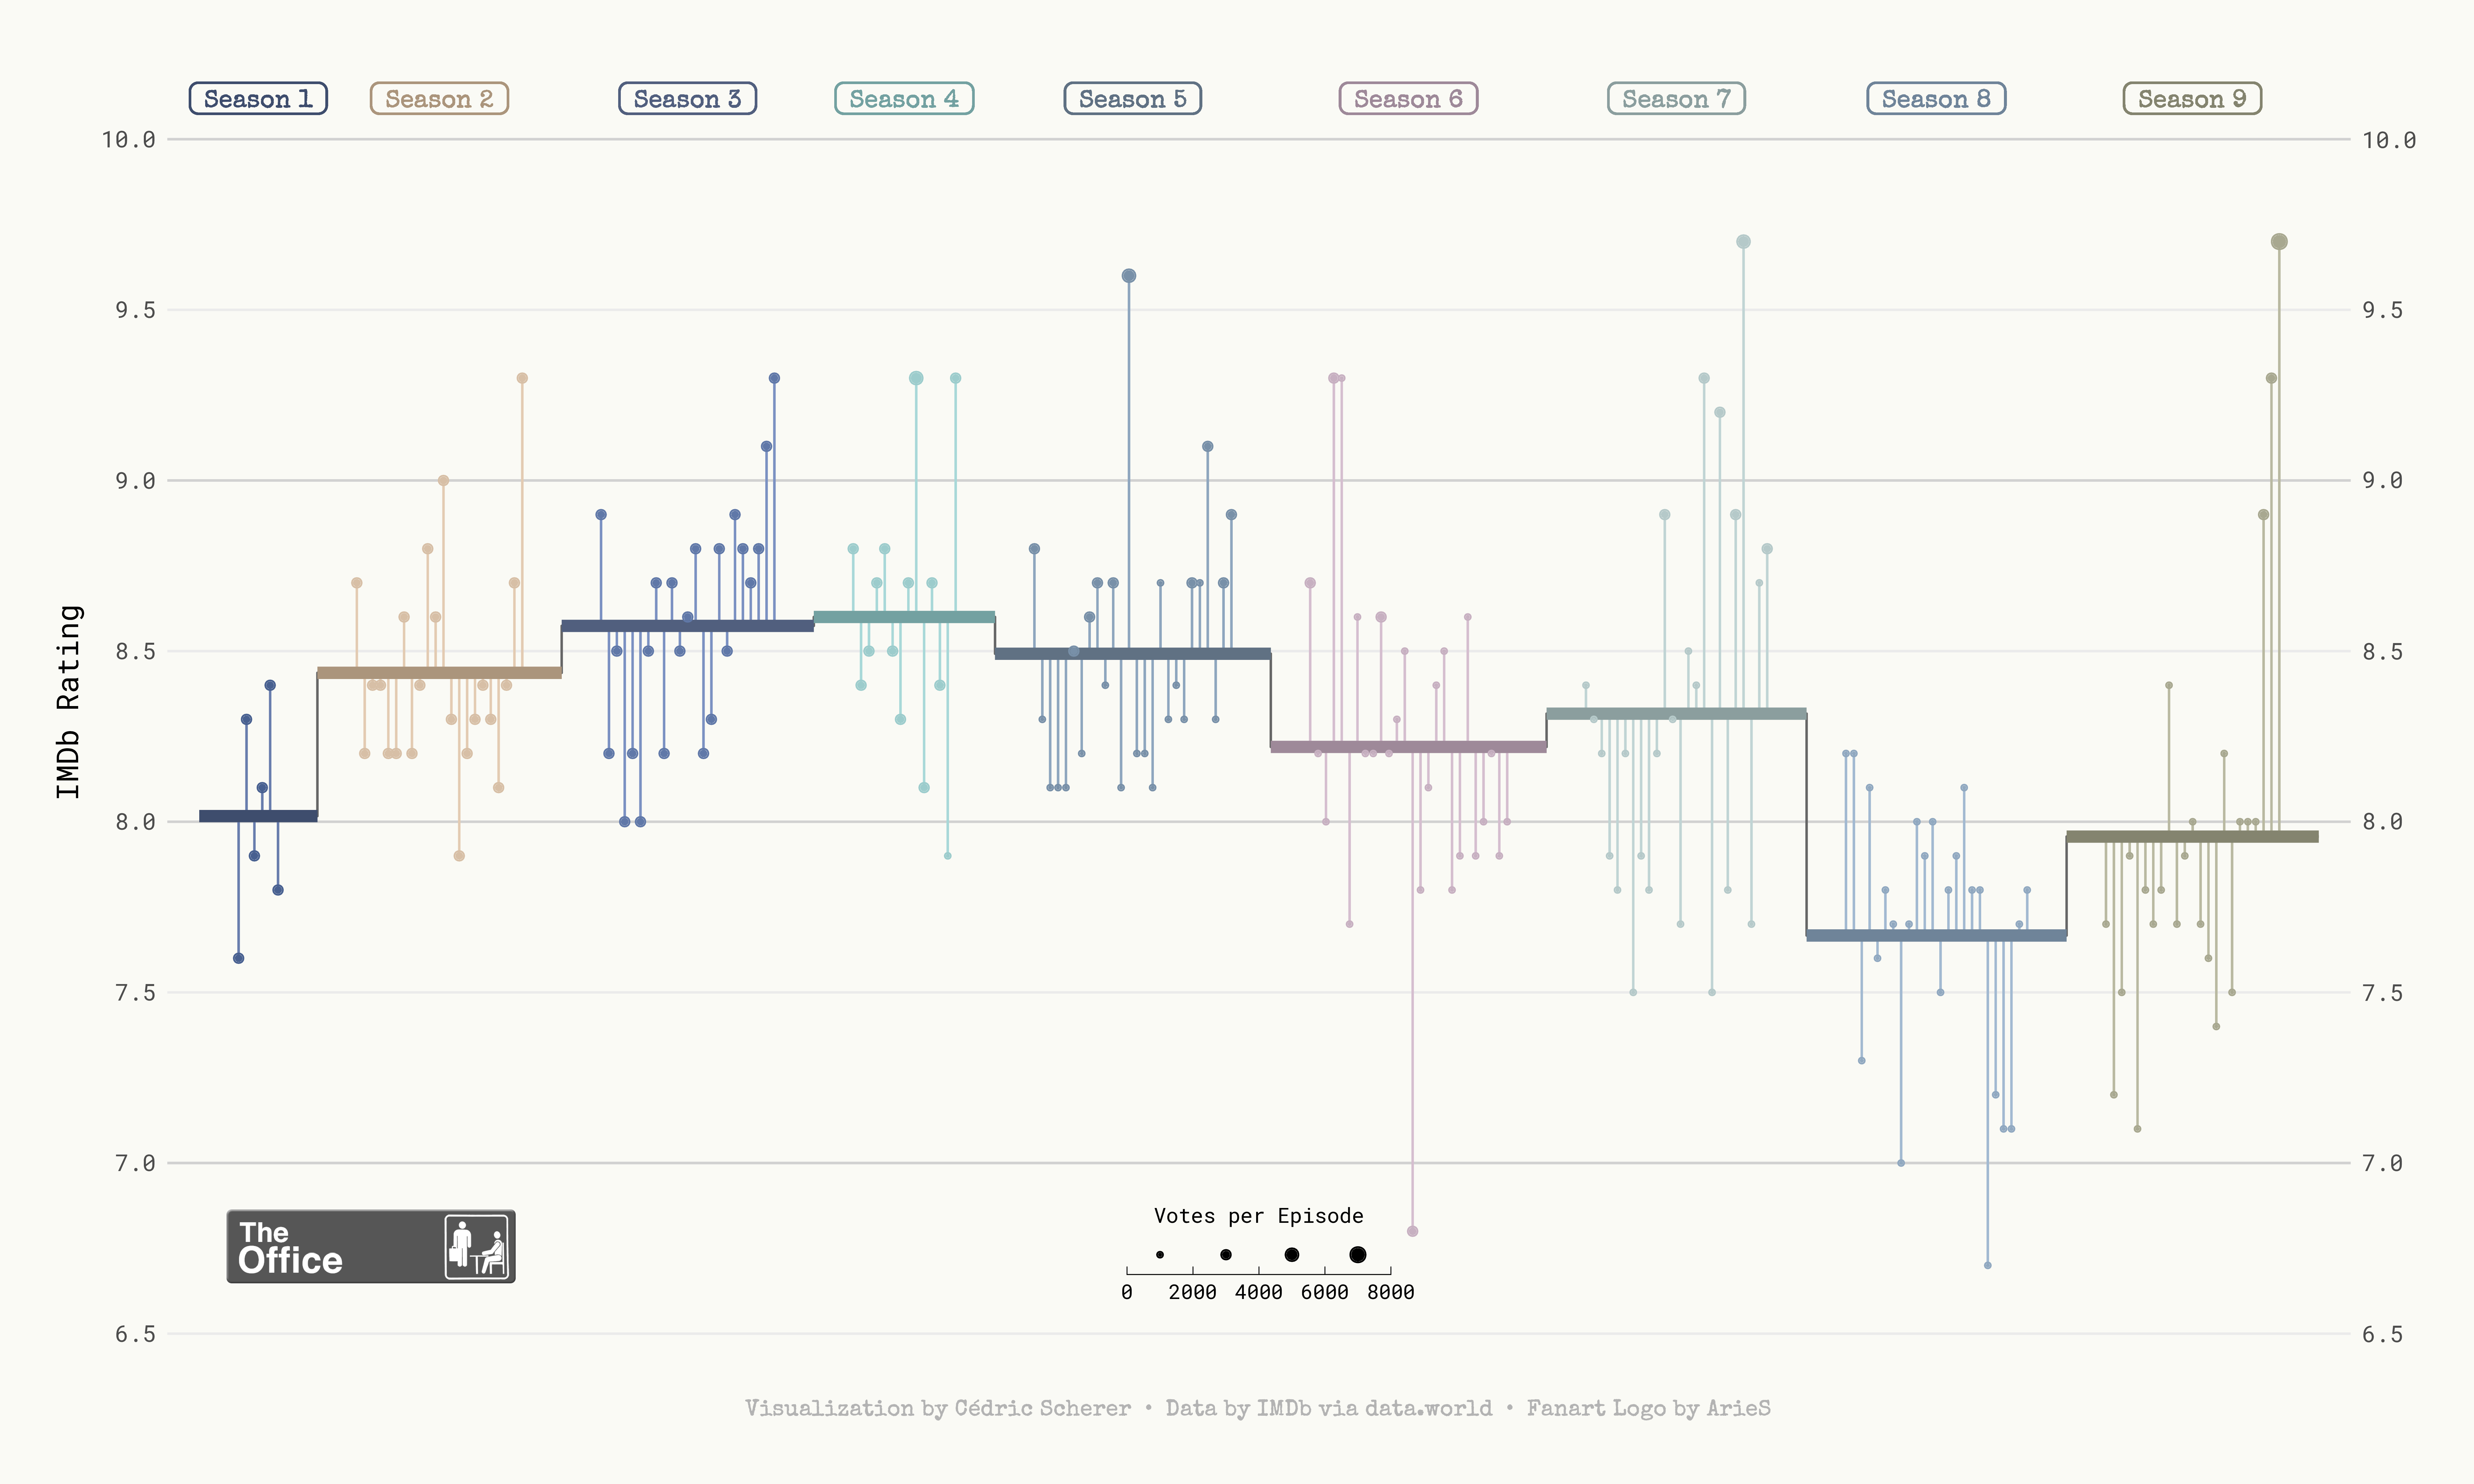
- 2020/12 🏢 The Office on IMDb
- 2020/14 🍺 Beer Production
- 2020/15 🚵 Tour de France History
- 2020/16 🎙️ Best Hip-Hop Songs of All Time
- 2020/18 🎭️ Broadway Musicals (RTFM Edition)
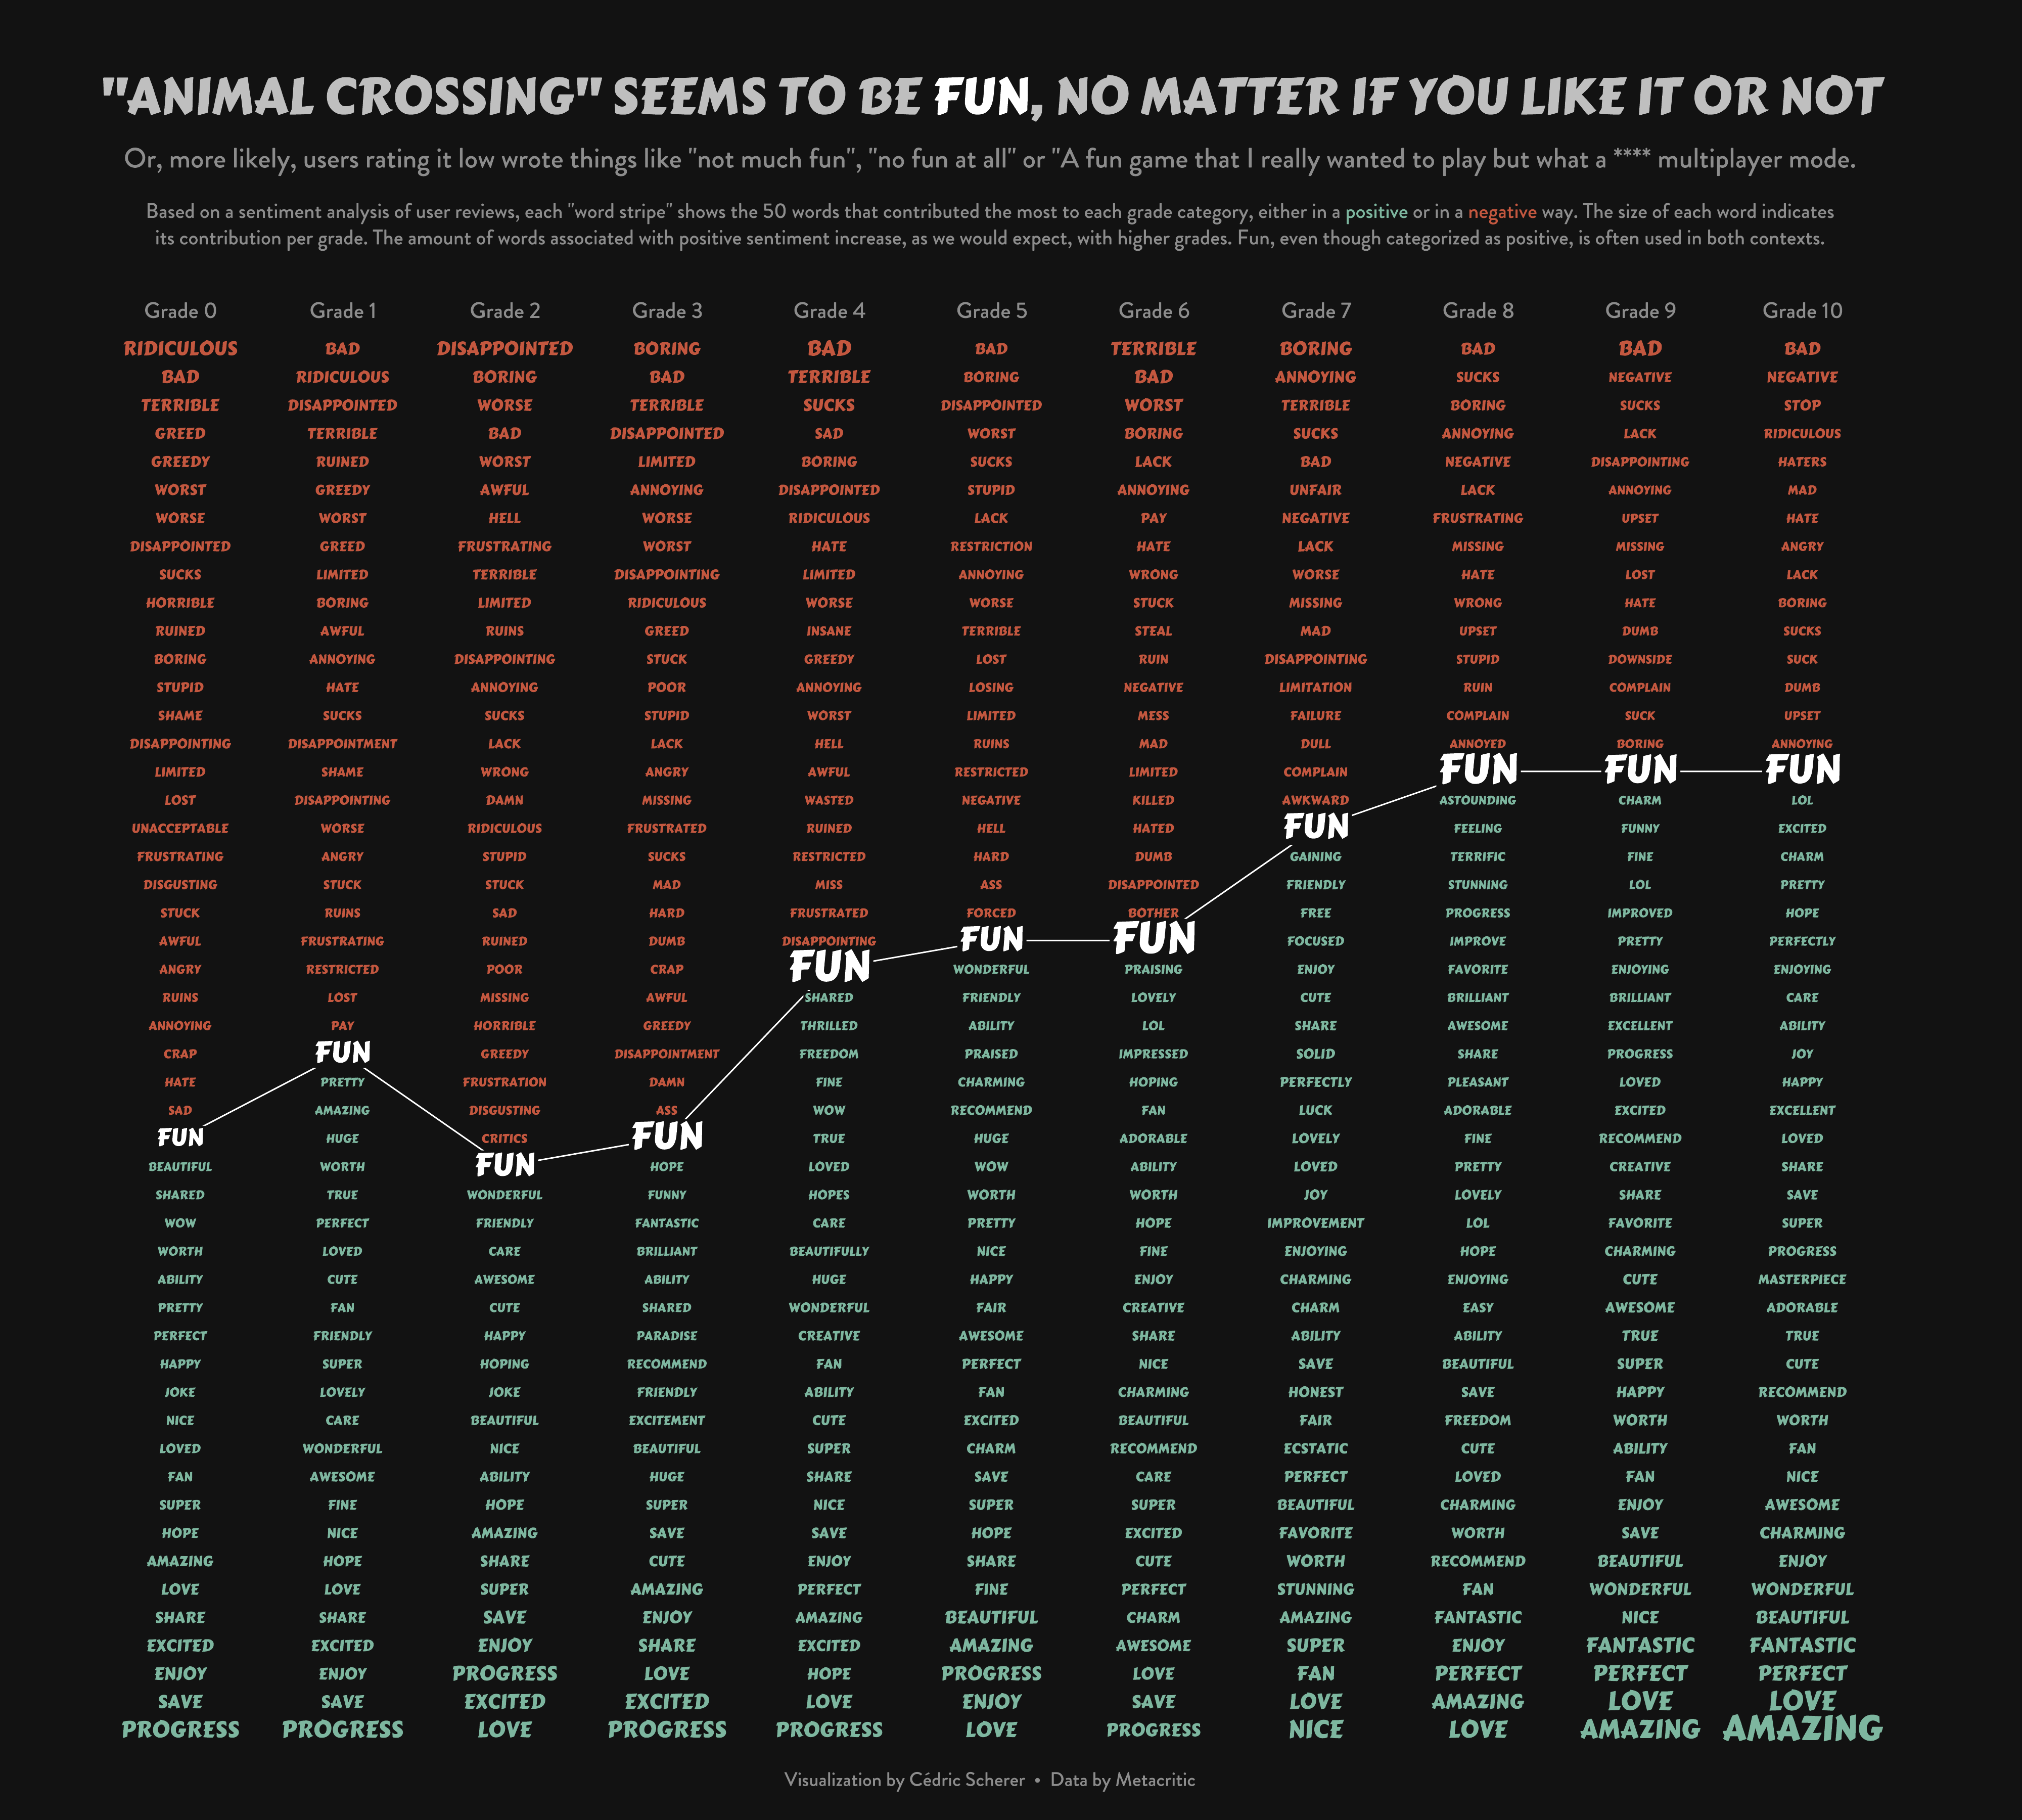
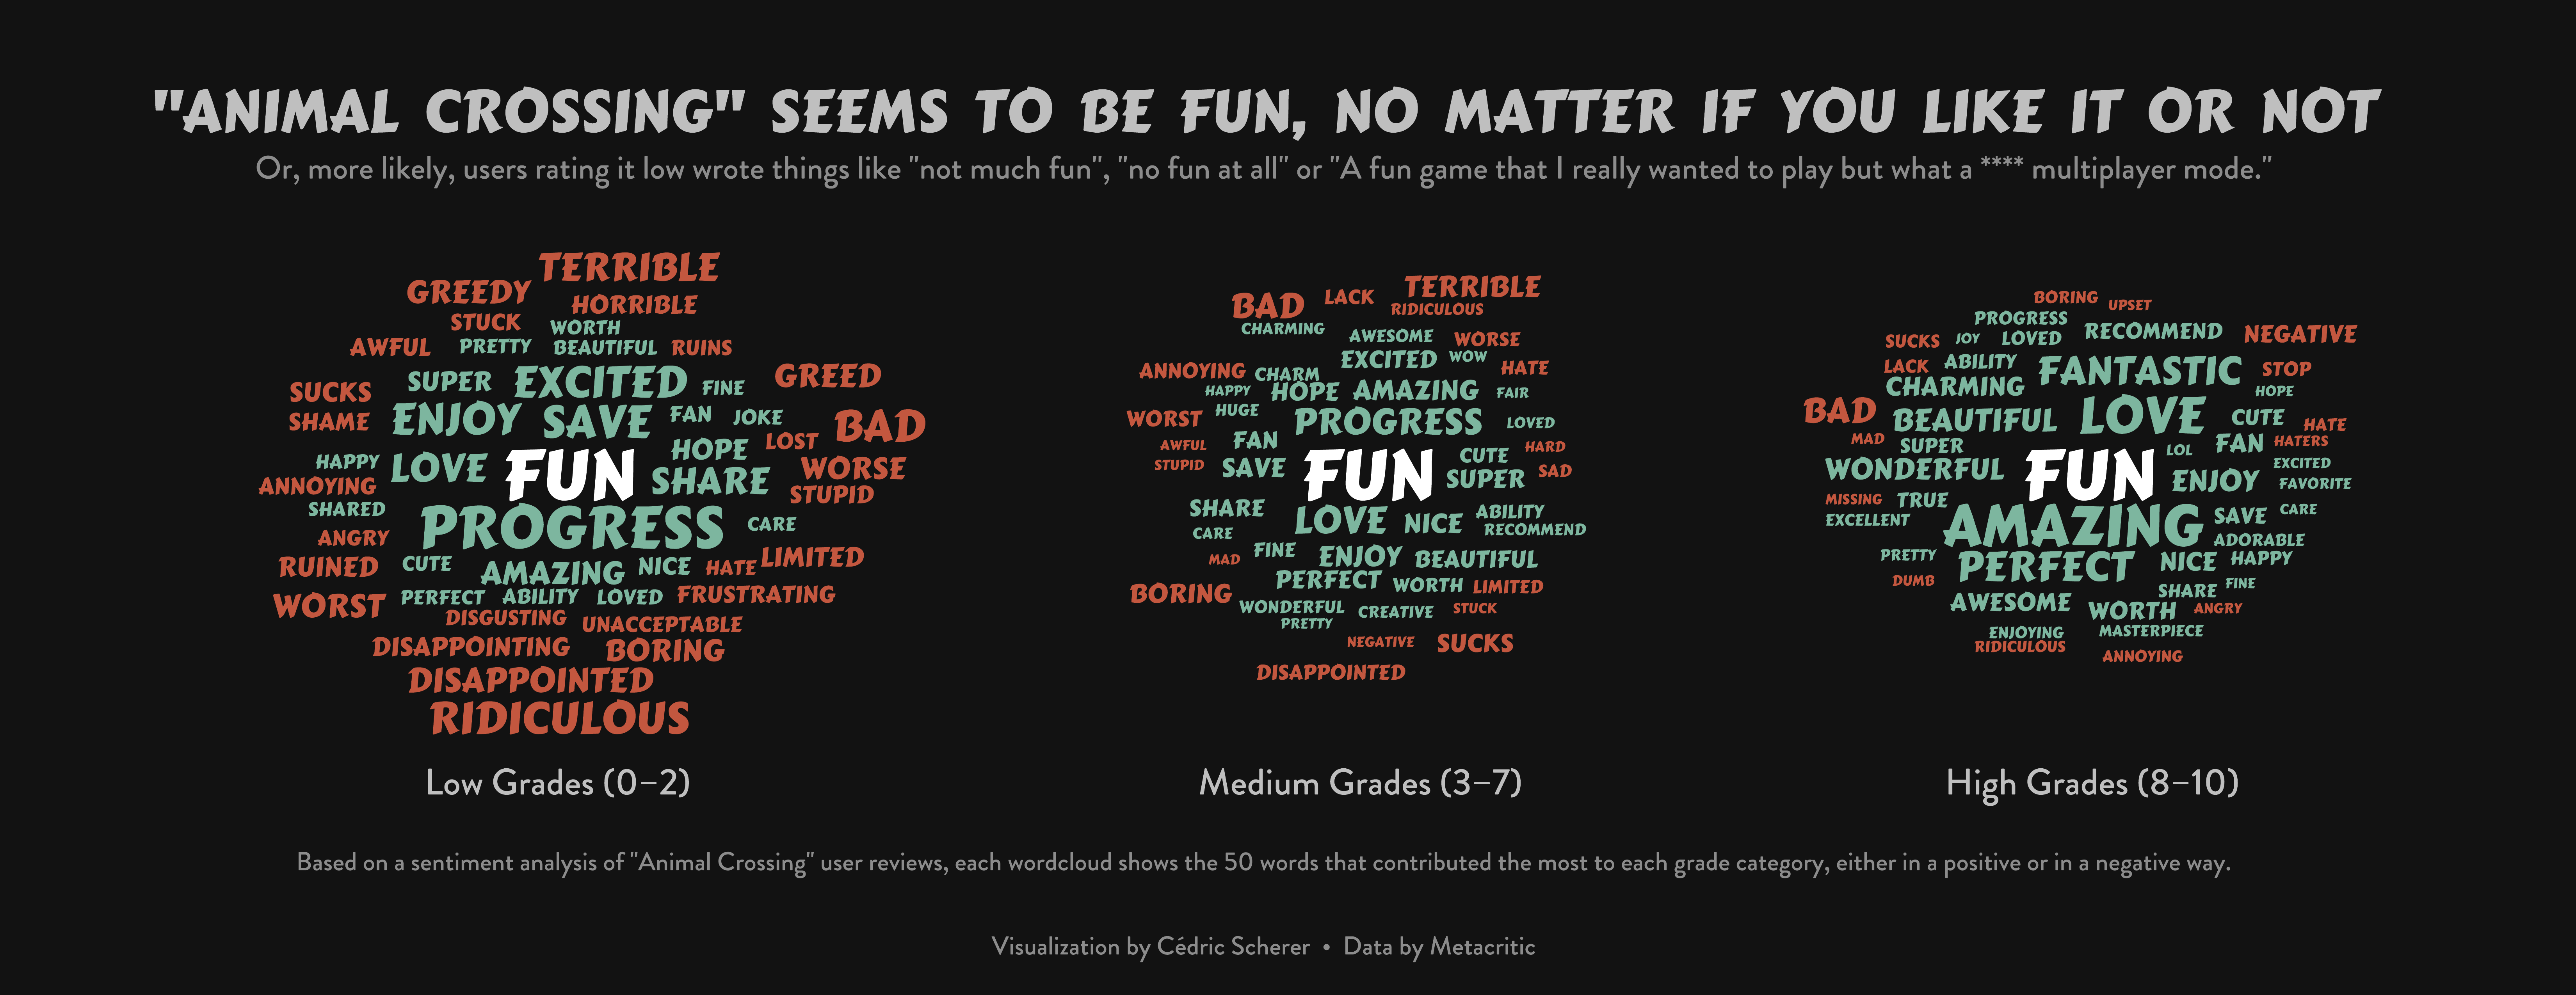
- 2020/19 🐻 Animal Crossing
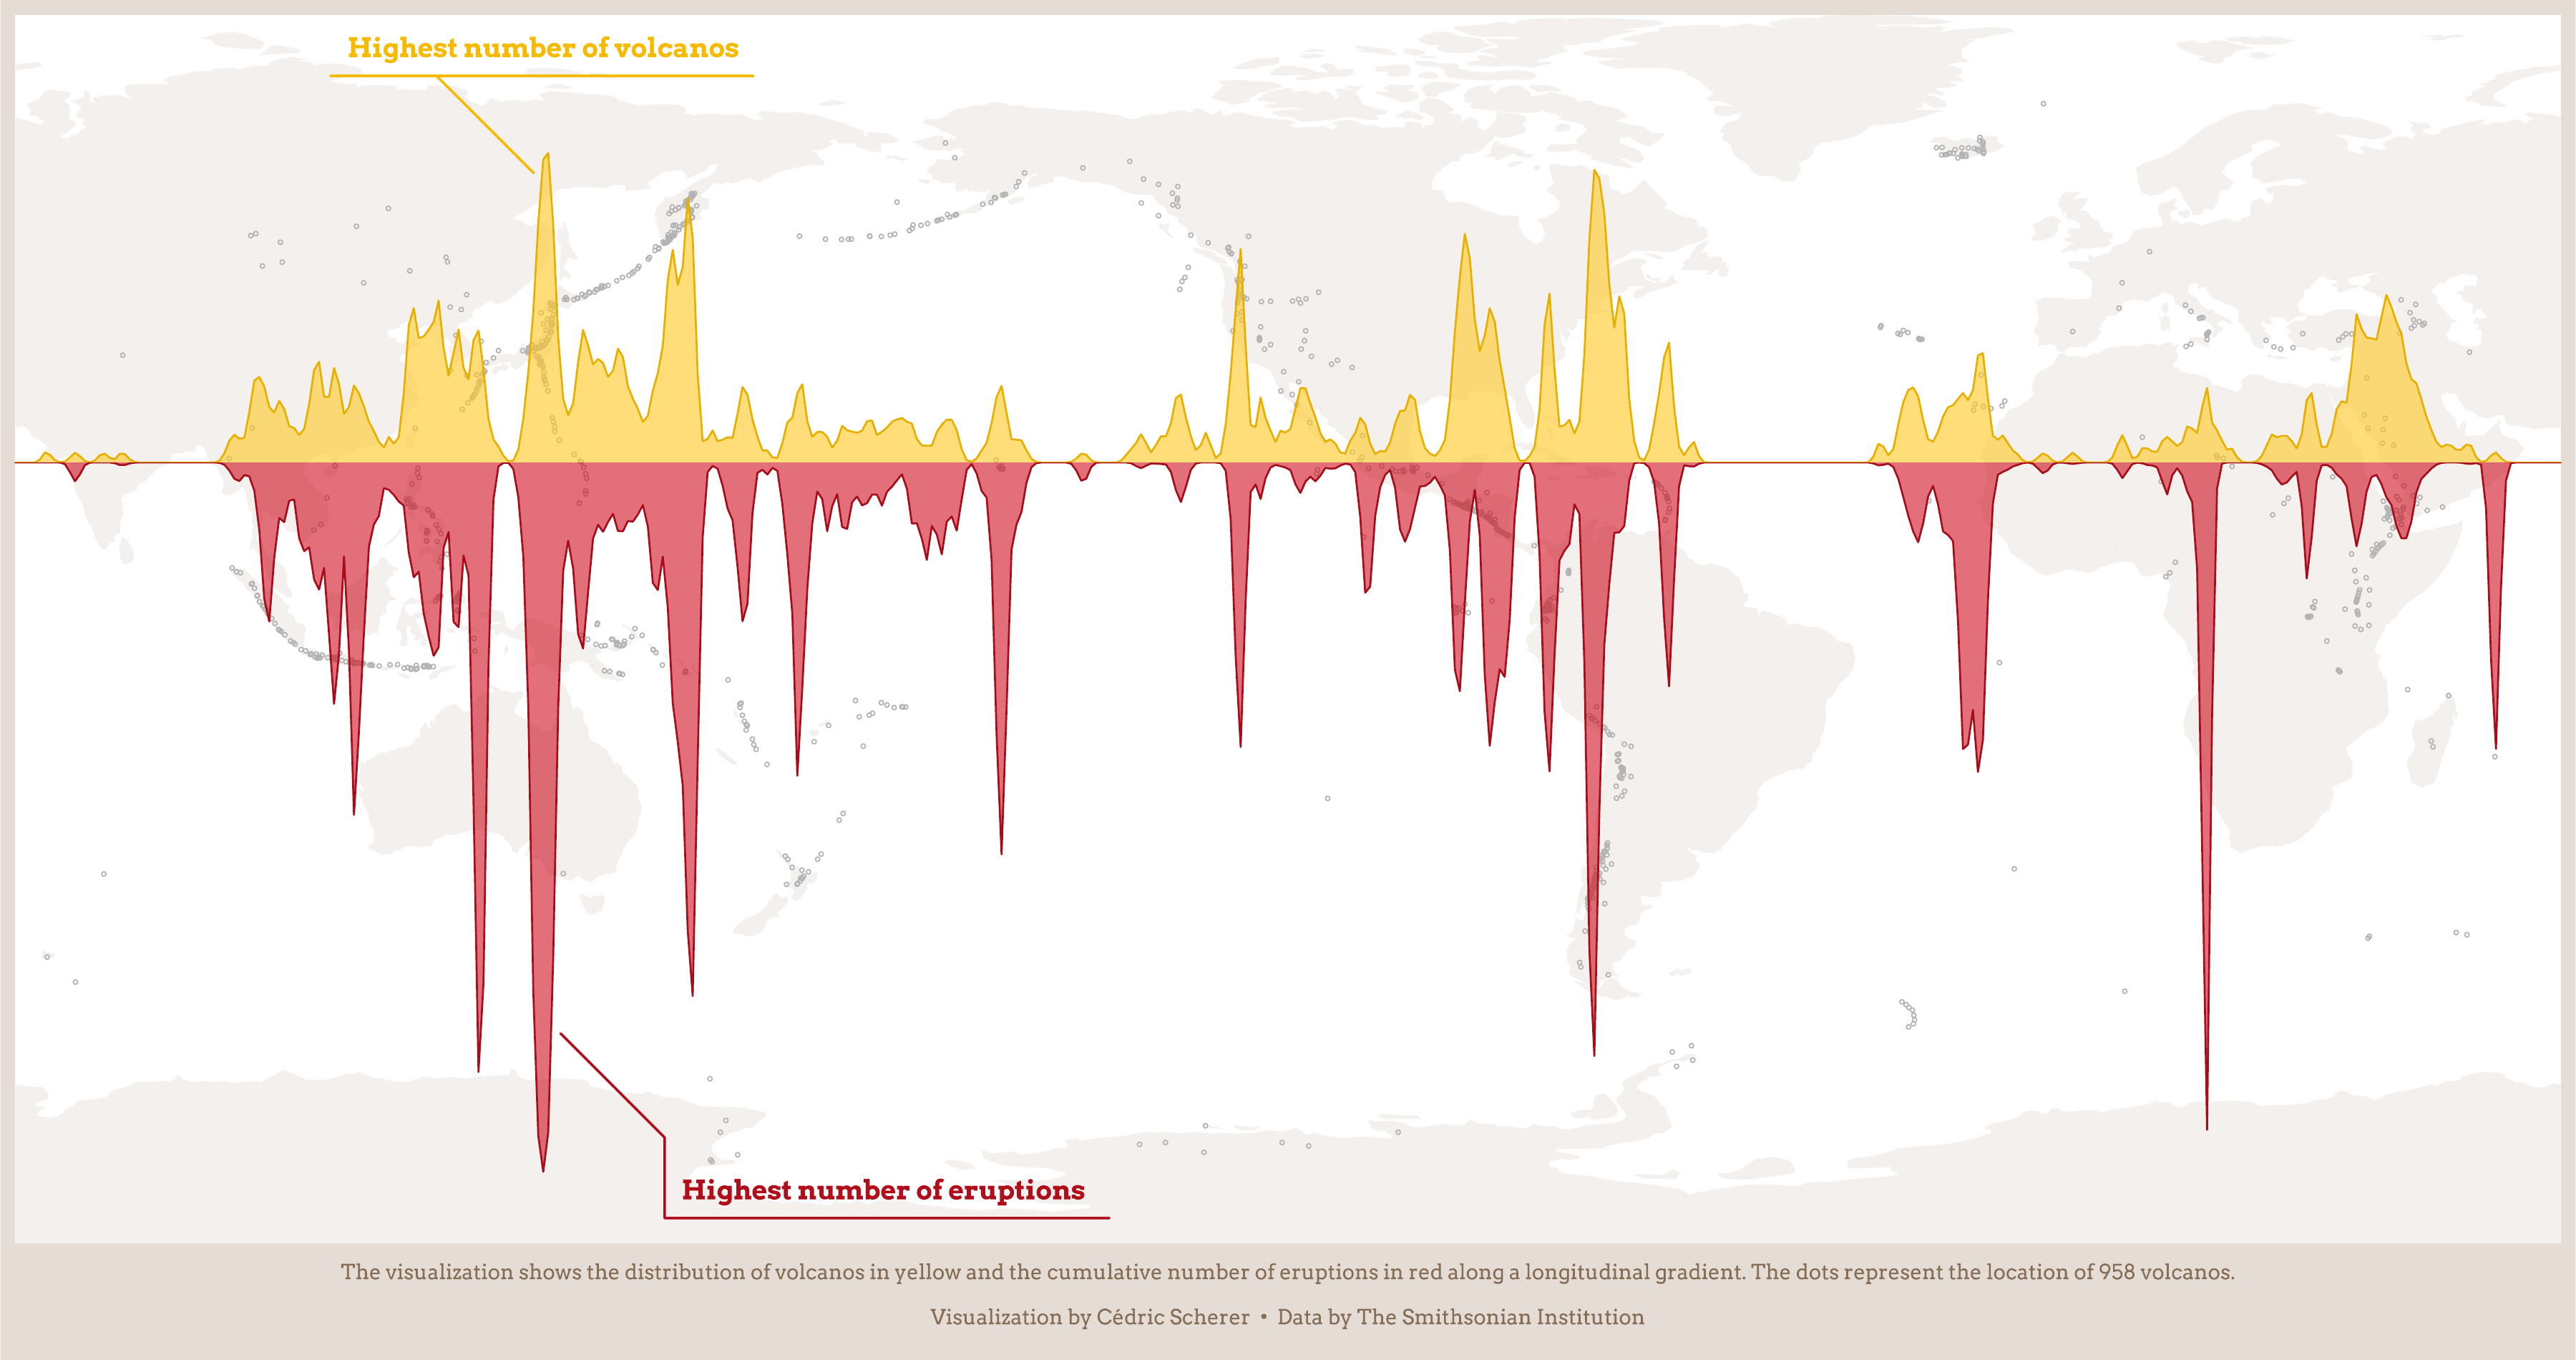
- 2020/20 🌋 Volcano Eruptions
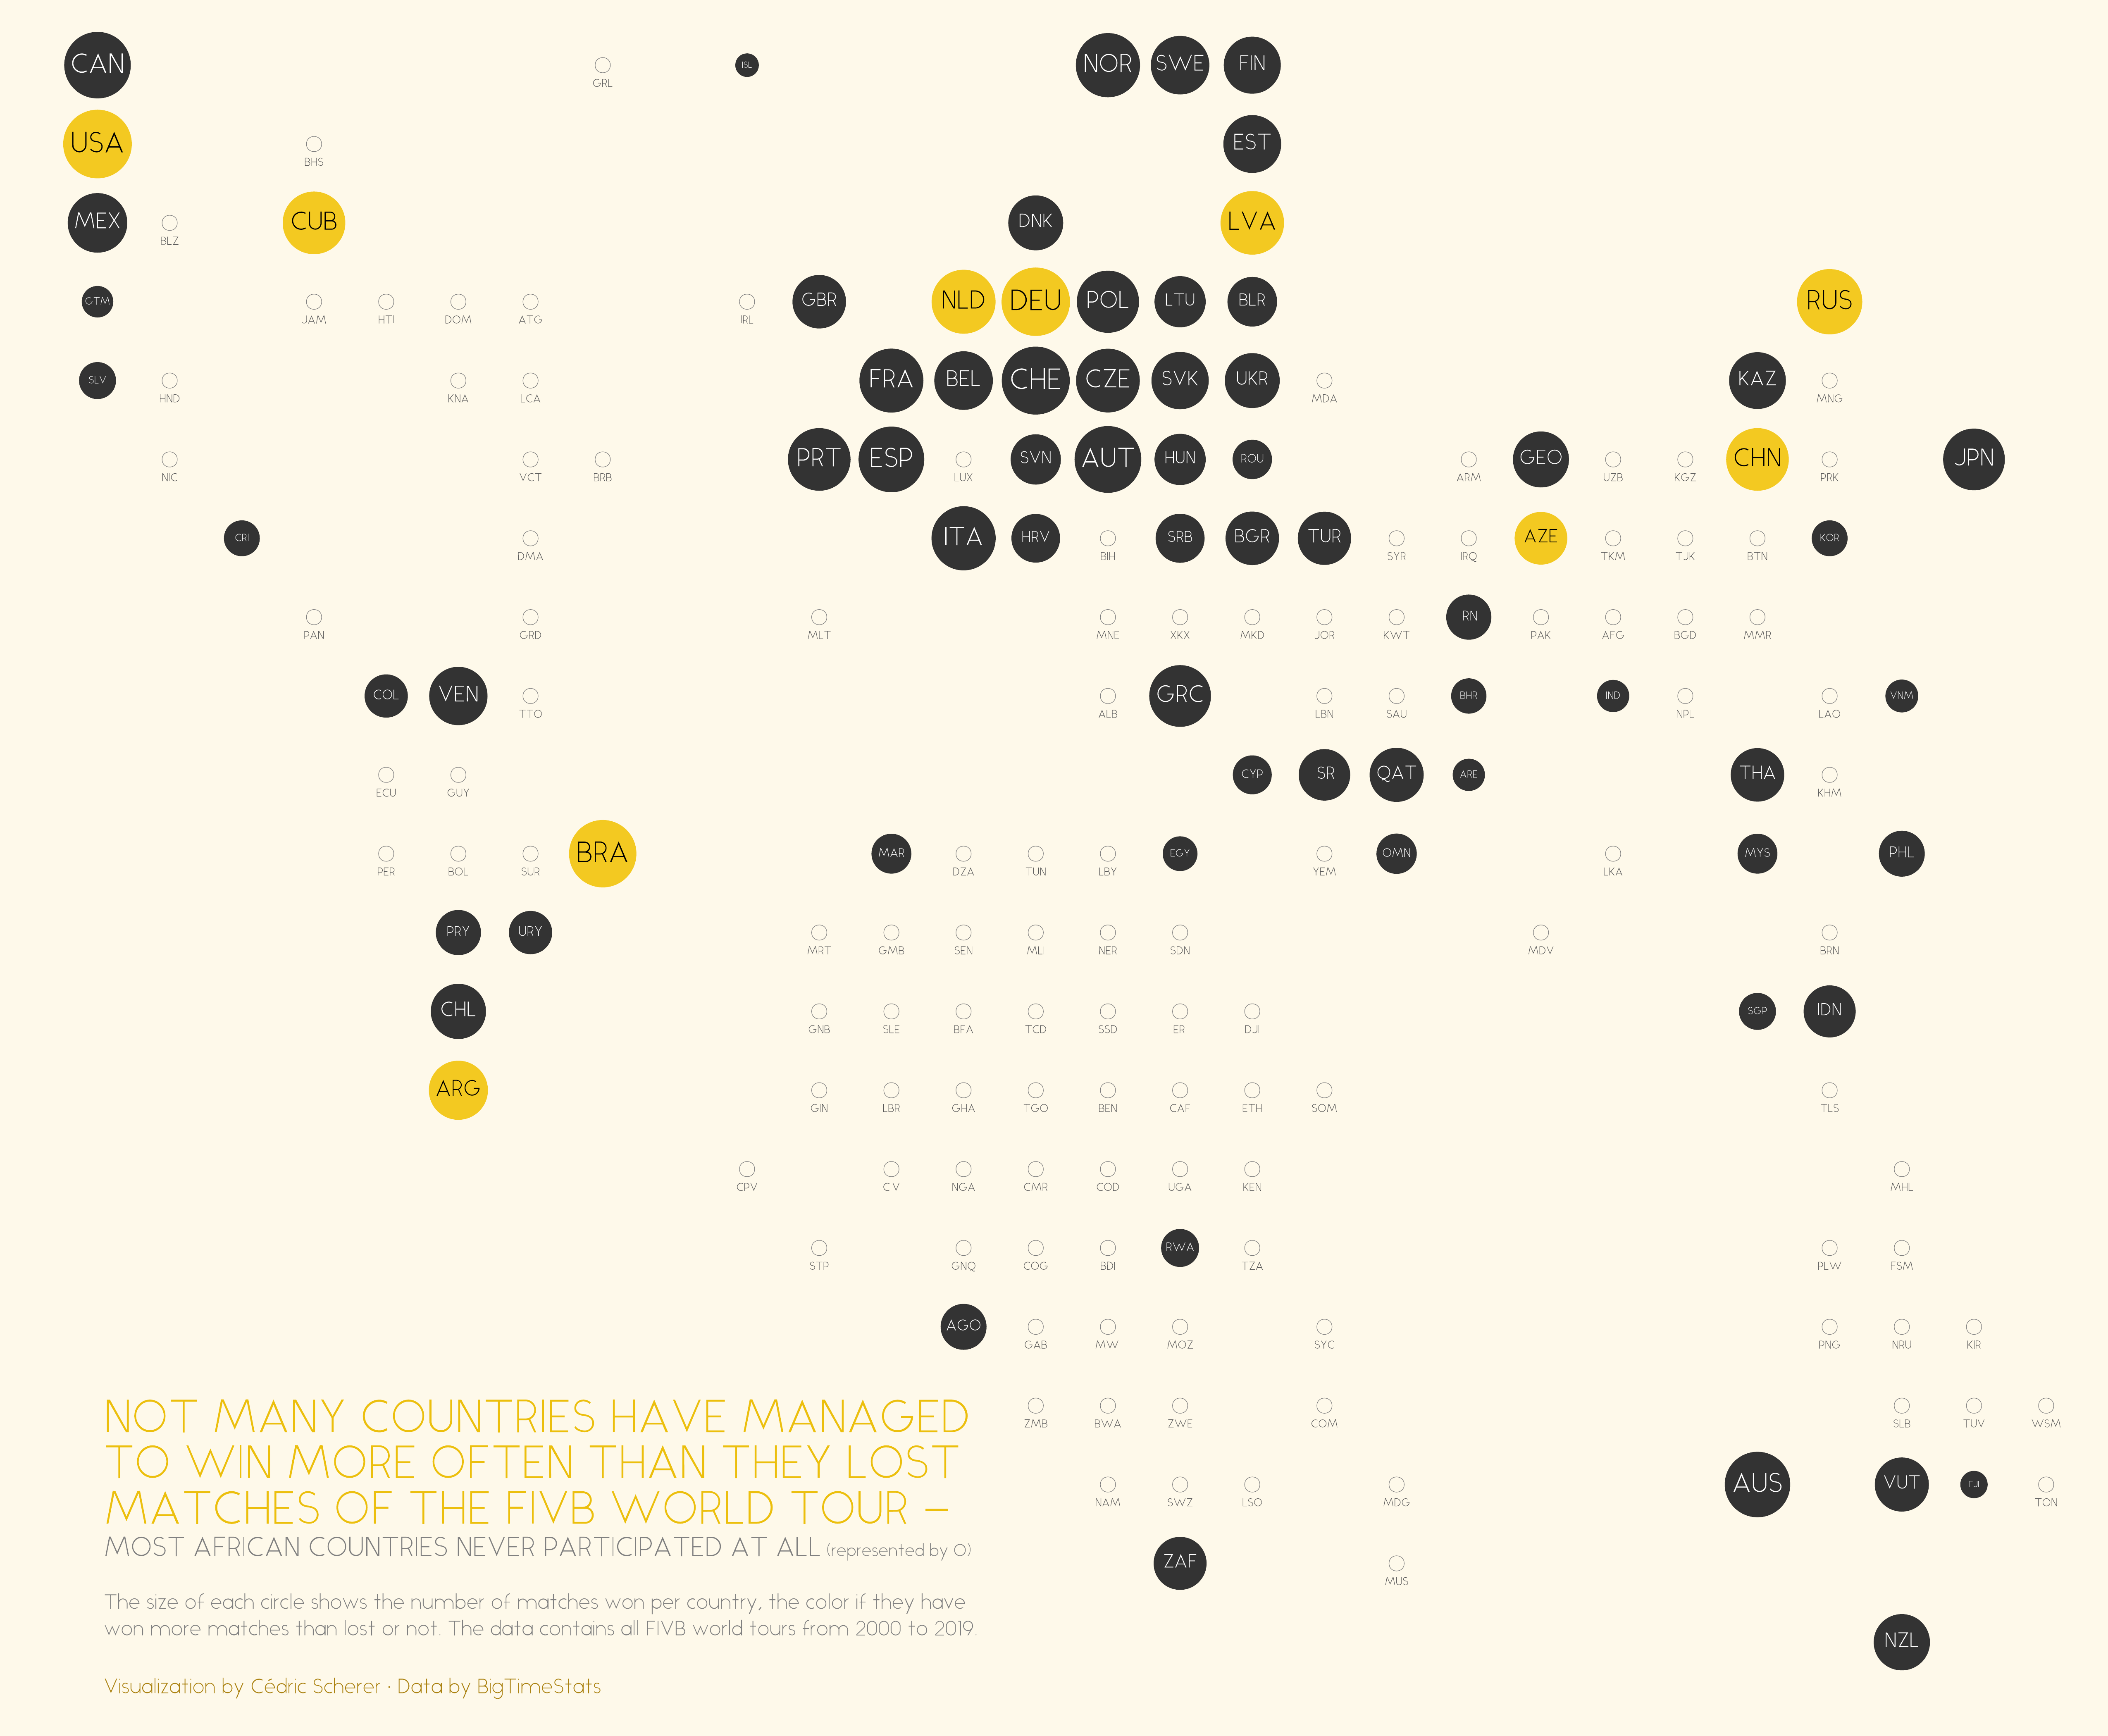
- 2020/21 🏐 Beach Volleyball
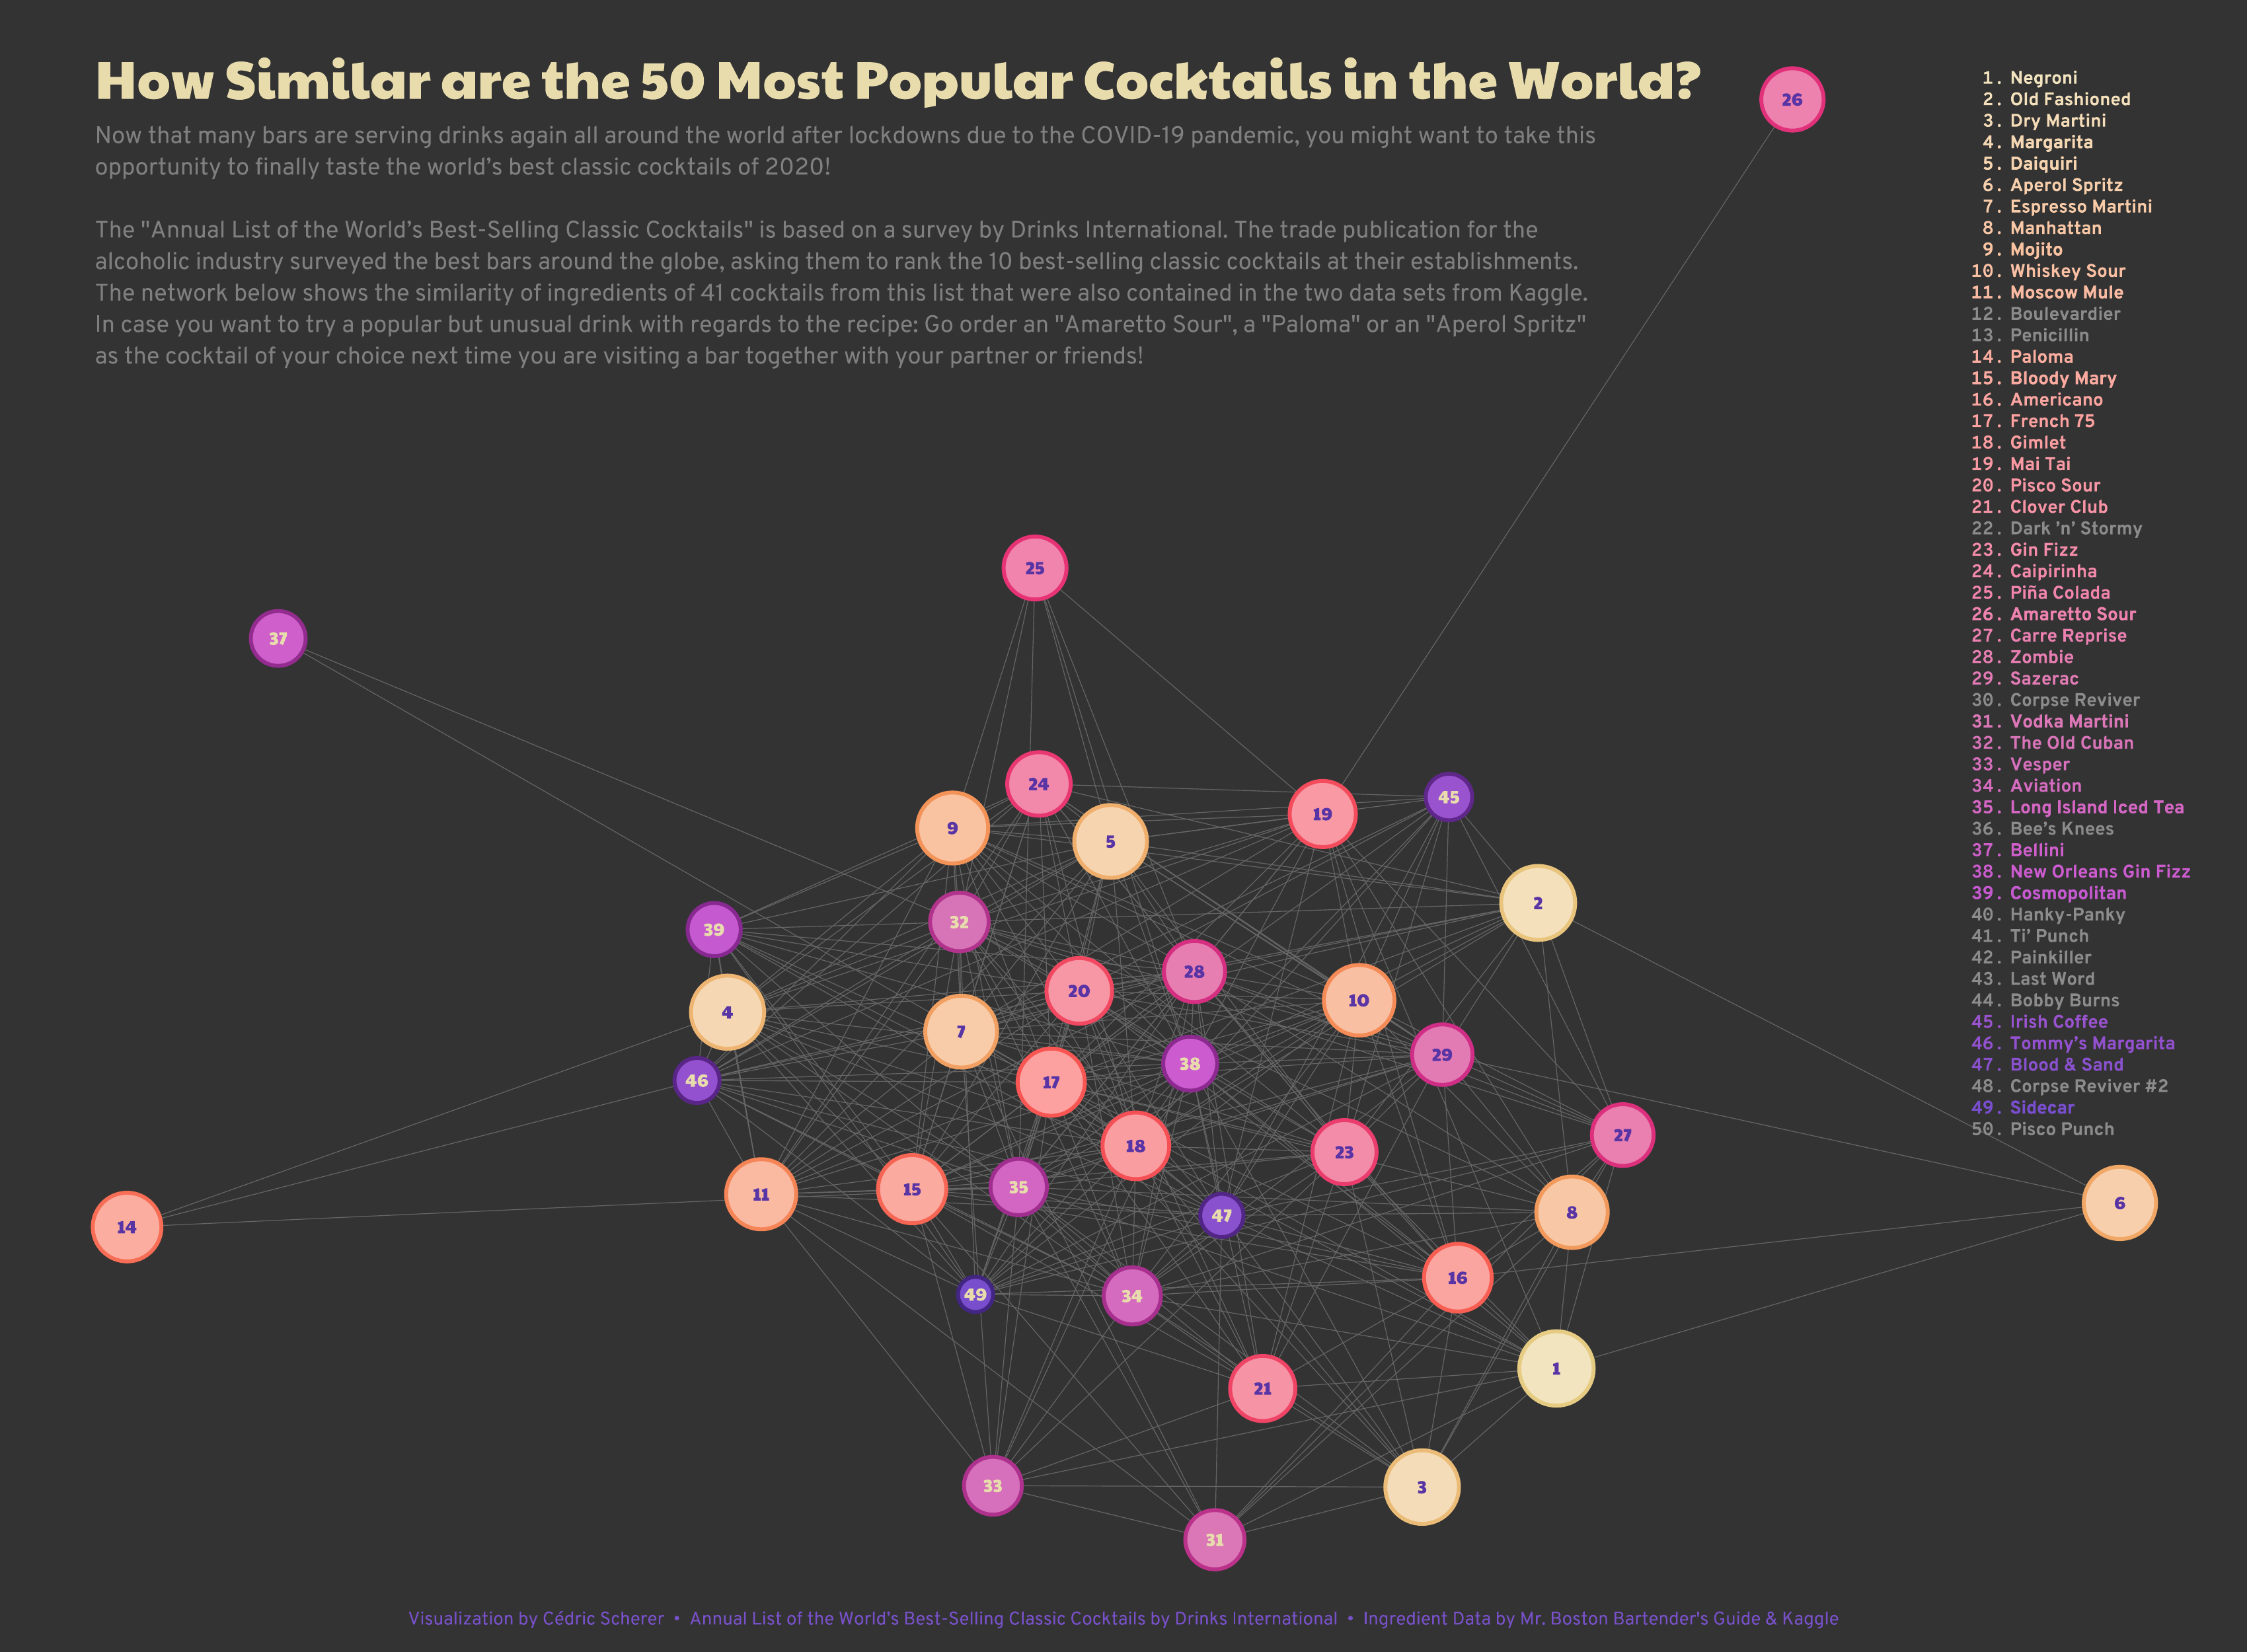
- 2020/22 🍹 50 Most Popular Cocktails 2020
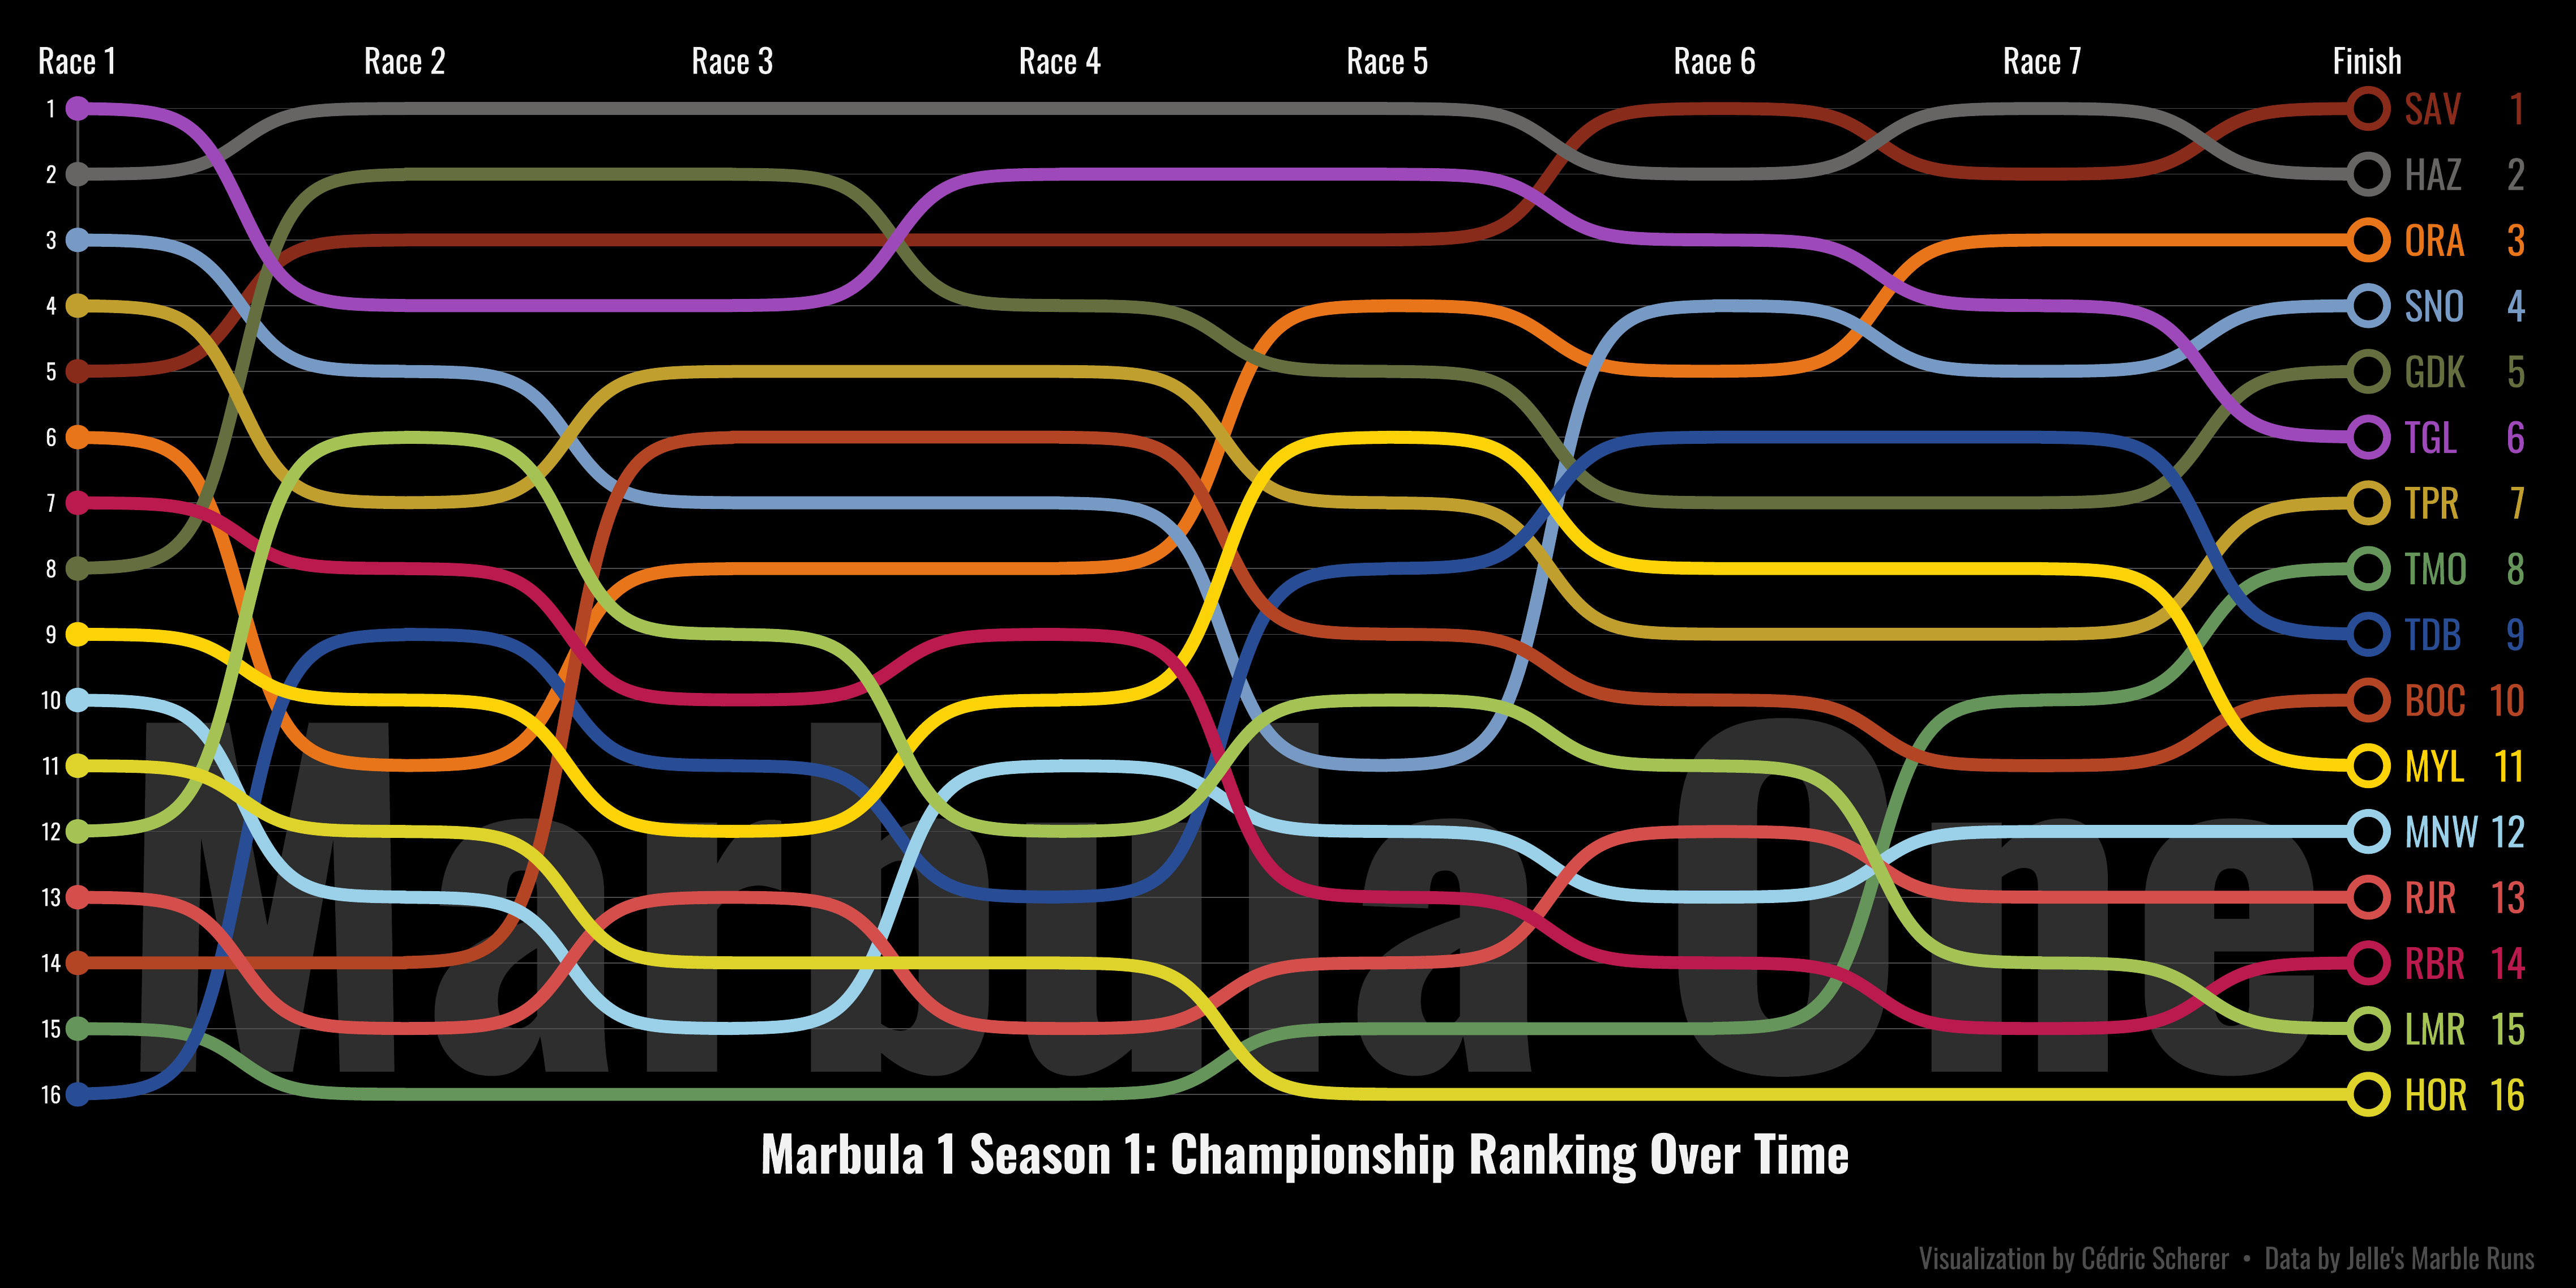
- 2020/23 🔴 Marble Races
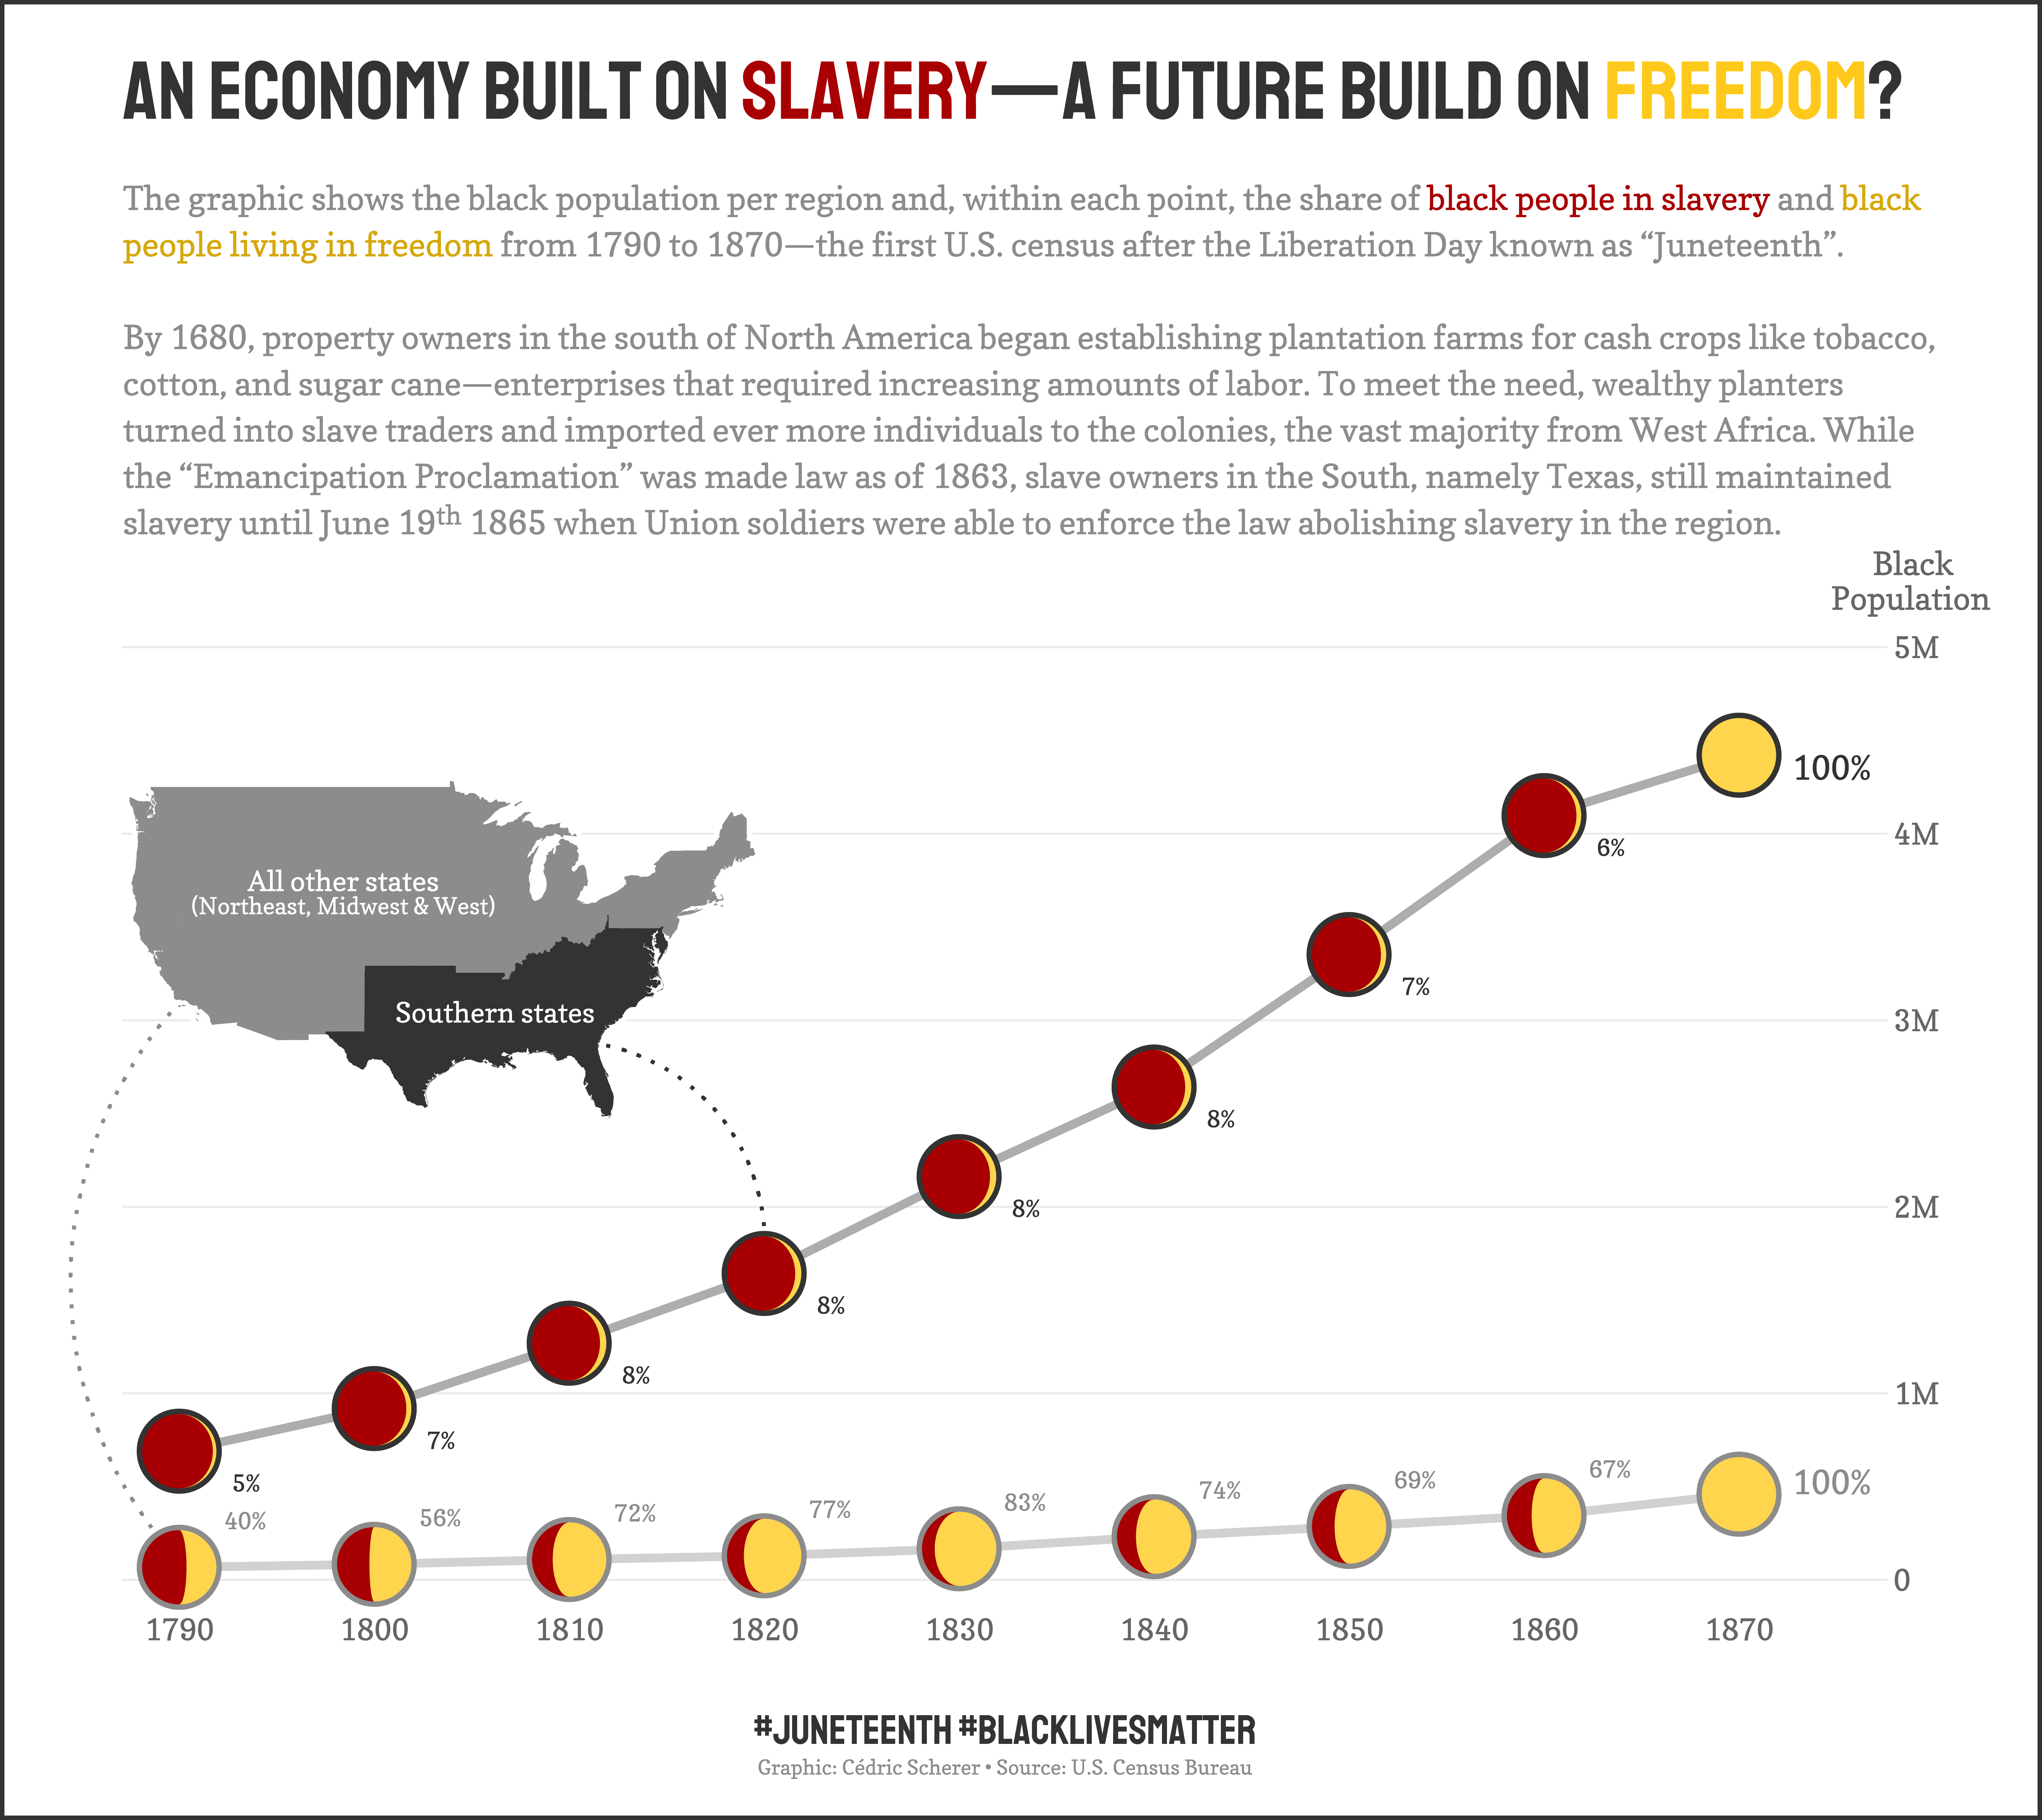
- 2020/25 🕊️ American Slavery and Juneteenth
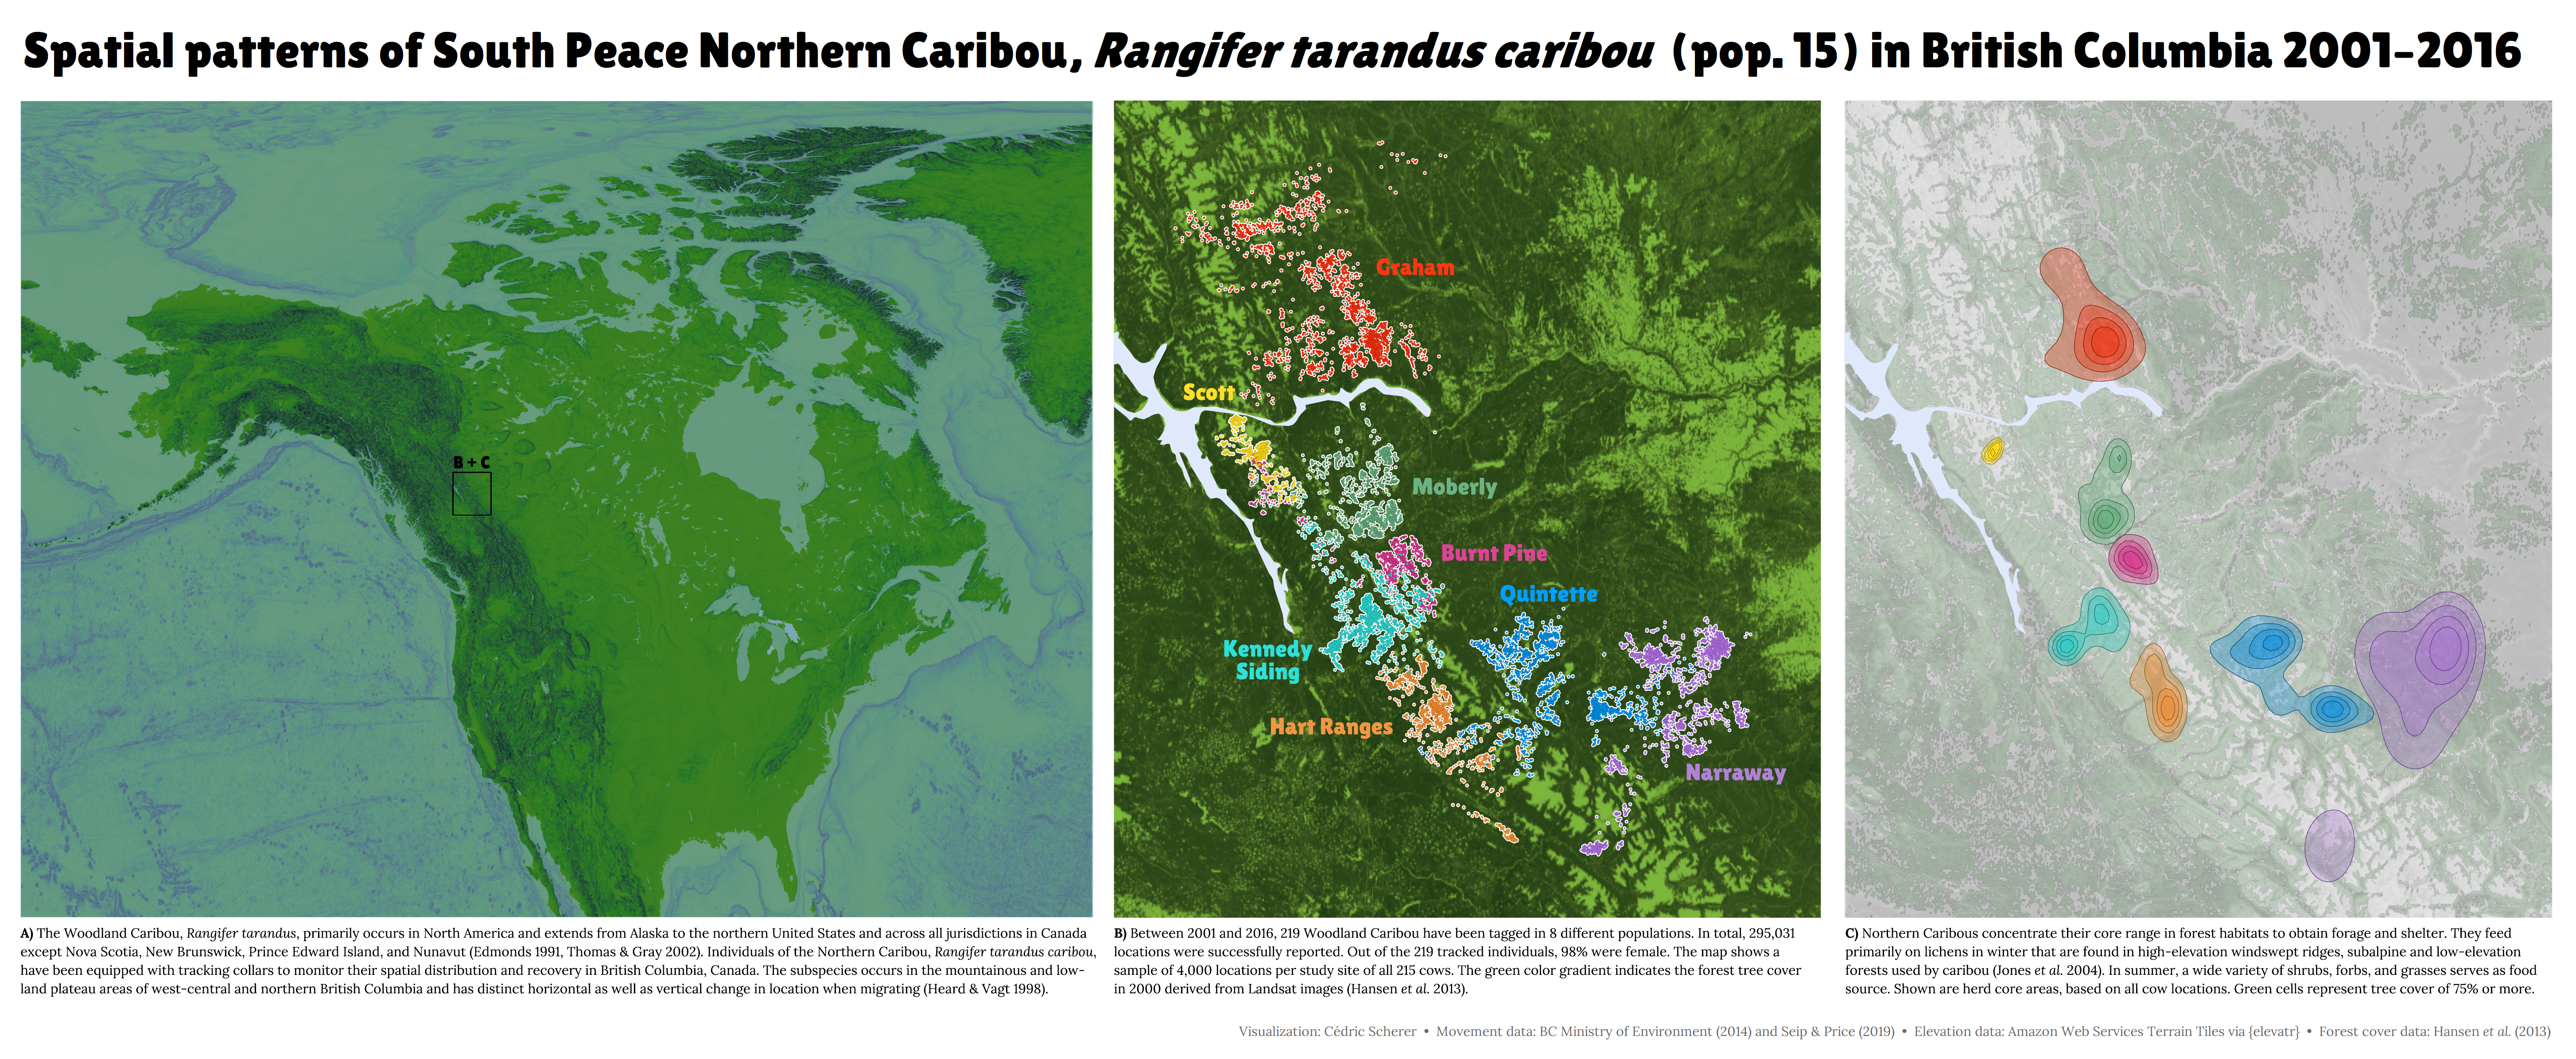
- 2020/26 🦌️ Northern Caribou Movement
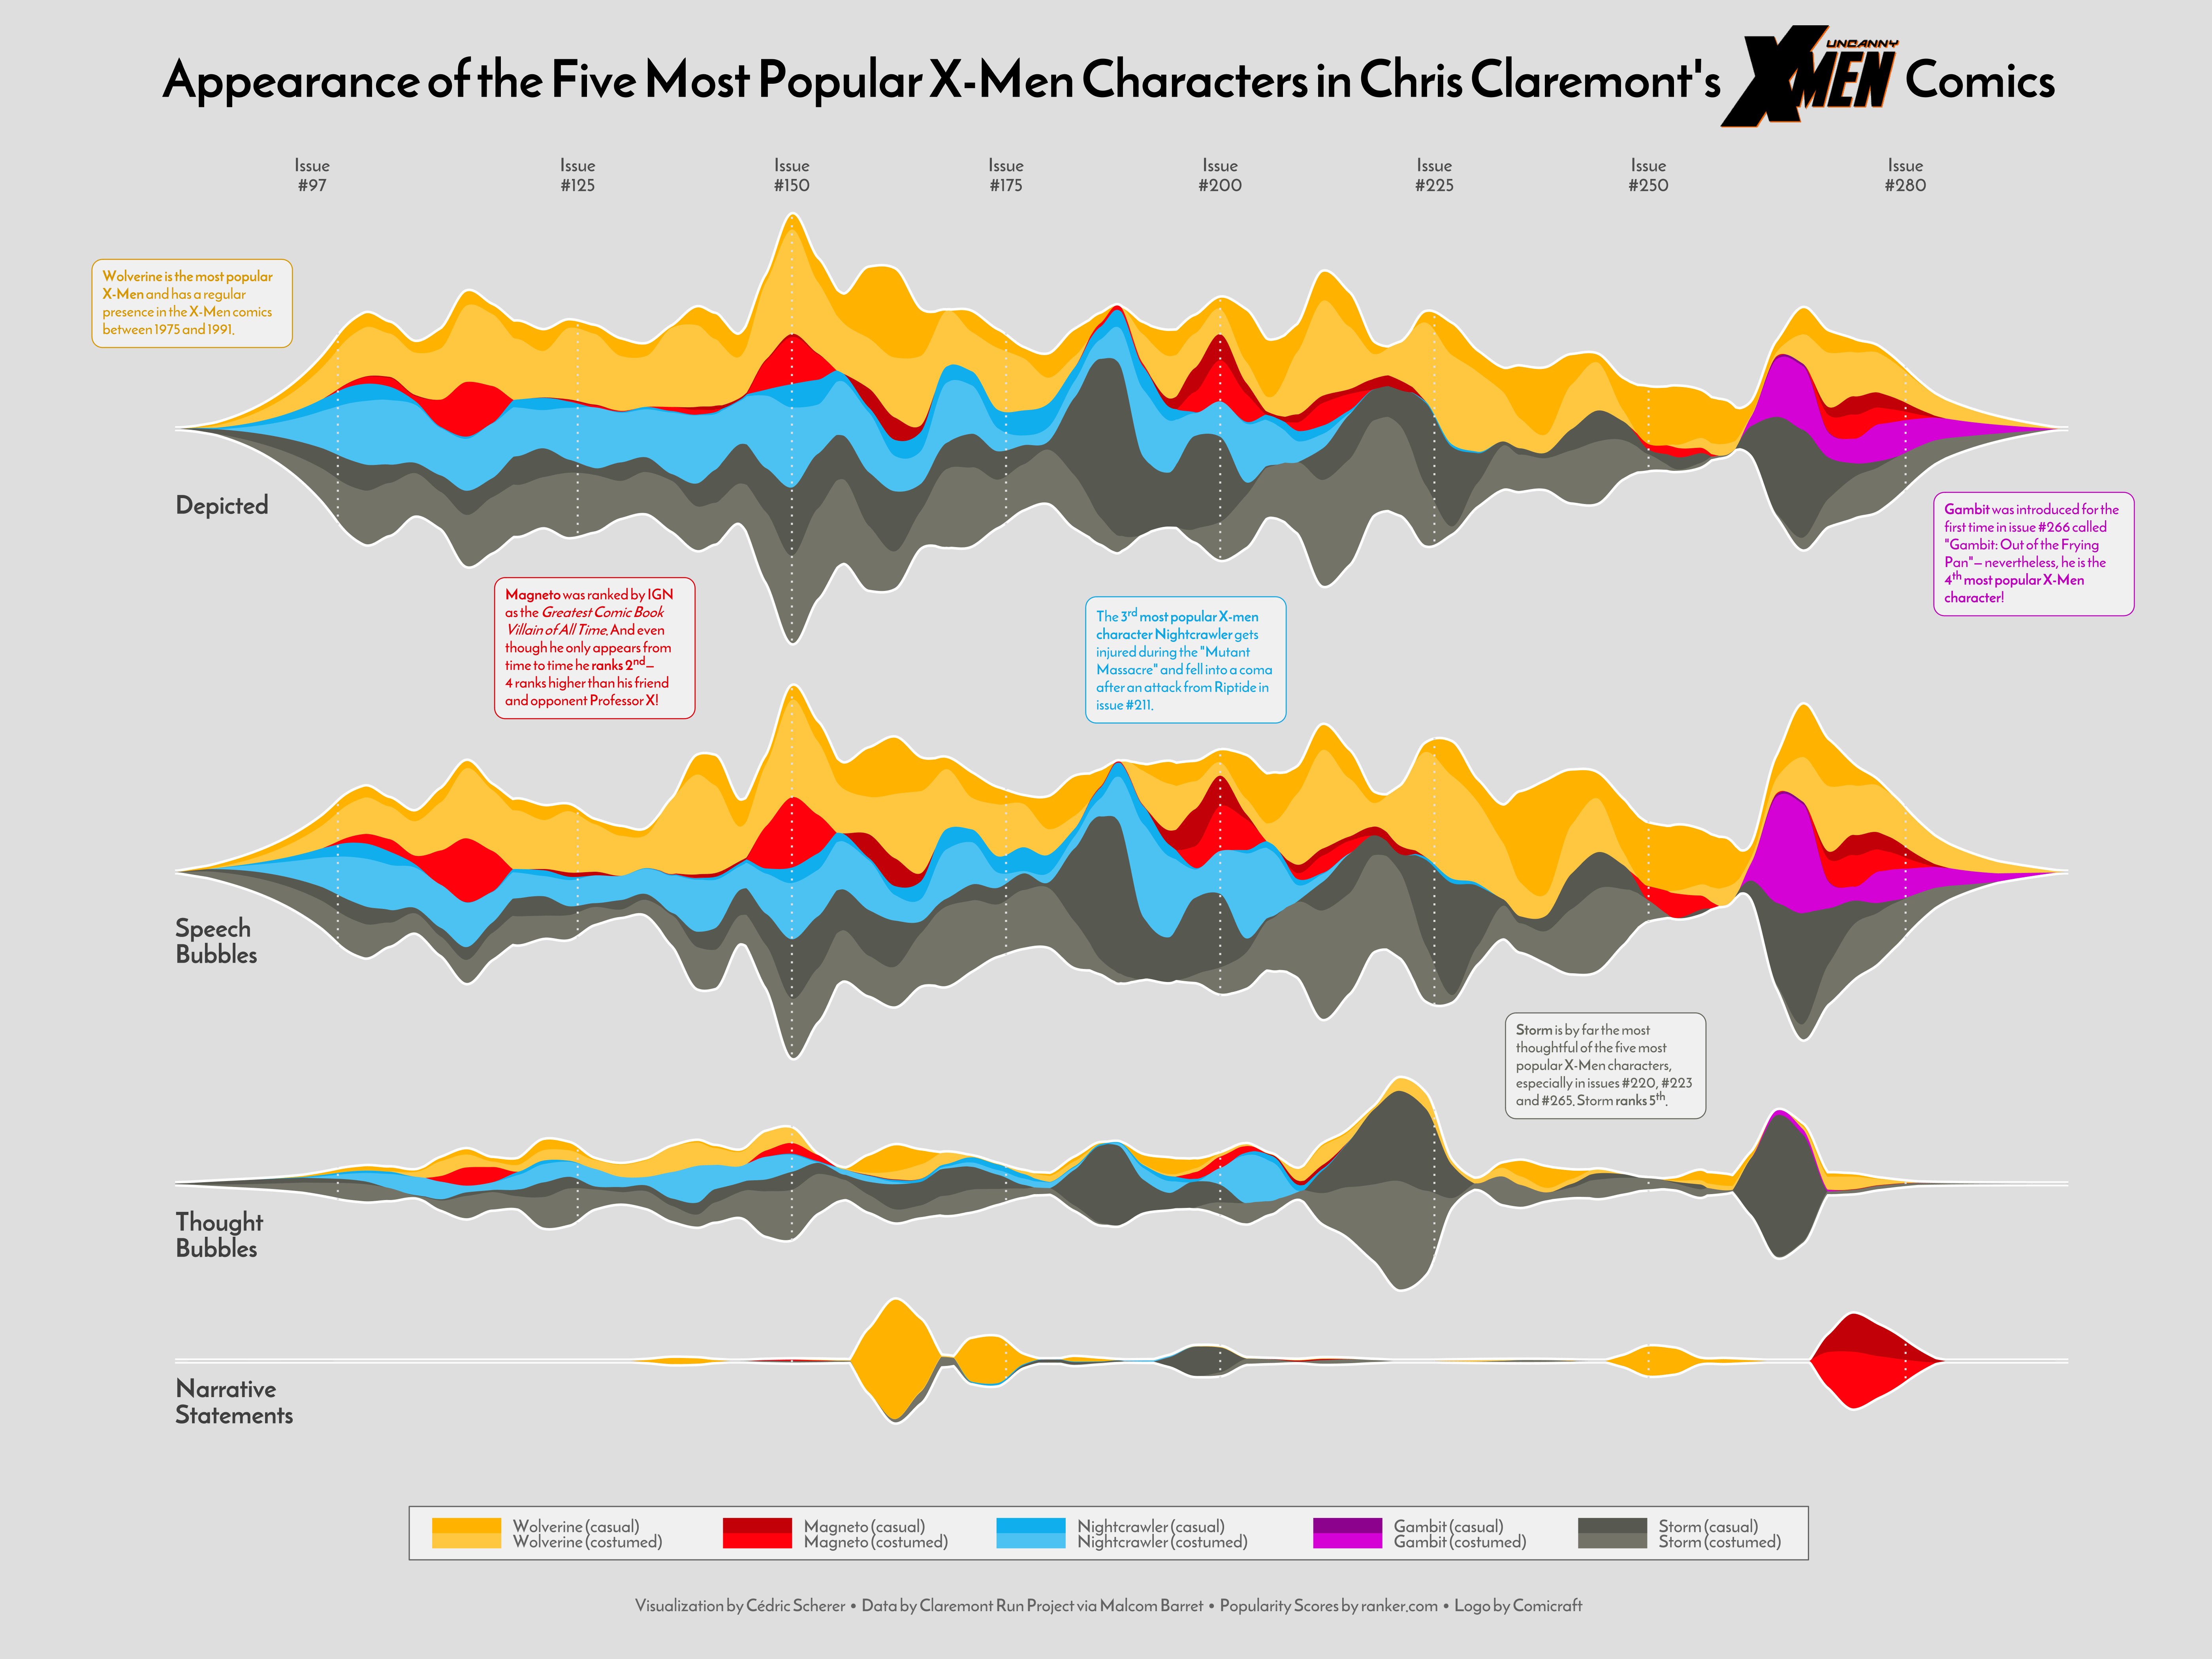
- 2020/27 🦸 Uncanny X-Men
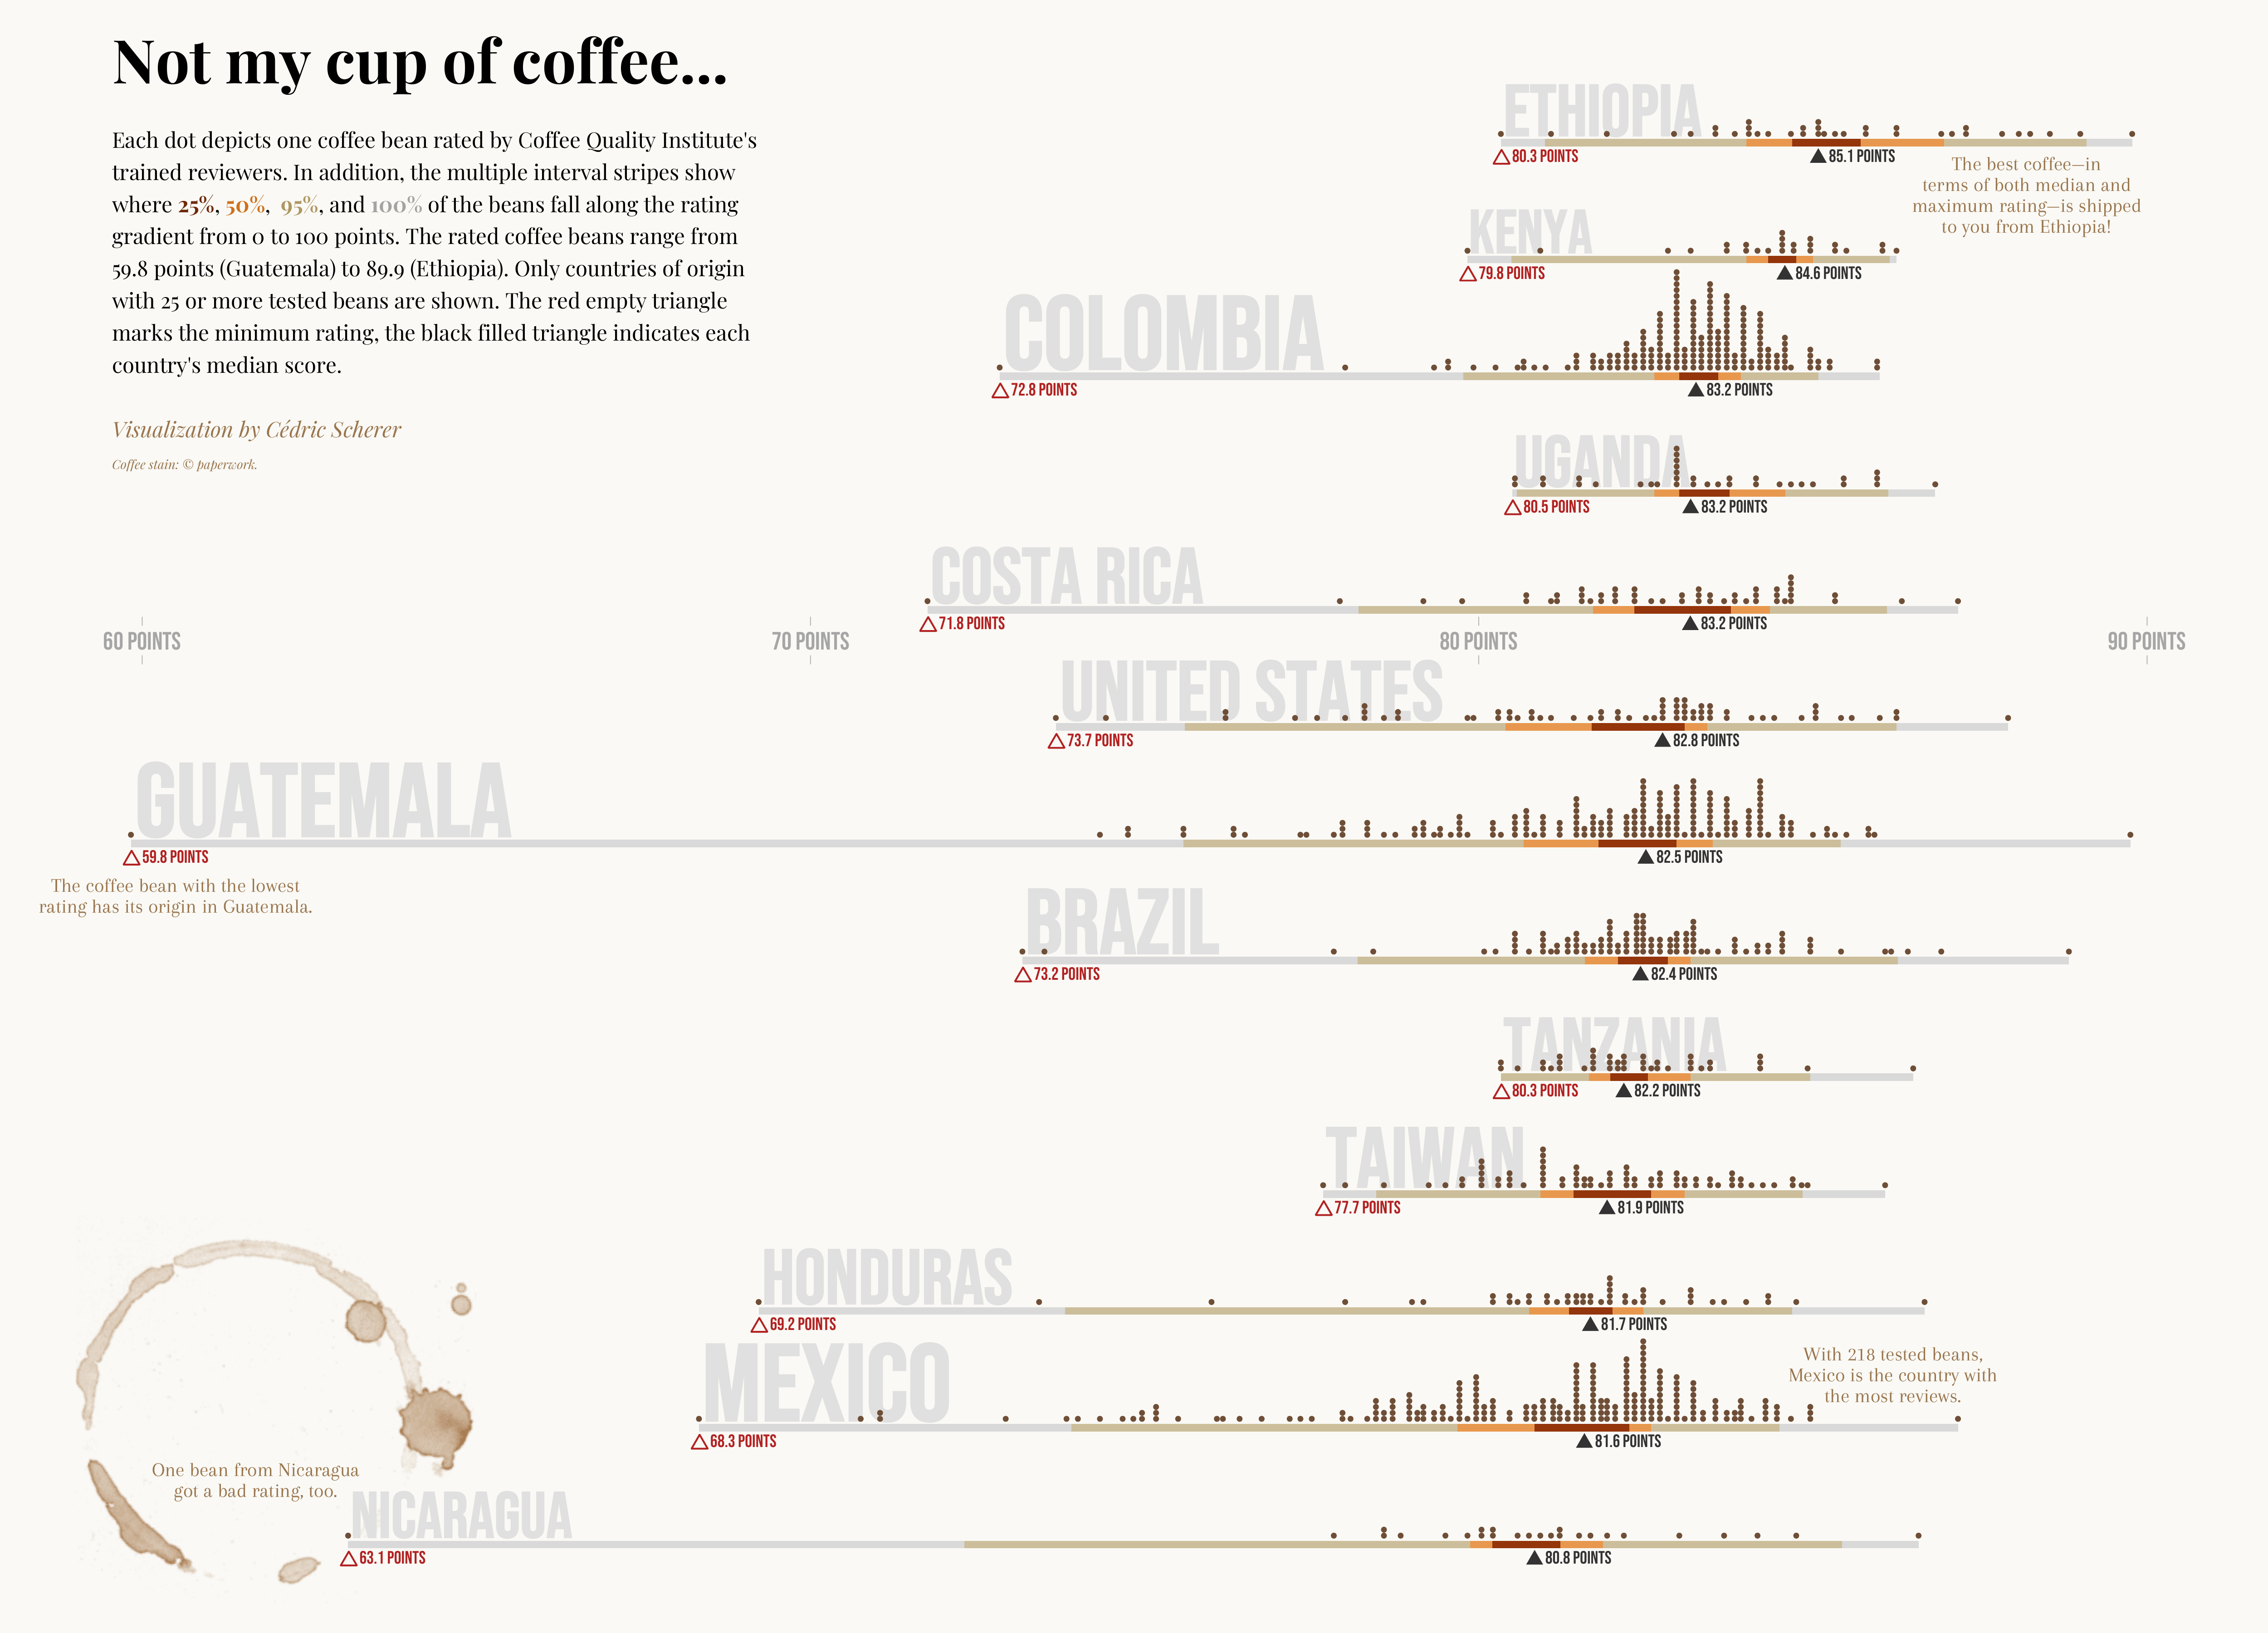
- 2020/28 ☕️ Coffee Ratings
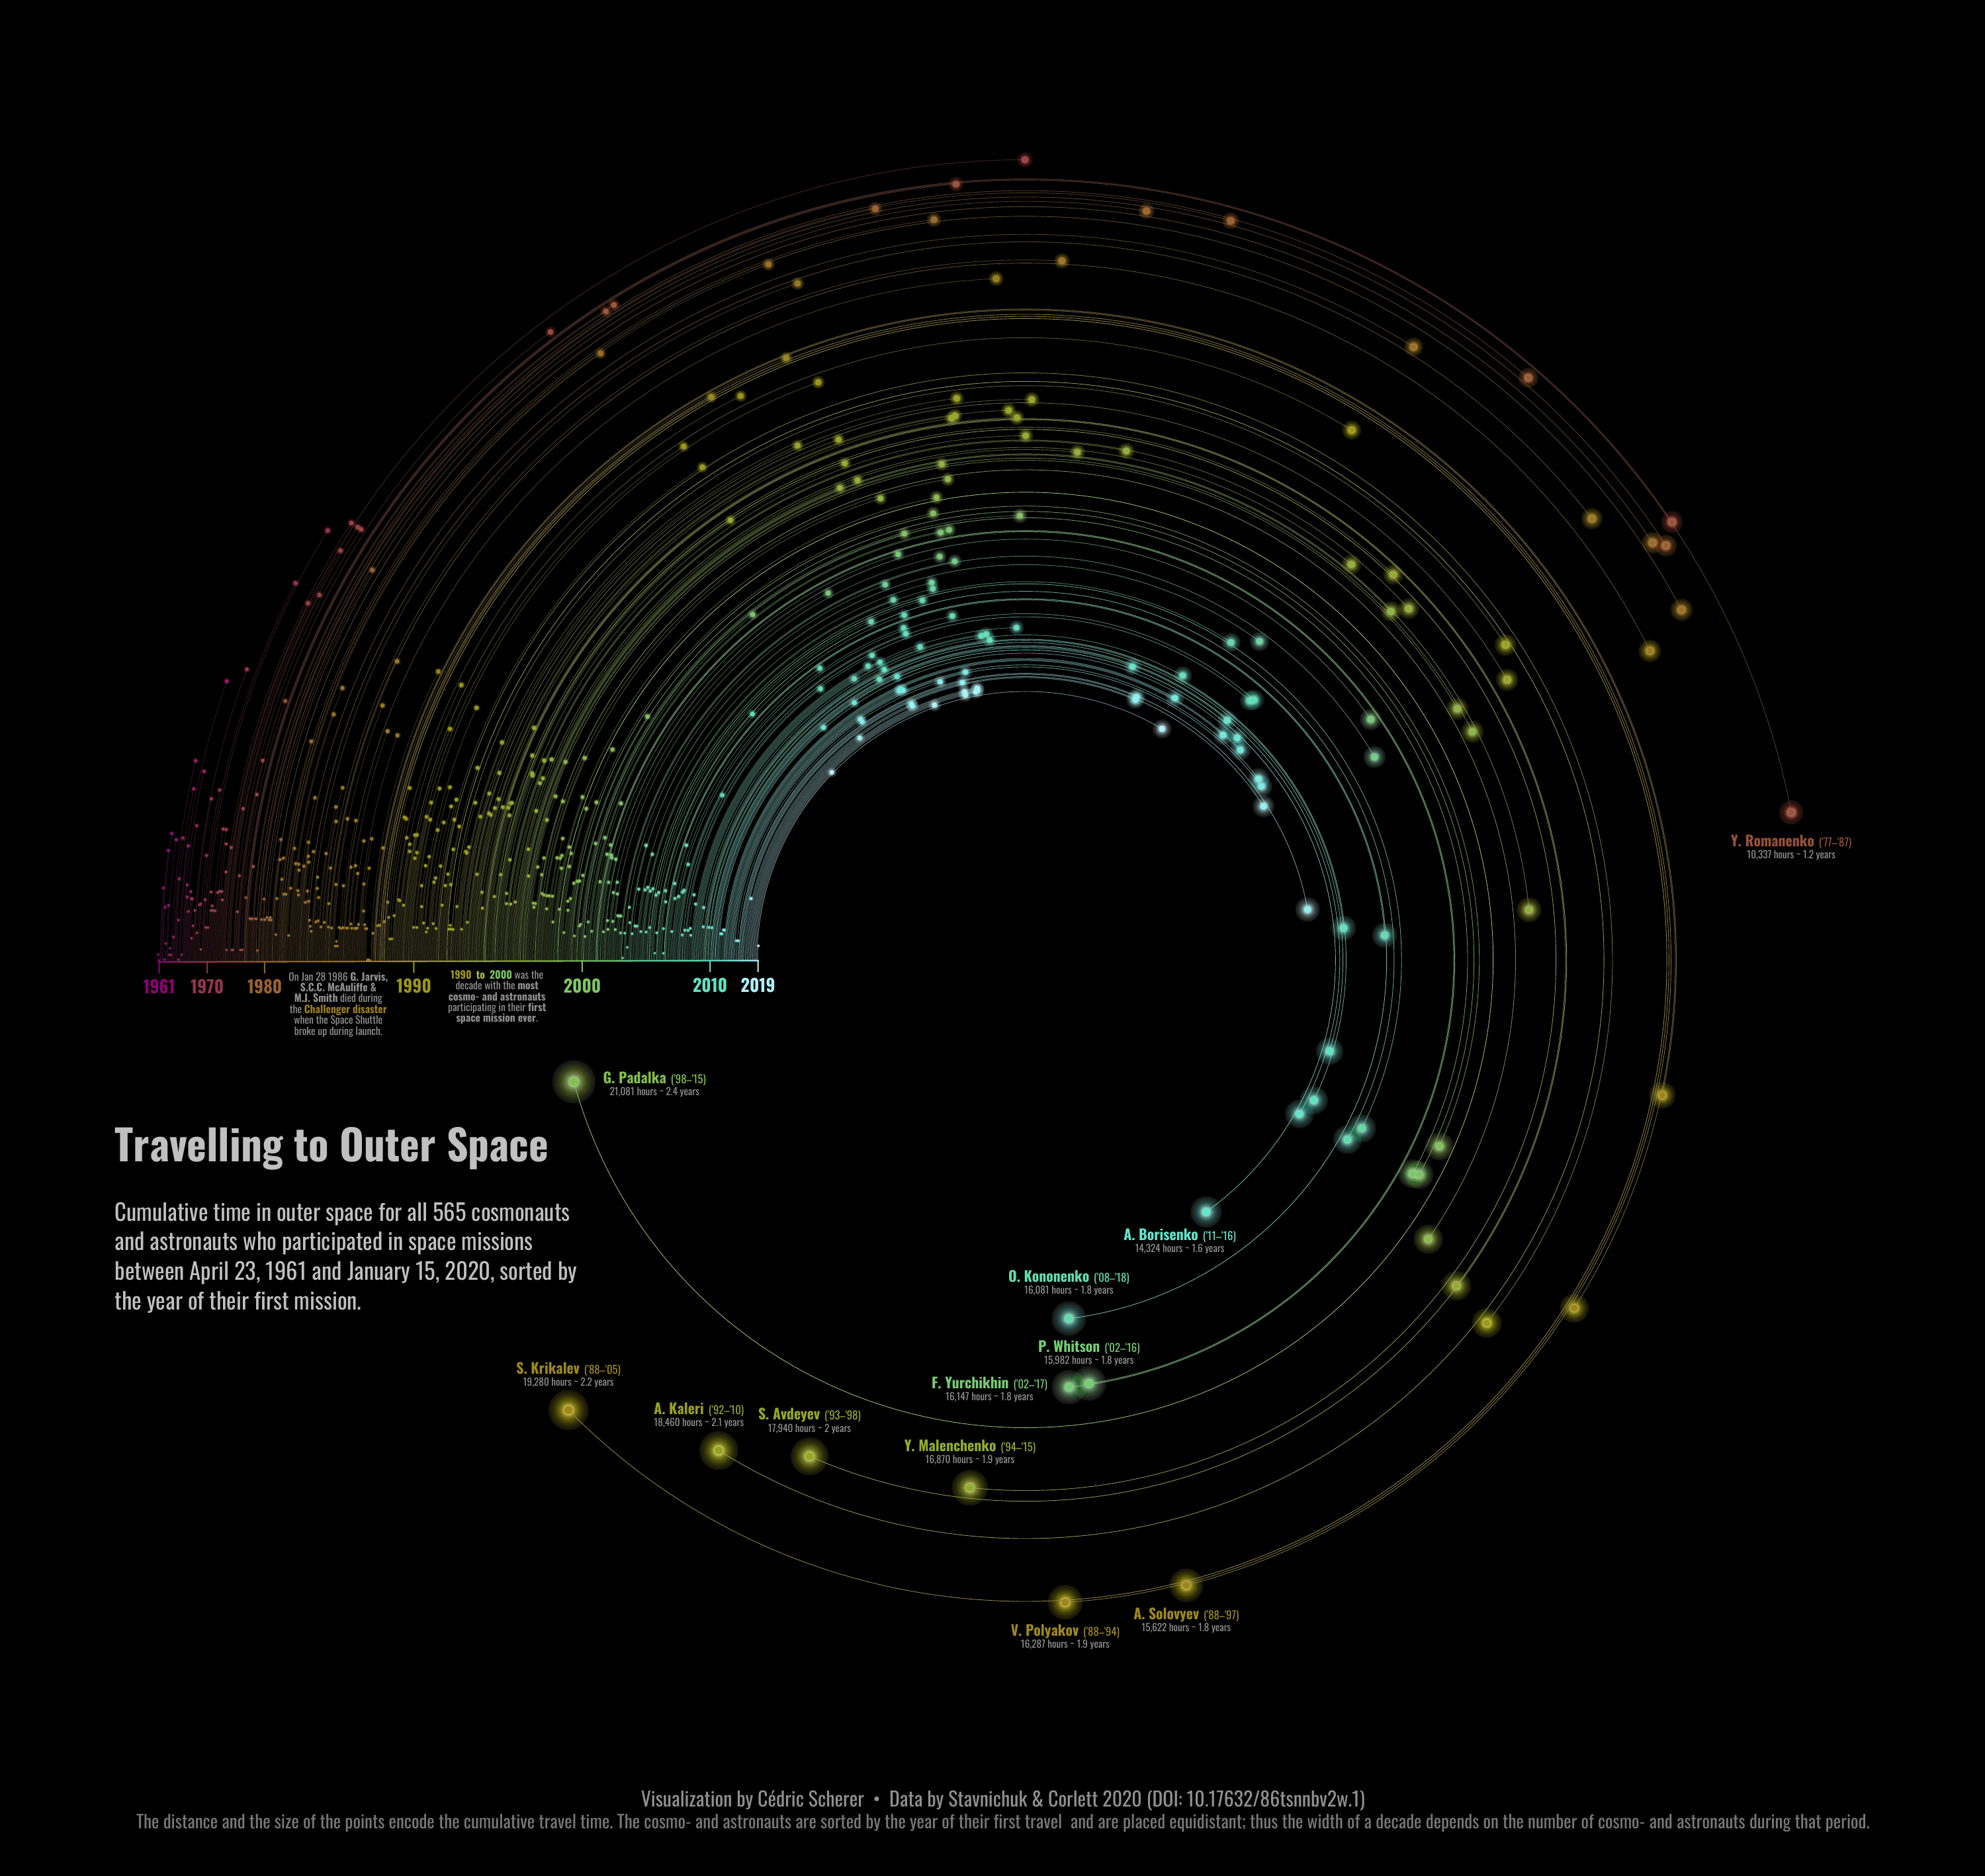
- 2020/29 👨🚀 Astronaut Database
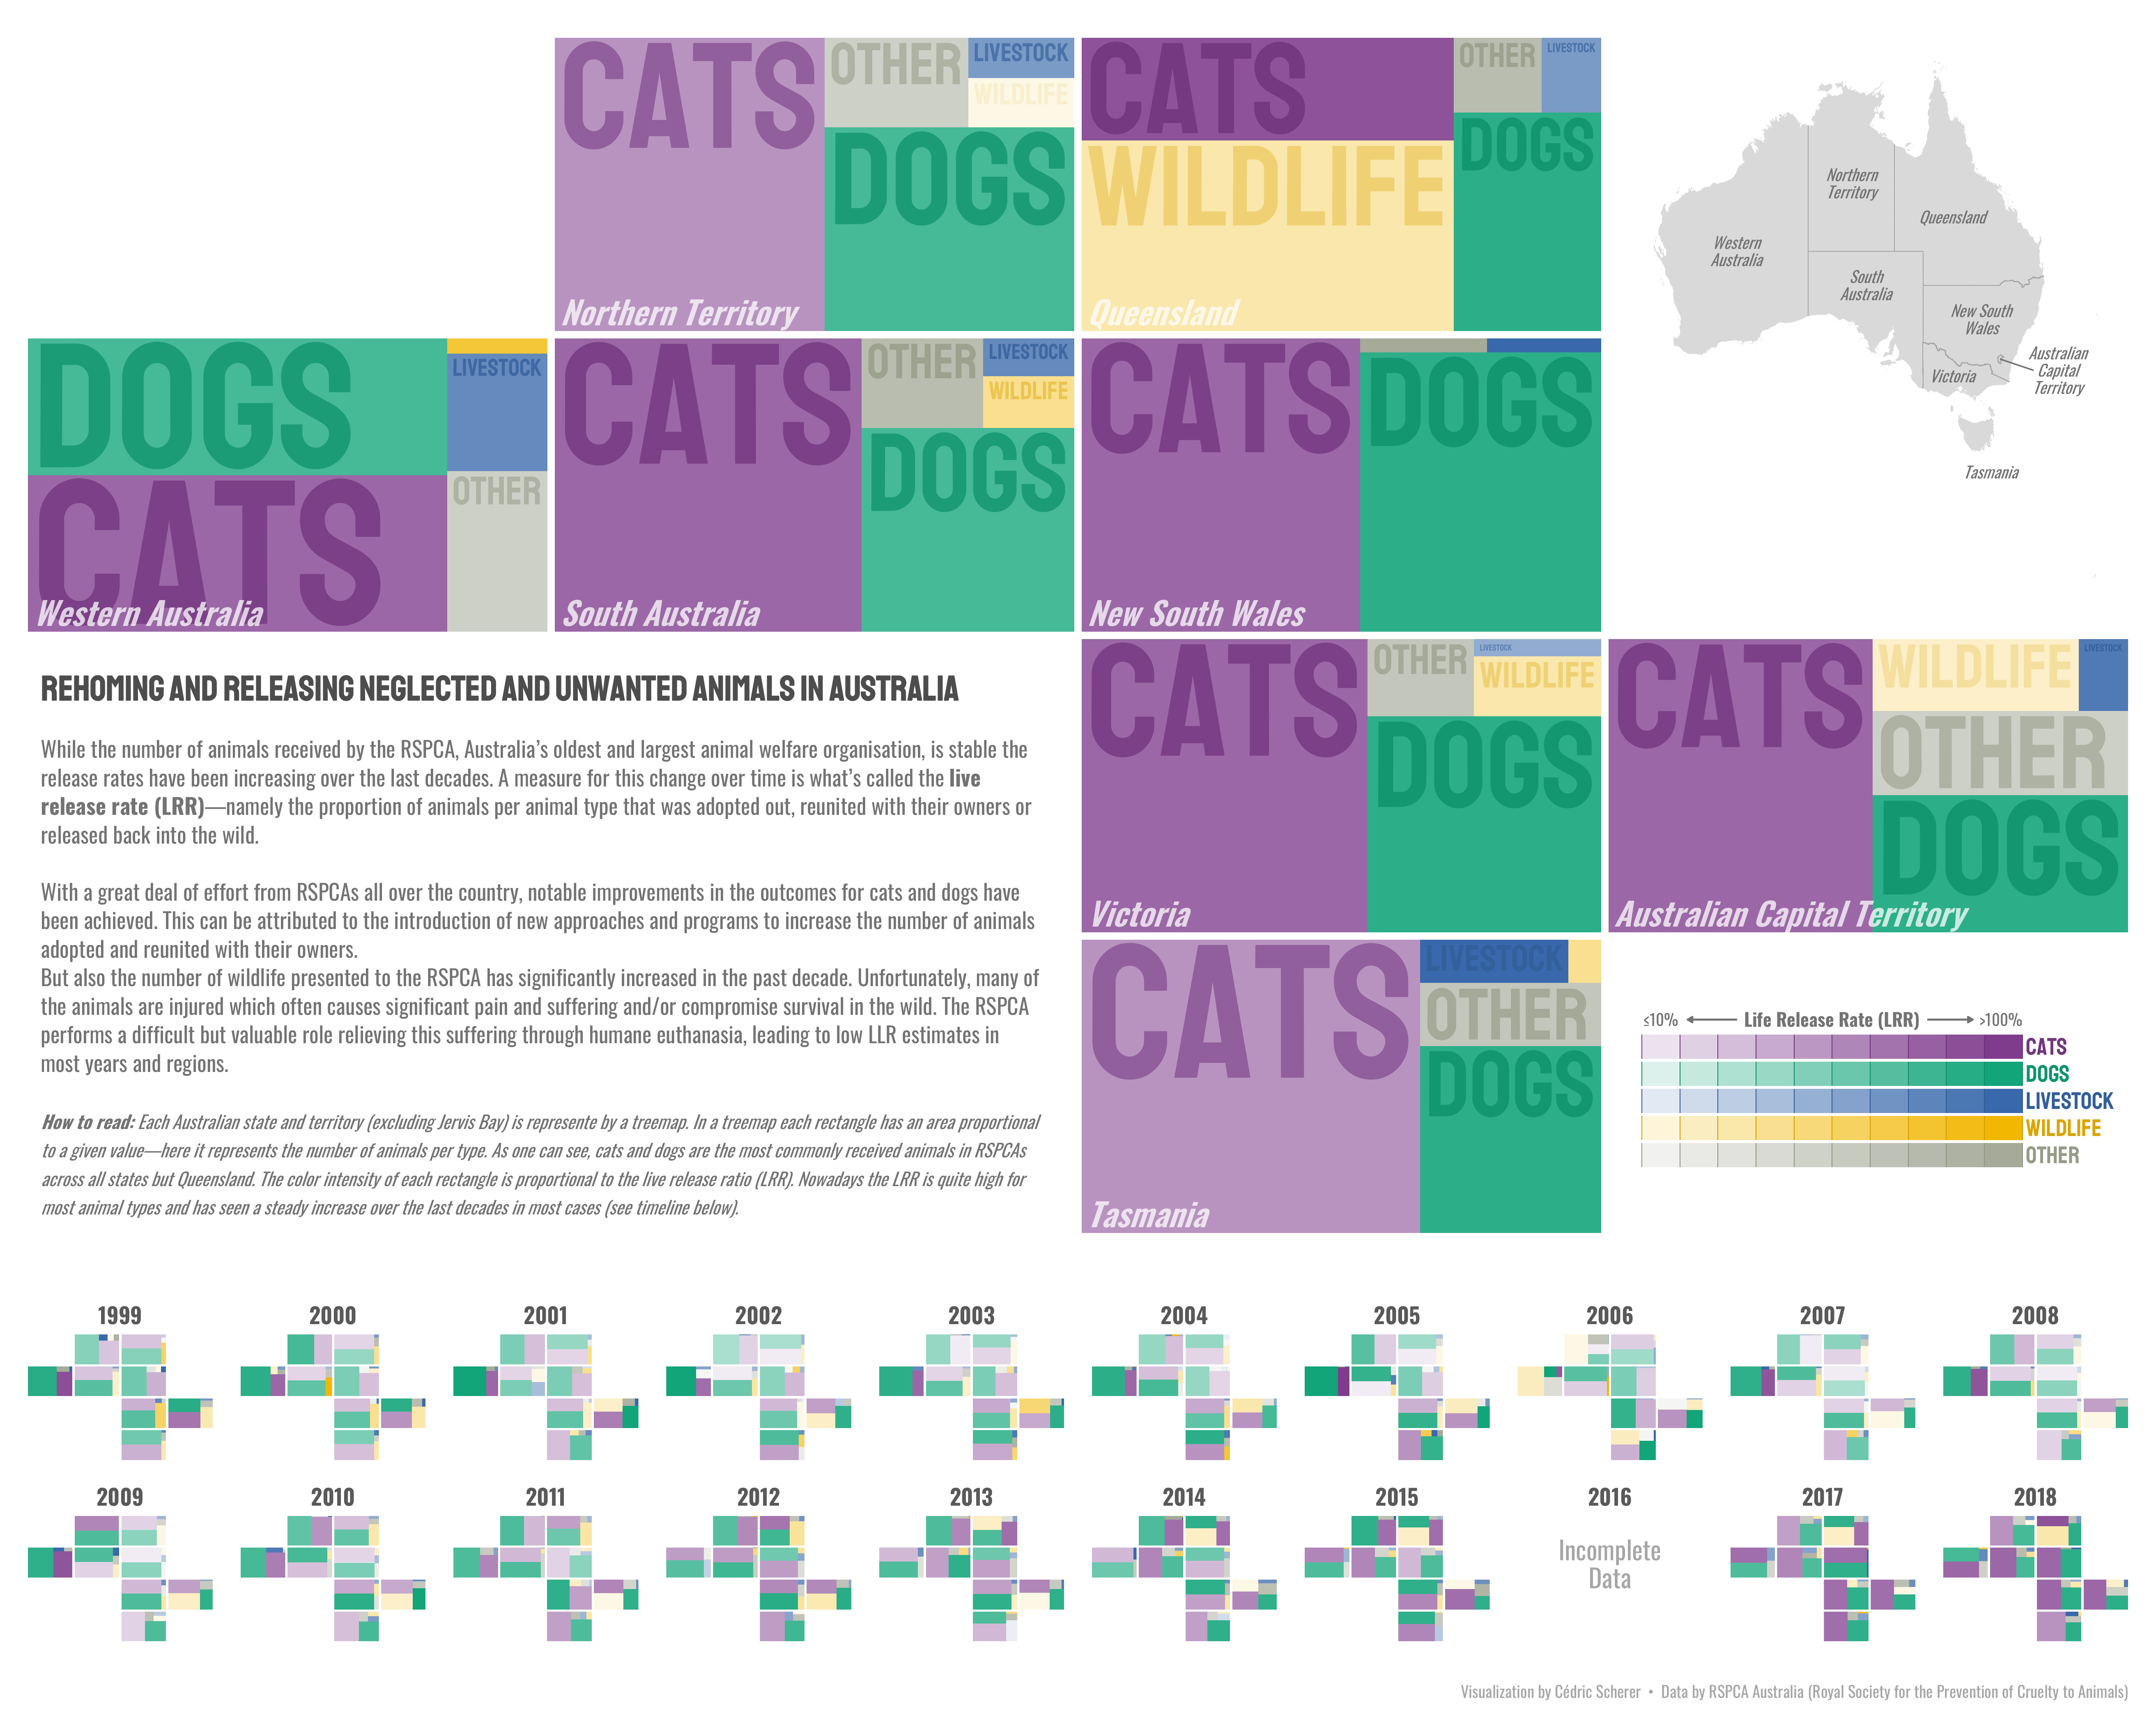
- 2020/30 😿 Australian Animal Outcomes
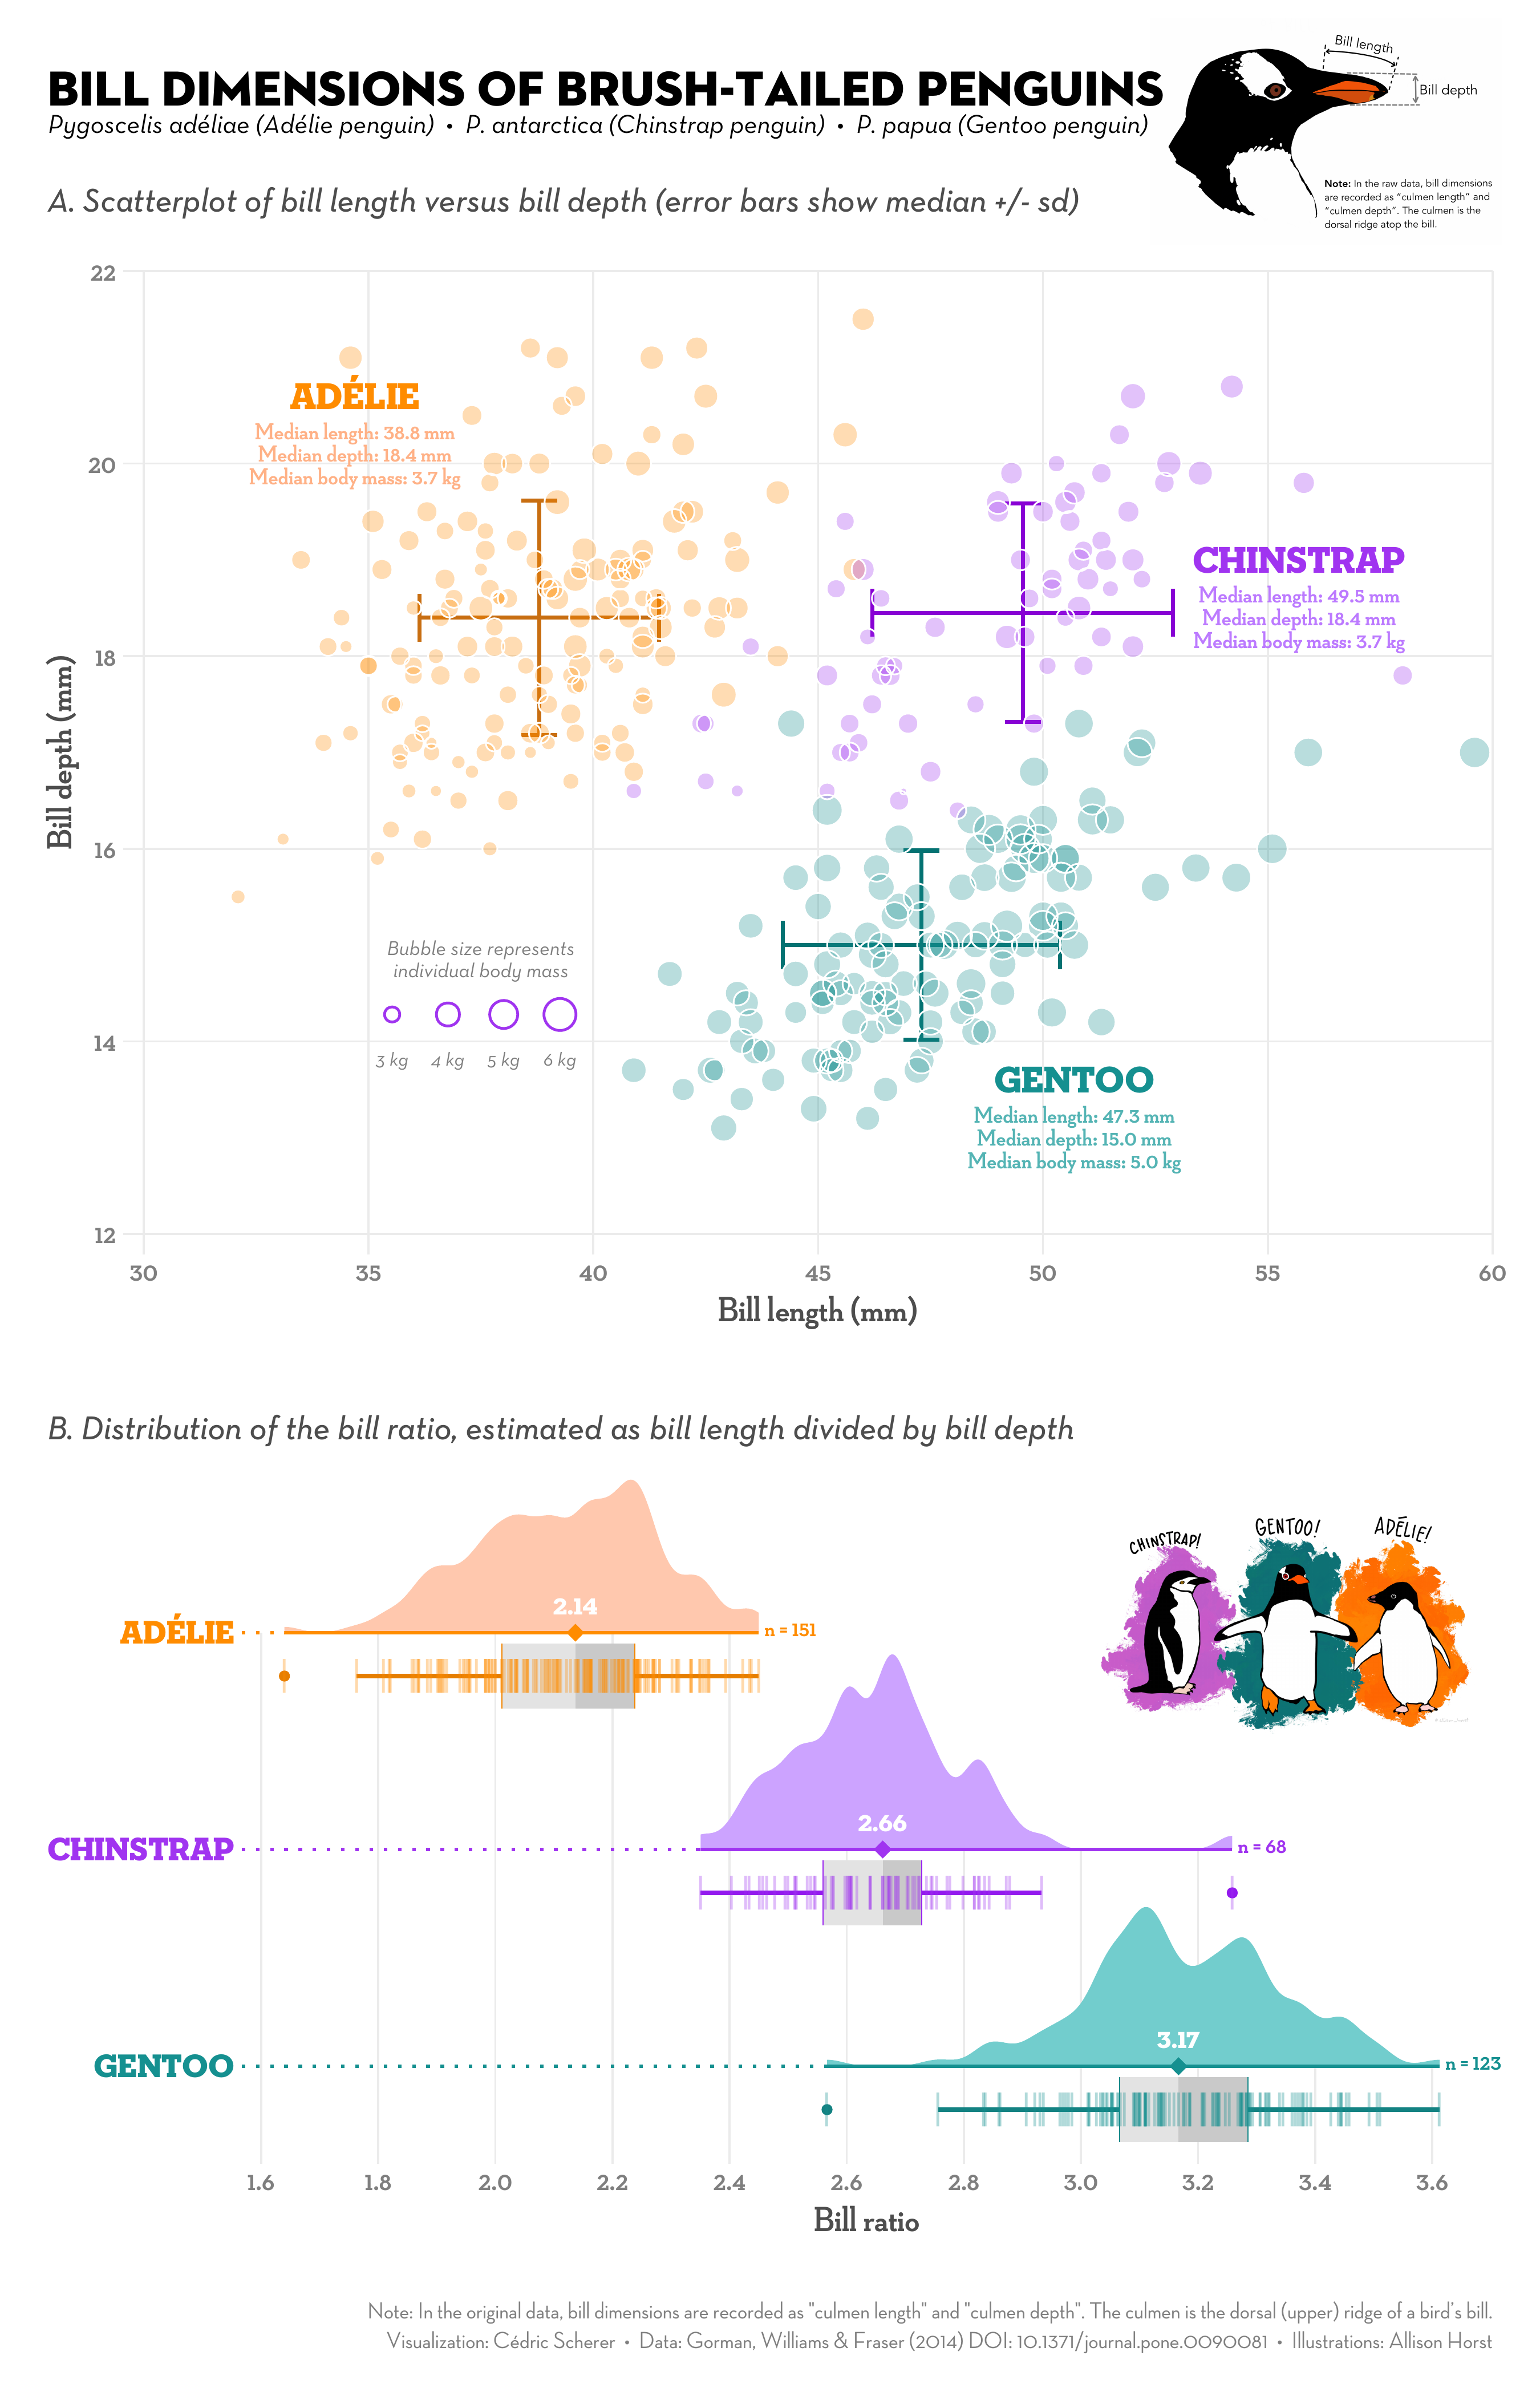
- 2020/31 🐧 Palmer Penguins
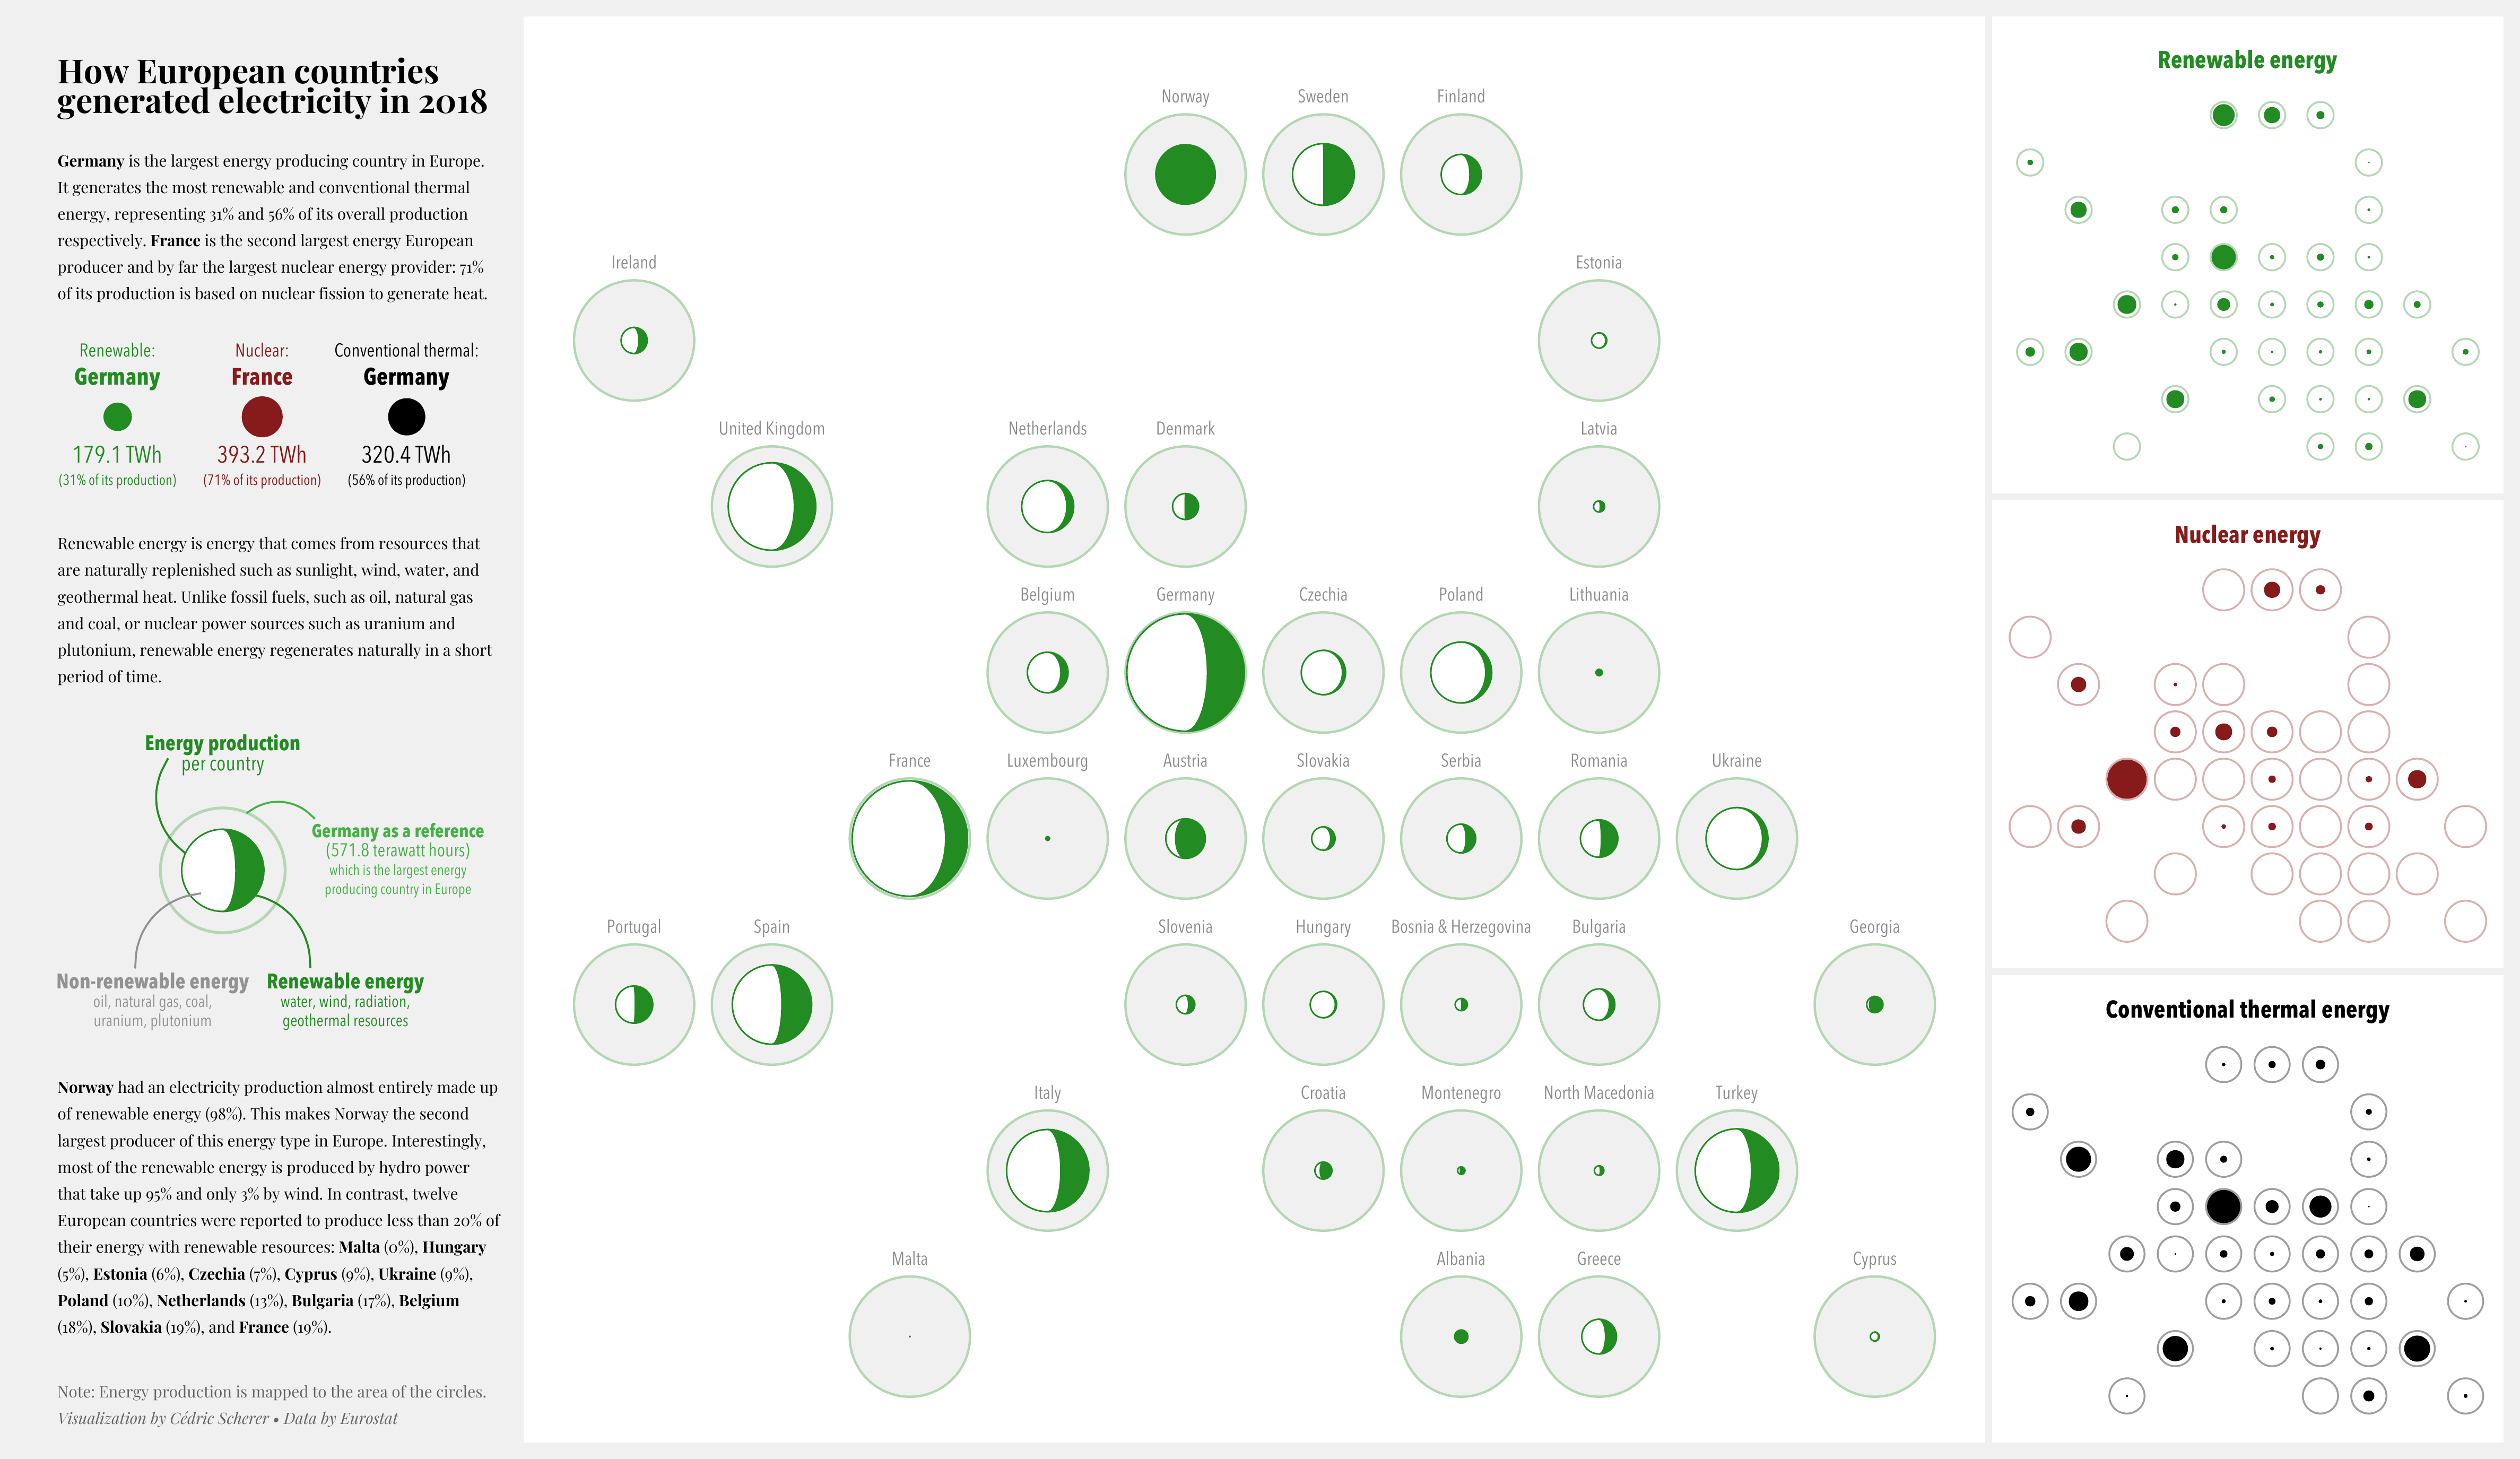
- 2020/32 ⚡ European Energy
- 2020/33 ⚔️ Avatar: The Last Airbender
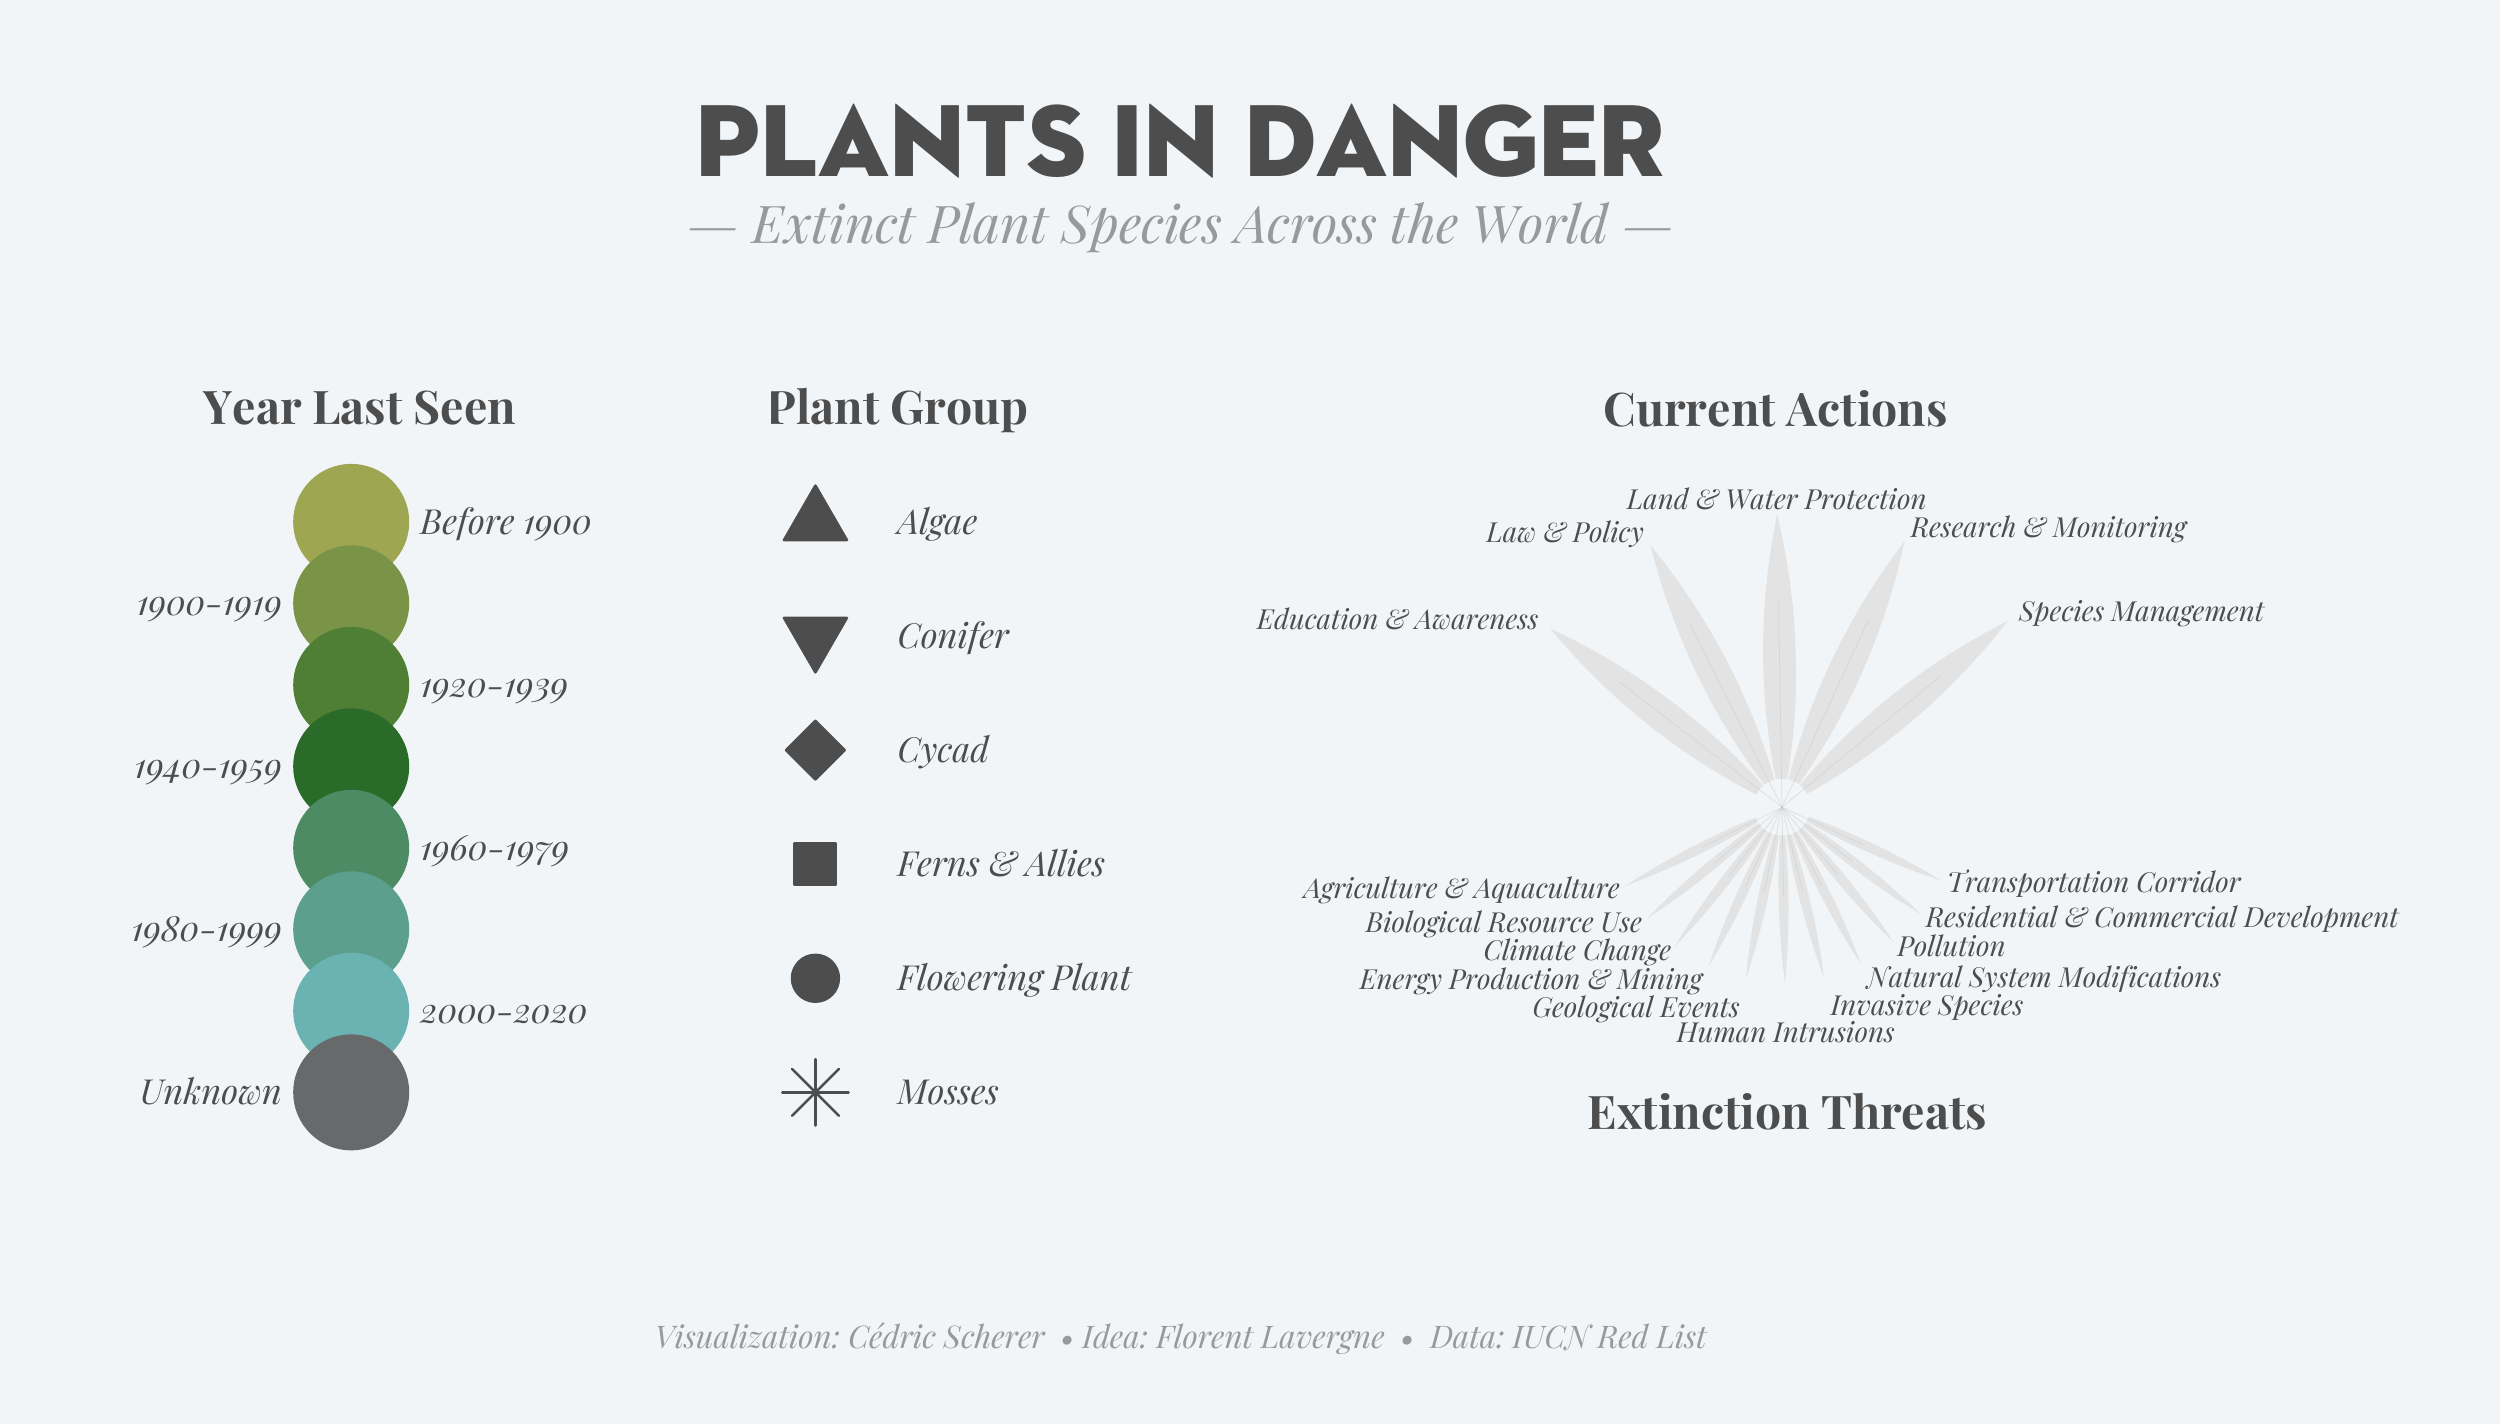
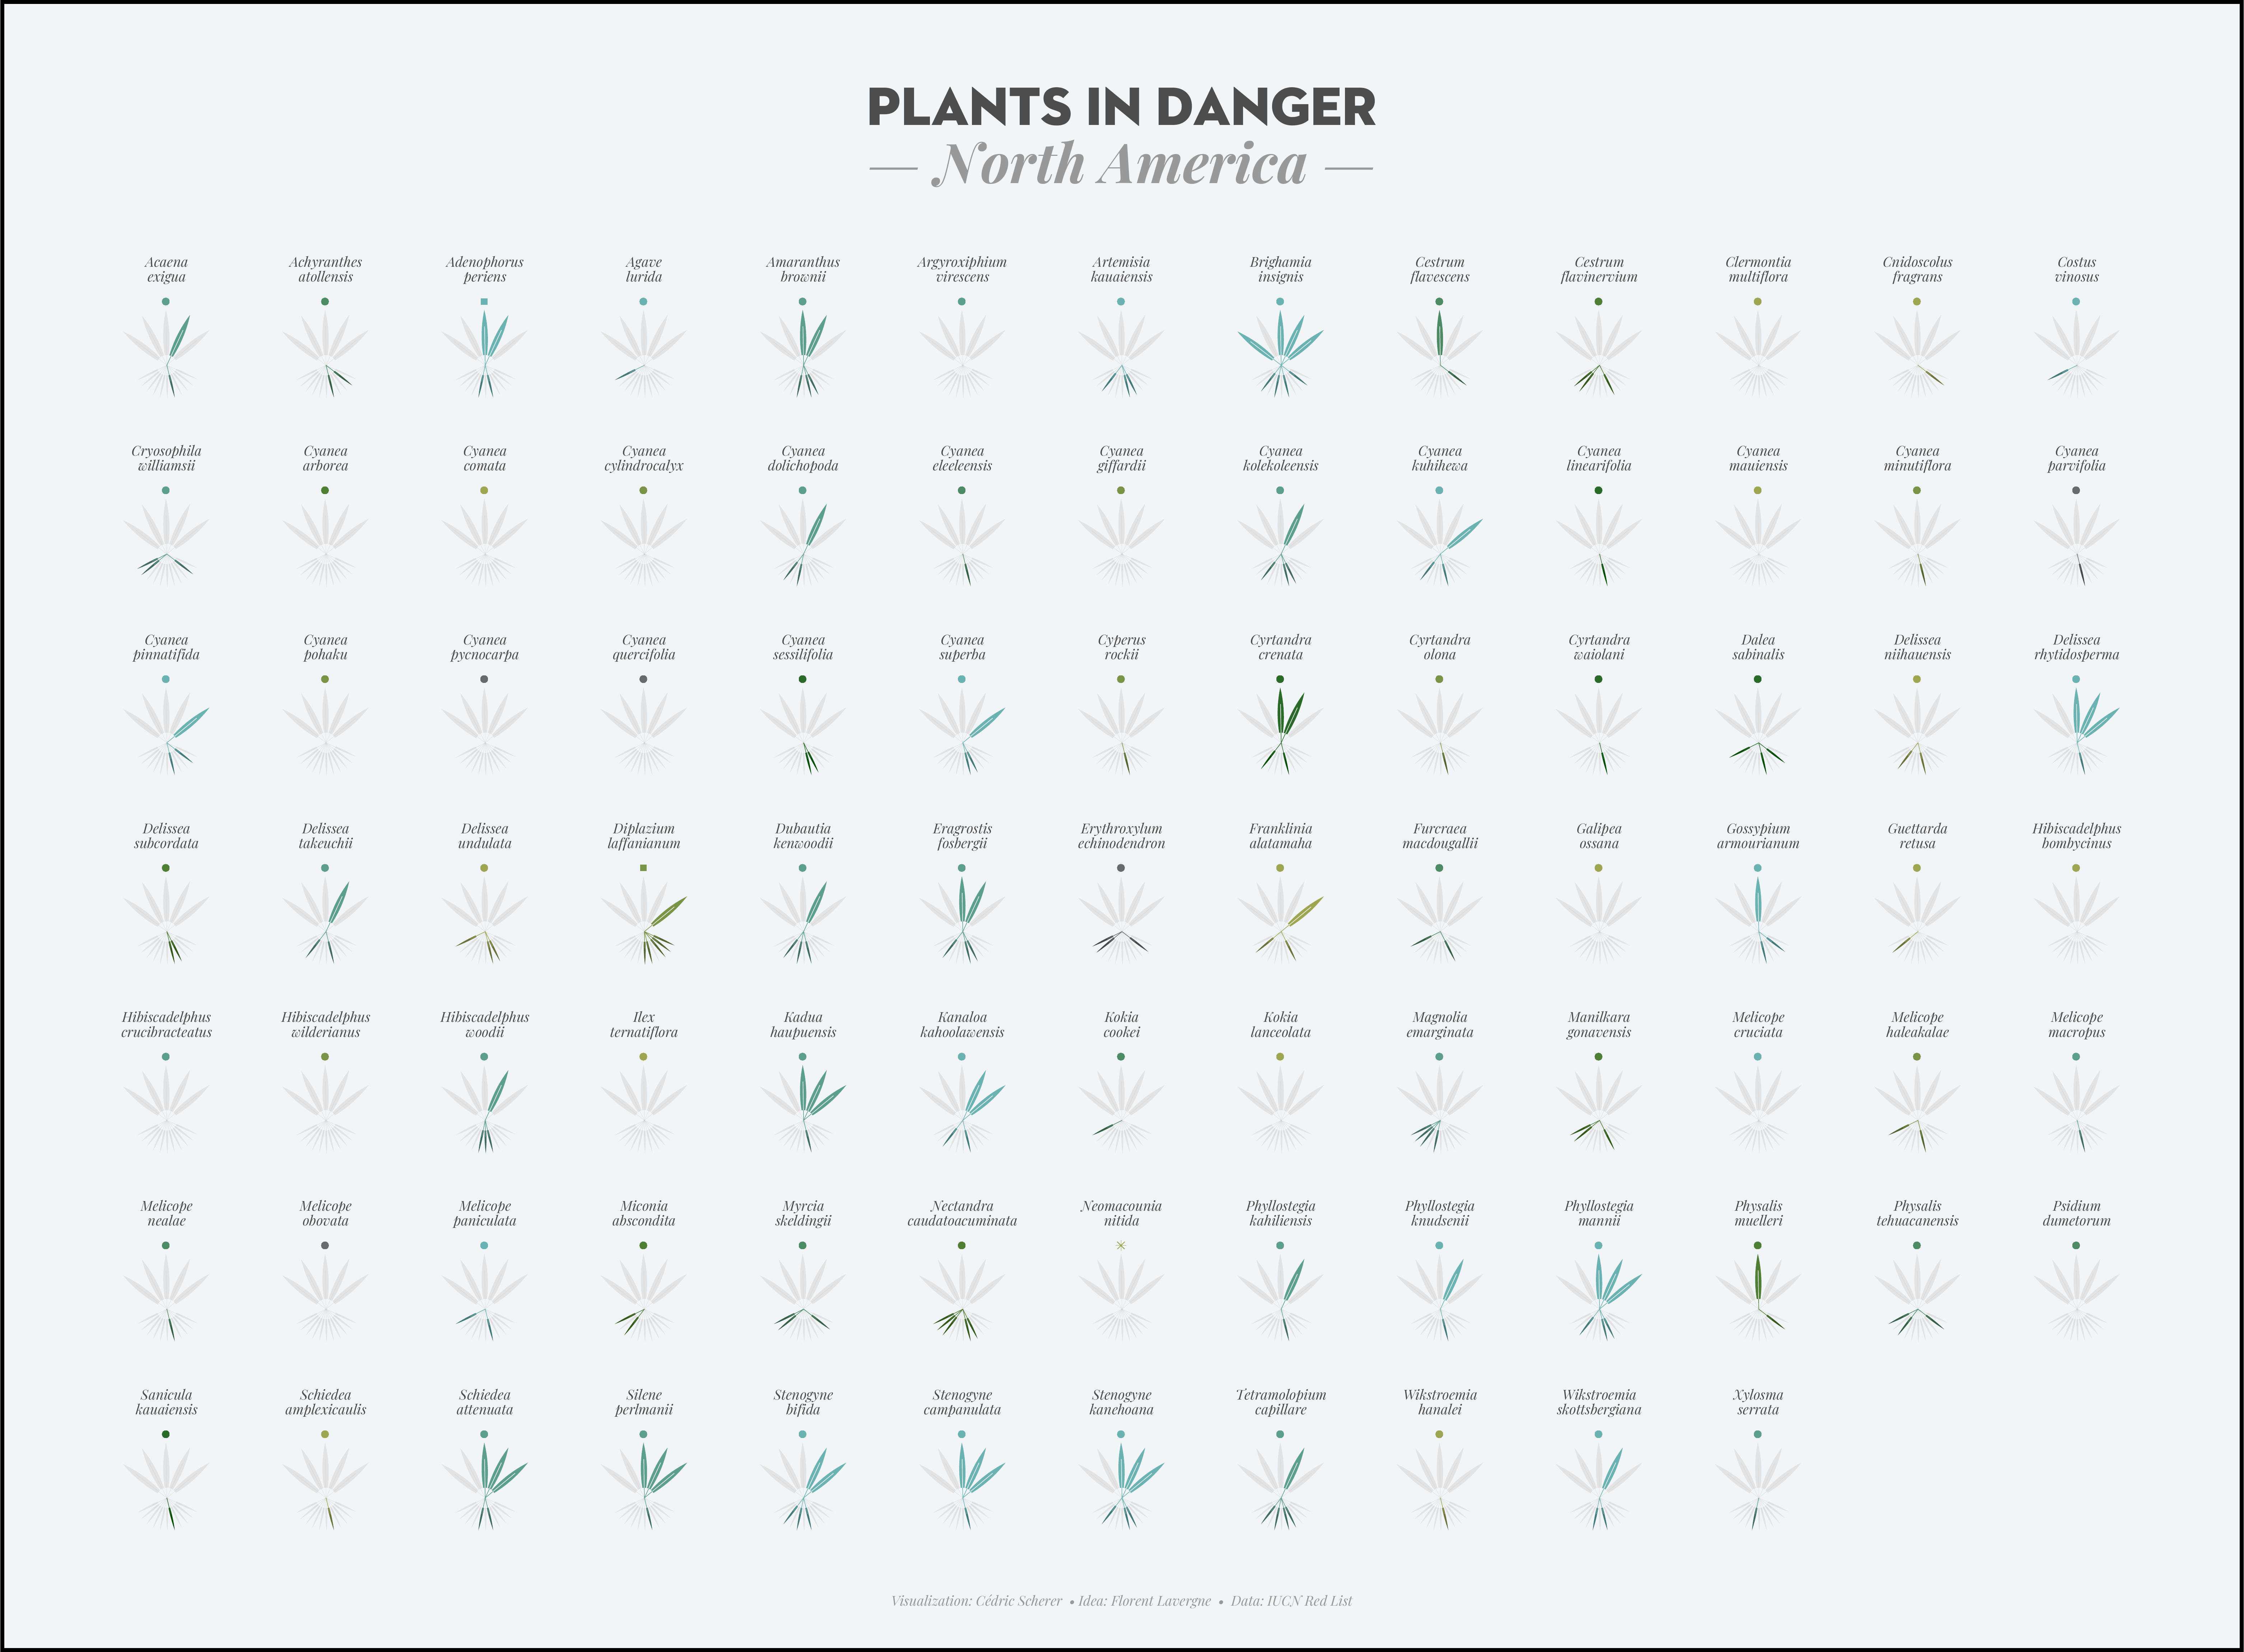
- 2020/34 🌱 Extinct Plants
- 2020/36 🌾 Global Crop Yields (Shiny App)
- 2020/37 👯 FRIENDS Transcripts
- 2020/38 💊 Children Public Health Efforts
- 2020/41 🏀 NCAA Women's Basketball
- 2020/42 🦖 The Datasaurus Dozen
- 2020/43 🍻 Great American Beer Festival
- 2020/44 🌬️ Canadian Wind Turbines
- 2020/46 📱 Historical Phones
- 2020/48 🥾 Washington Trails
- 2020/51 🏋️ Ninja Warrior
- 2020/52 🍔️ Big Mac Index
-
Challenges 2021
- 2021/01 📈 Bring Your Own Data: My
geom+statUsage - 2021/02 🚇 Transit-Infrastructure Costs
- 2021/09 👩 U.S. Employment
- 2021/19 🚰 Water Access Points
- 2021/22 🍄 Mario Kart 64 World Records
- 2021/25 ✊🏾 #DuBoisChallenge Tweets
- 2021/27 👩🚒 Animal Rescues
- 2021/01 📈 Bring Your Own Data: My
-
Challenges 2022
- 2022/12 👶 Baby Names
- 2022/36 🟥 LEGO Database
2022/36 🟥 LEGO Database by rebrickable
2022/12 👶 Baby Names by SSA
2021/27 👩🚒 Animal Rescues by london.gov
2021/25 ✊🏾 #DuBoisChallenge Tweets by Anthony Starks, Allen Hillery & Sekou Tyler
2021/22 🍄 Mario Kart 64 World Records by mkwrs.com
2021/19 🚰 Water Access Points by WPDx
2021/09 👨💼👩💼 Employments and Earnings by BLS
2021/02 🚇 Transit-Infrastructure Costs by Transit Costs Project
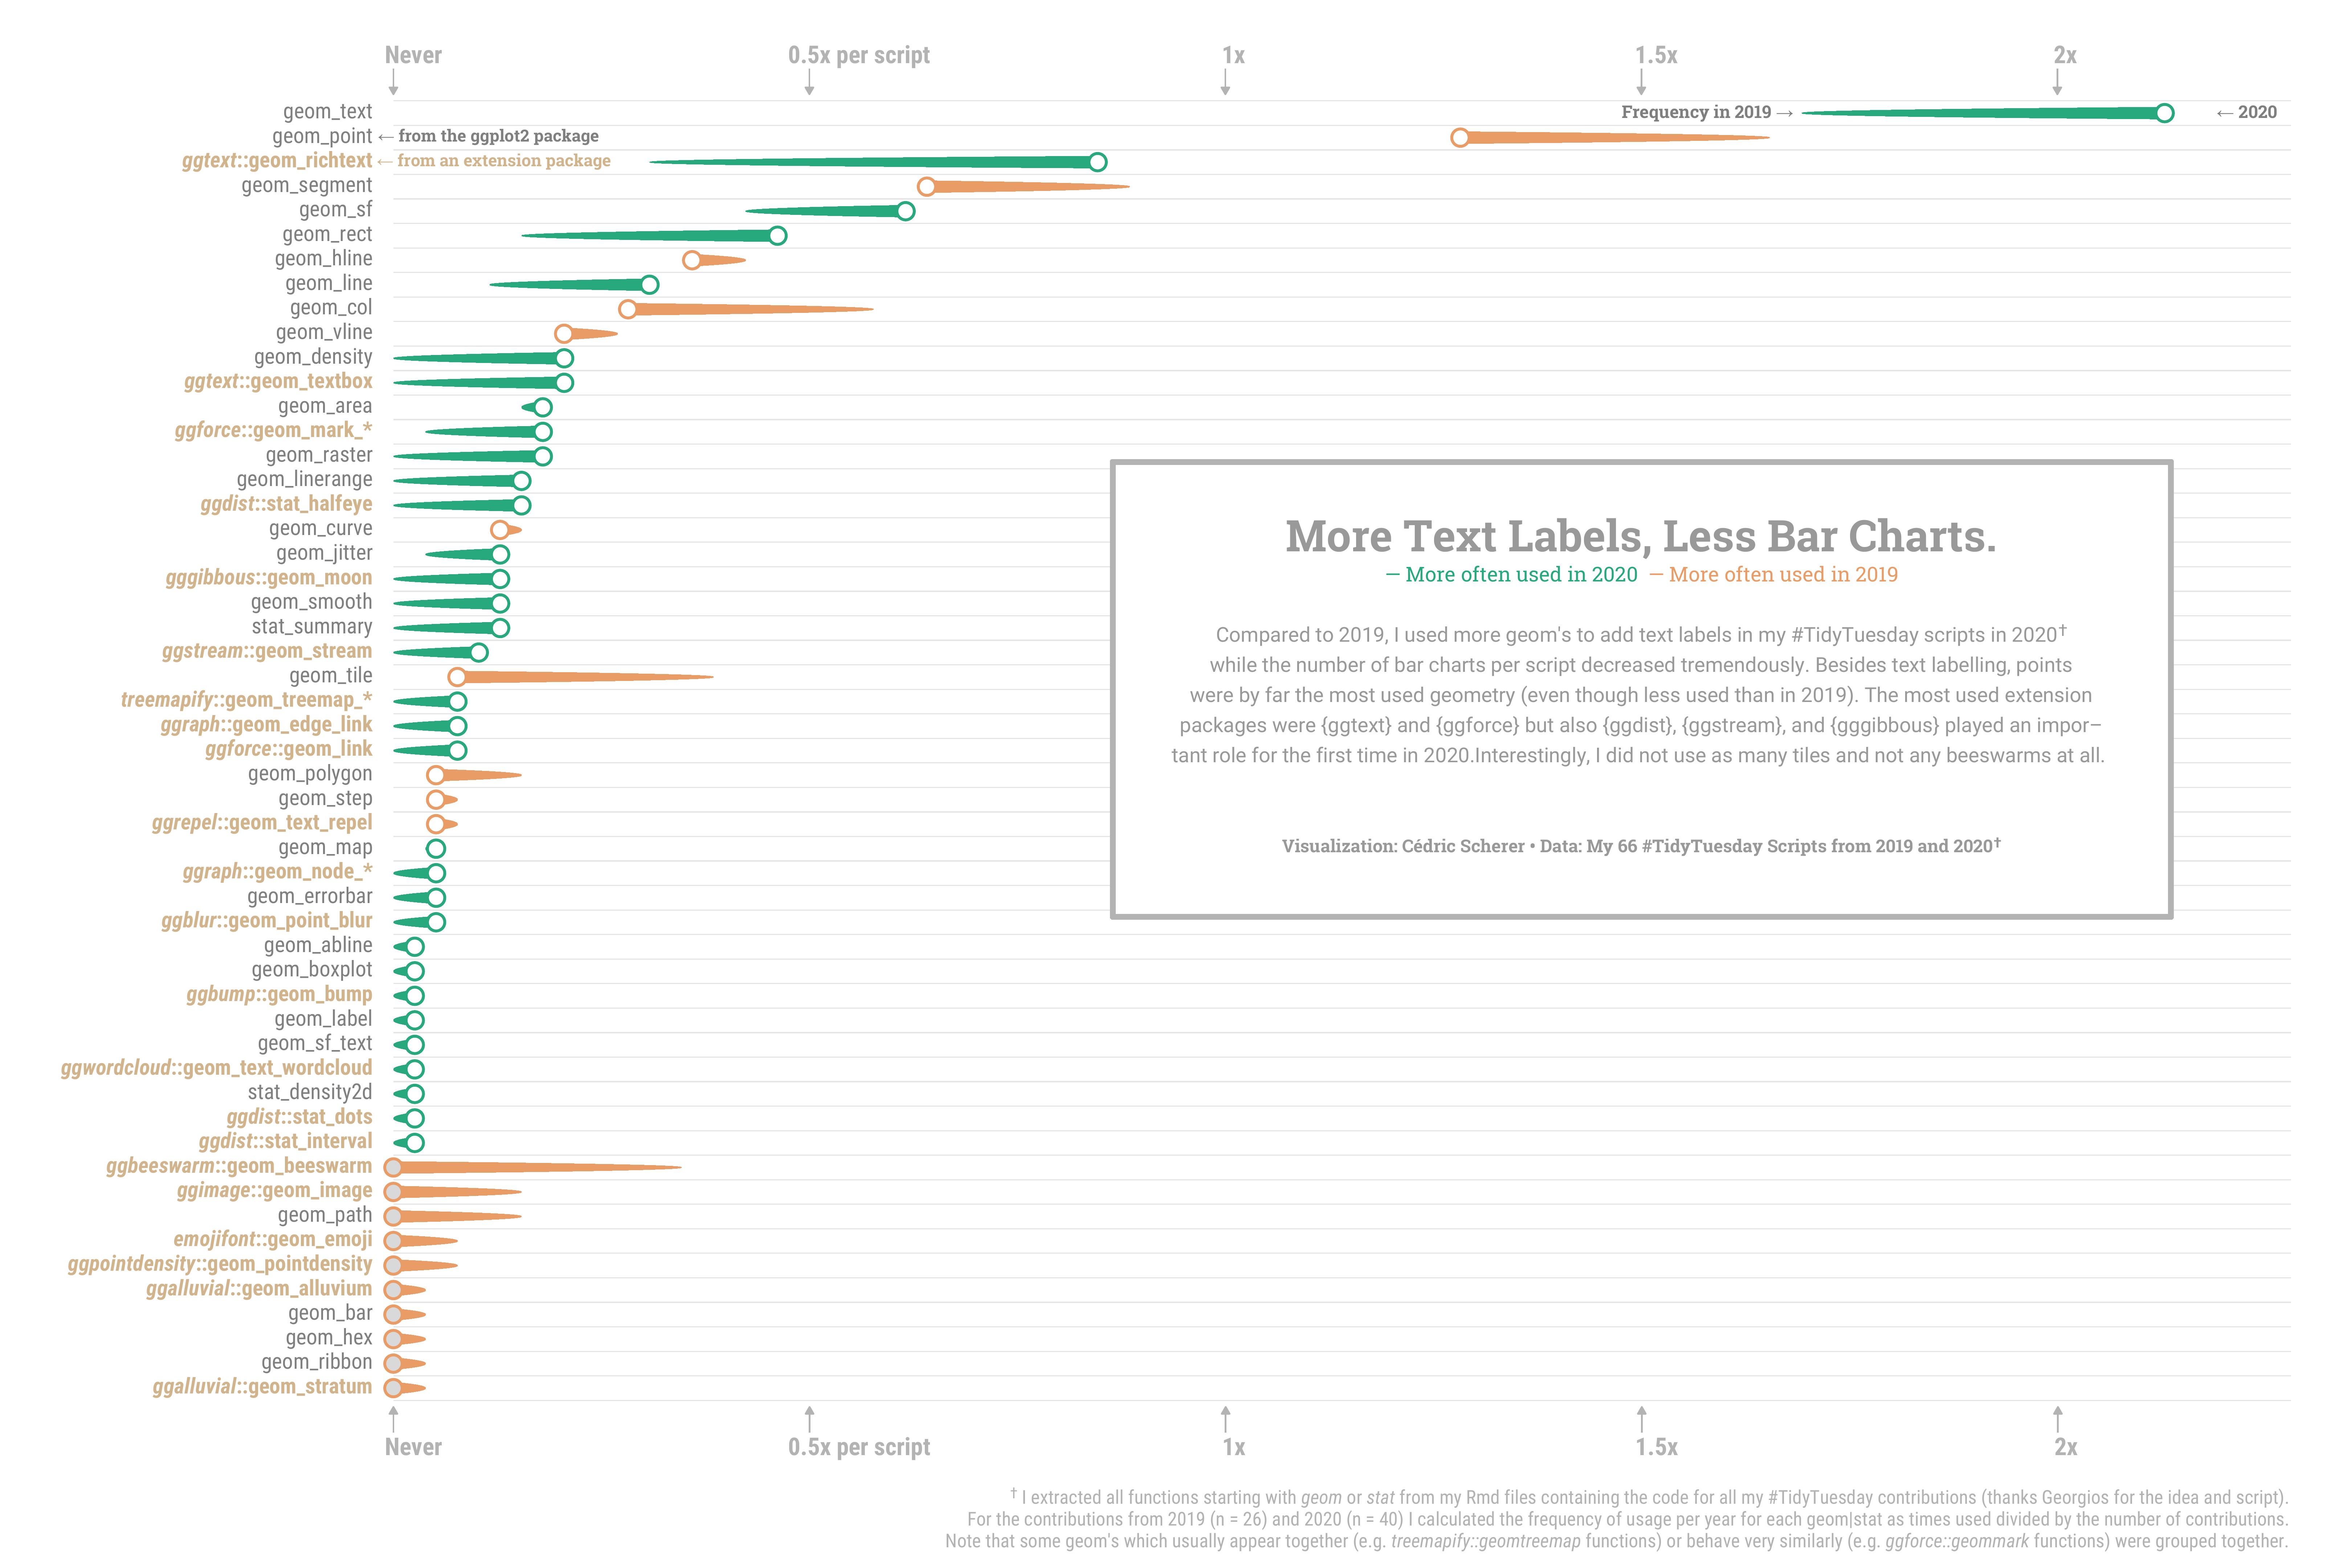
2021/01 📈 Usage of geom & stat Functions by me
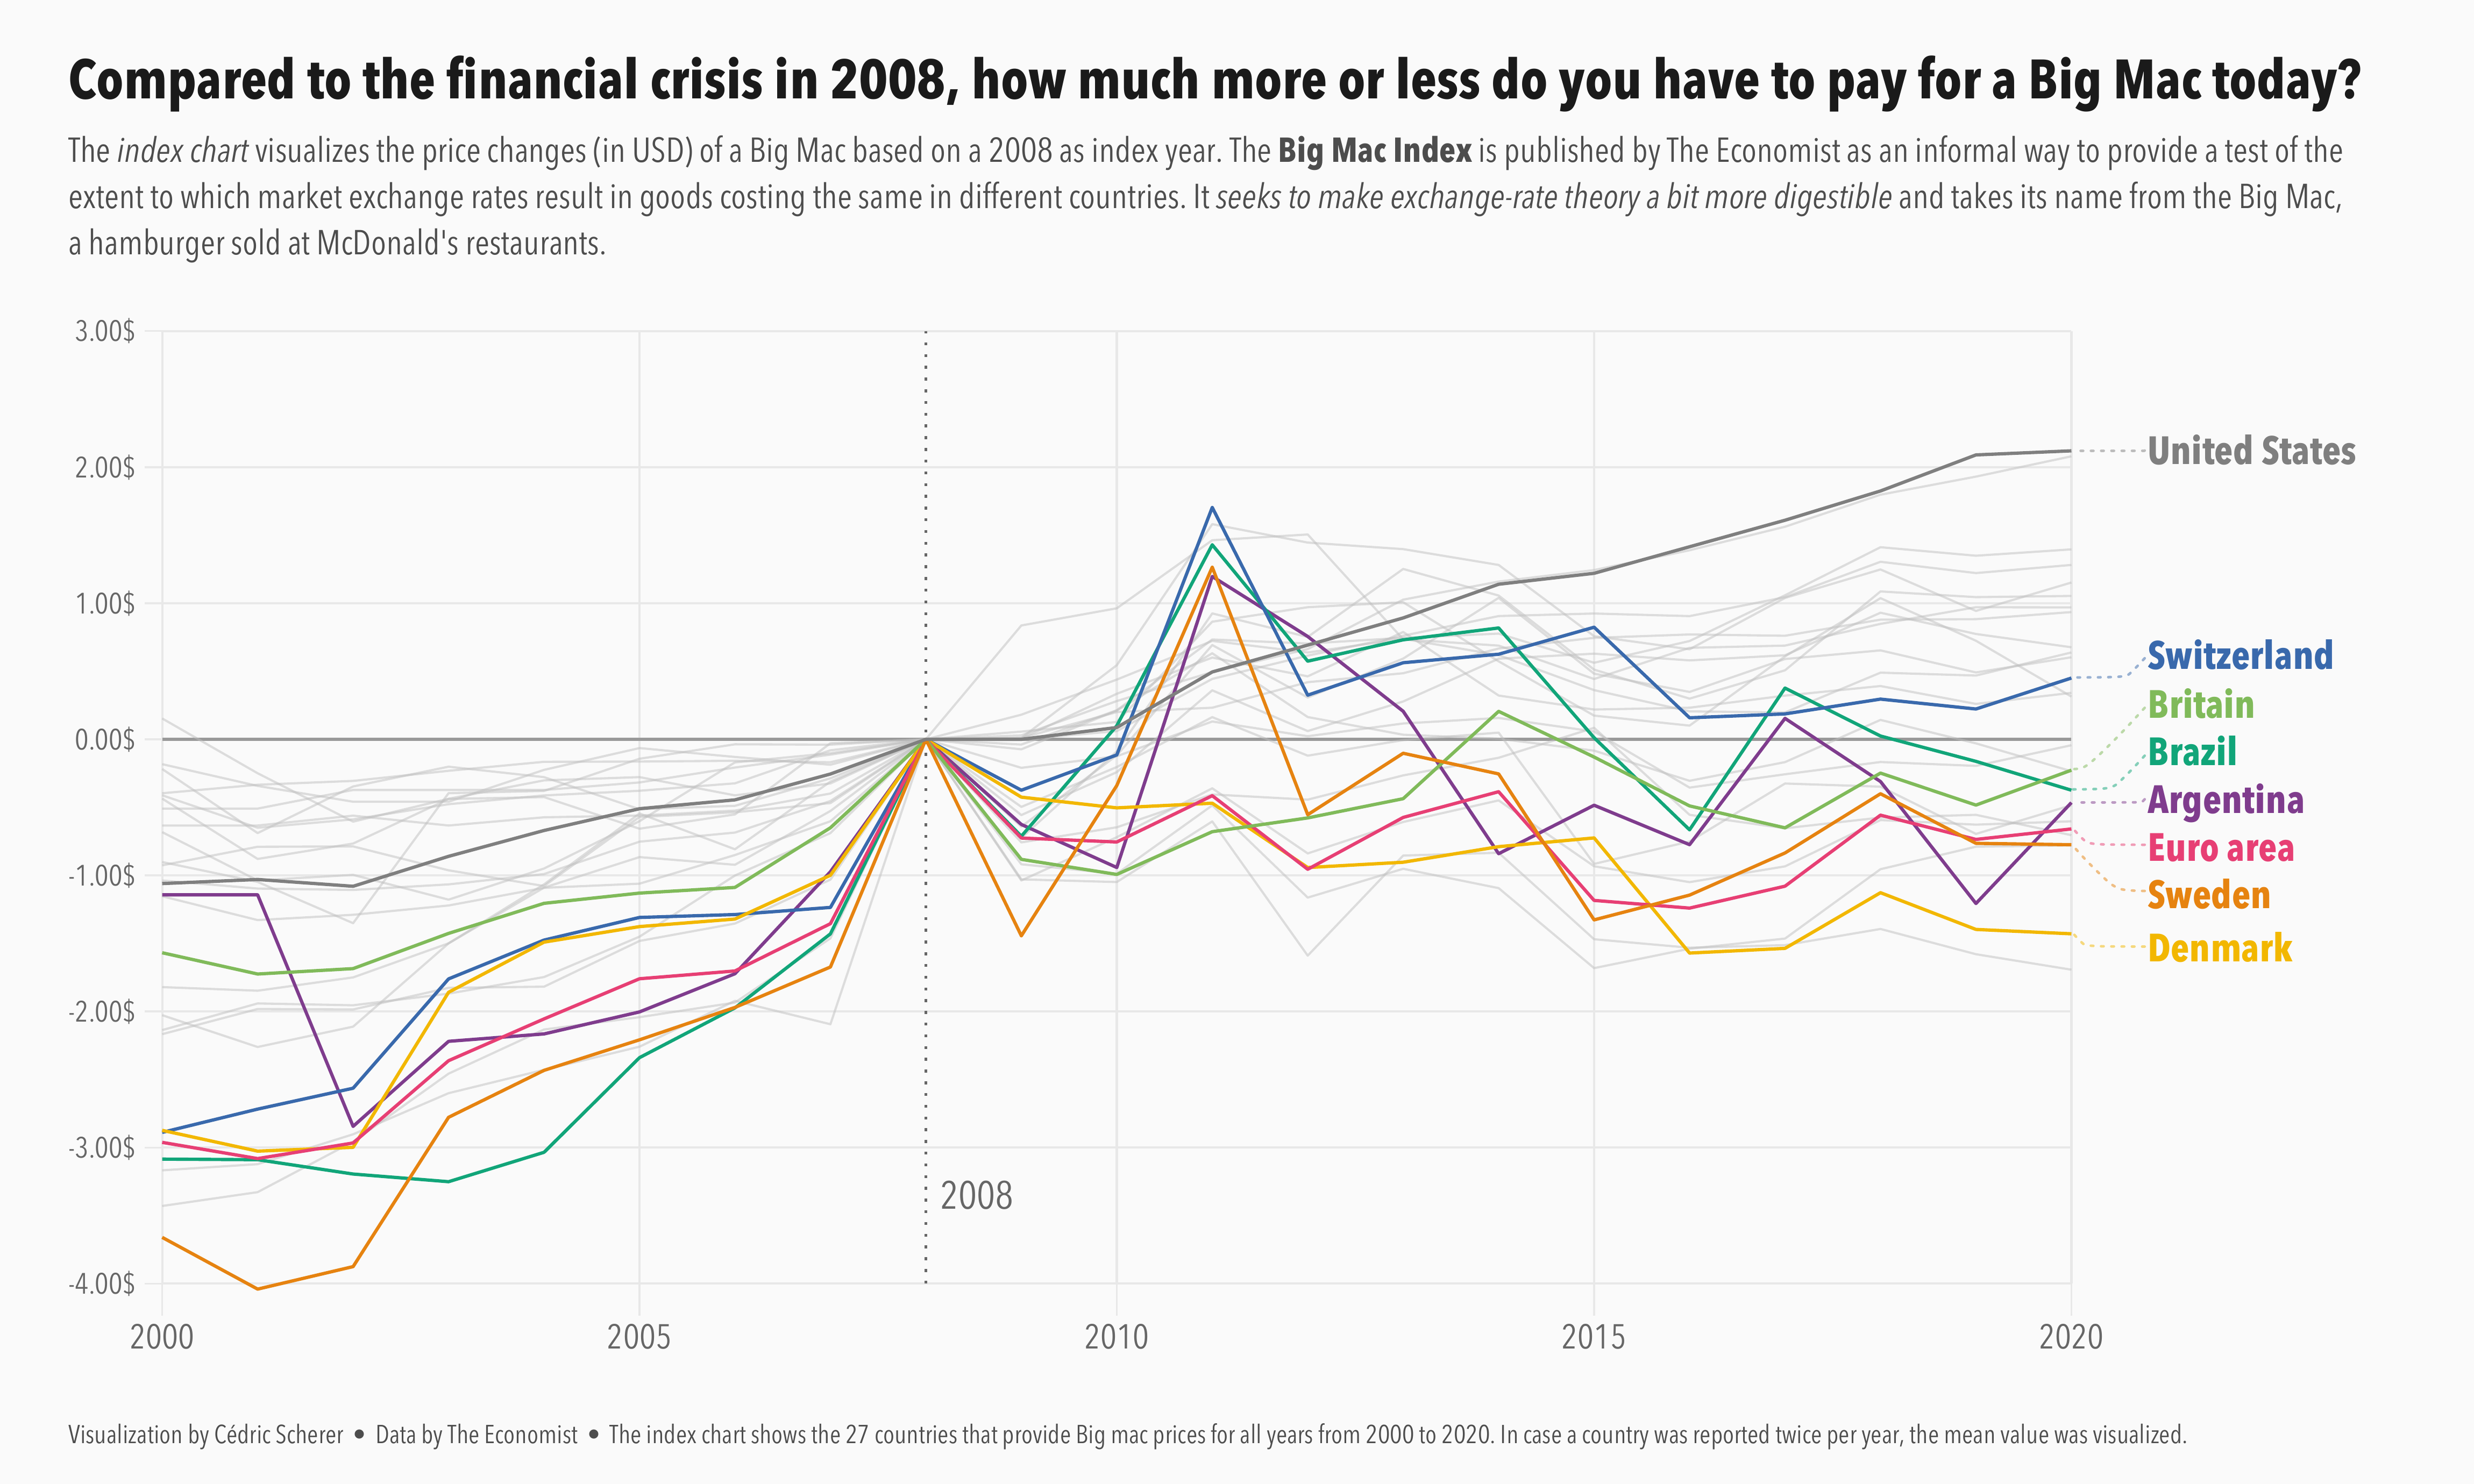
2020/52 🍔️ Big Mac Index by The Economist
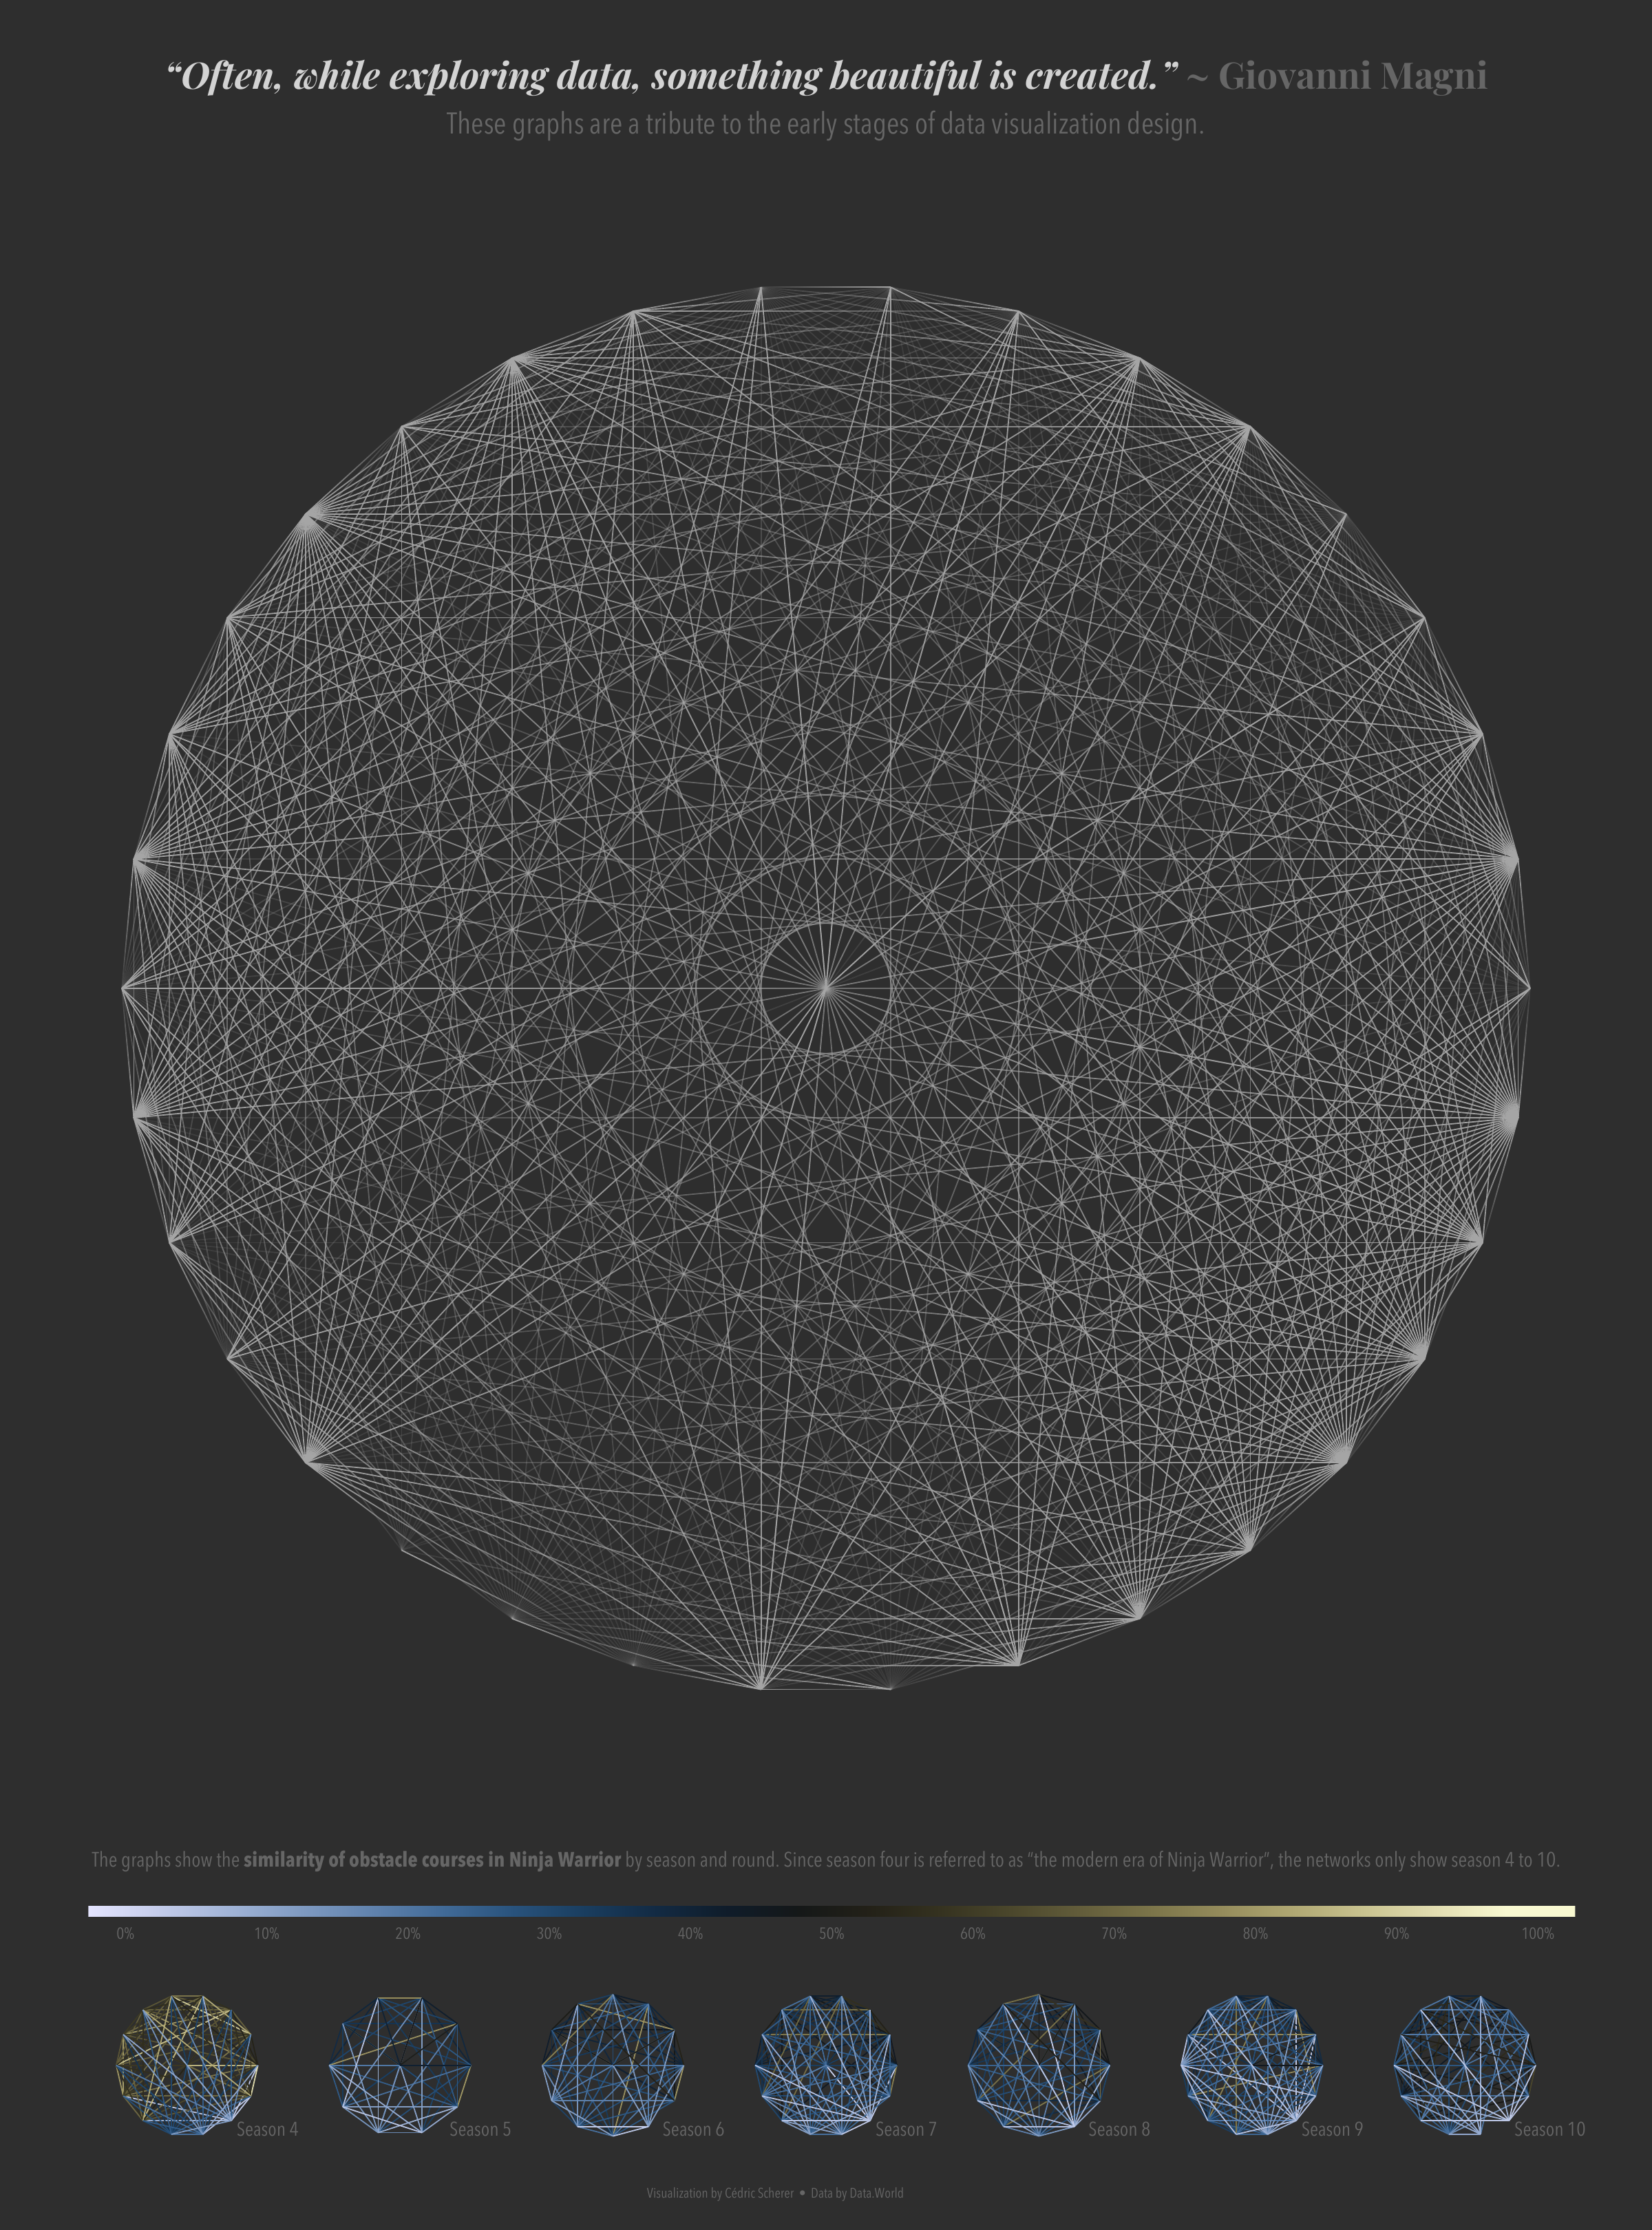
2020/51 🏋️ Ninja Warrior by Data.World
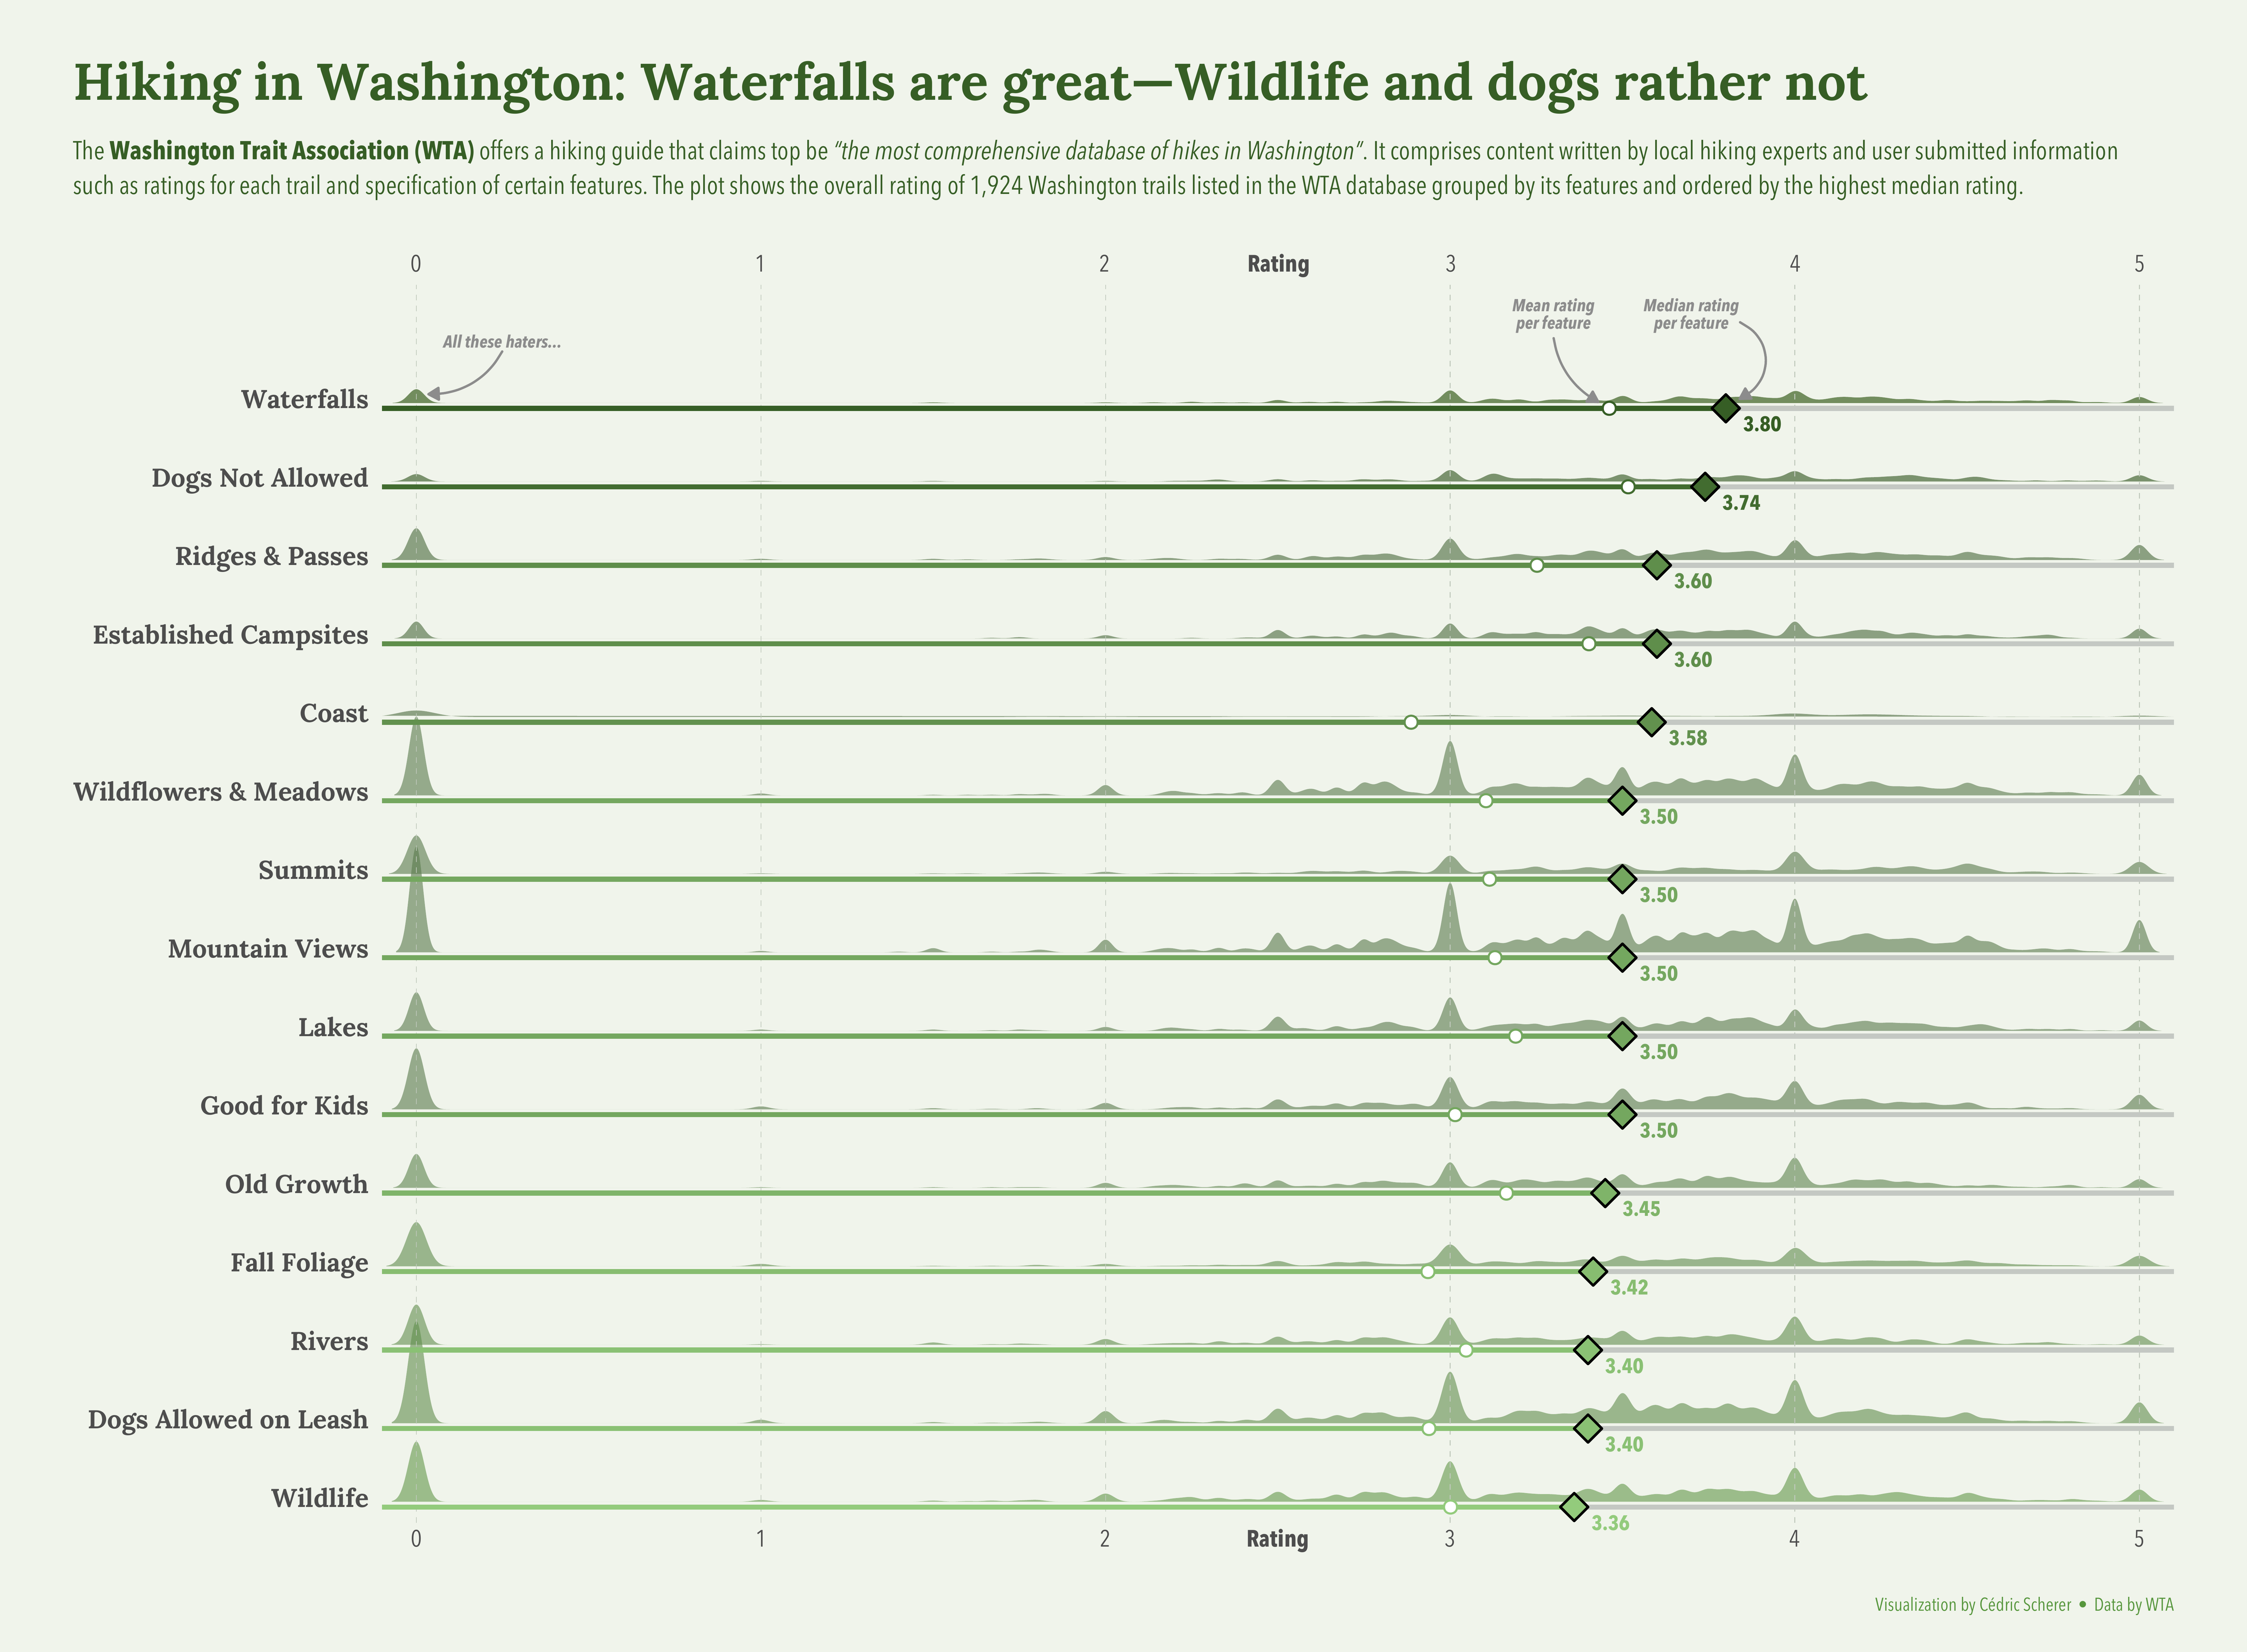
2020/48 🥾 Washington Trails by WAT
2020/46 📱 Historical Phones by OurWorldInData.org
2020/43 🍻 Great American Beer Festival by GABF
2020/44 🌬️ Canadian Wind Turbines by Government of Canada
2020/42 🦖 The Datasaurus Dozen by Alberto Cairo
2020/36 🌾 Global Crop Yields by Our World in Data
🔗 Have a look at the Shiny App in Action!
2020/41 🏀 NCAA Women's Basketball by FiveThirtyEight
2020/38 💊 Children Public Health Efforts by Urban Institute
2020/37 👯 FRIENDS Transcripts by Emil Hvitfeldt
2020/34 🌱 Extinct Plants by IUCN Red List
2020/33 ⚔️ Avatar: The Last Airbender by {appa}
![]()
2020/32 ⚡ European Energy by Eurostat
2020/31 🐧 Palmer Penguins by Gorman, Williams and Fraser (2014)
2020/30 😿 Australian Animal Outcomes by RSPCA
2020/29 👨🚀 Astronaut Database by Stavnichuk & Corlett (2020)
2020/28 ☕️ Coffee Ratings by Coffee Quality Institute
2020/27 🦸️ Uncanny X-Men by Claremont Run Project
2020/26 🦌️ Caribou Locations by Movebank
2020/25 🕊️ American Slavery and Juneteenth by U.S. Census
2020/23 🔴 Marble Races by Jelle's Marble Runs
Week 2020/22 🍹 50 Most Popular Cocktails 2020 by Drinks International & Kaggle
Week 2020/21 🏐 Beach Volleyball by BigTimeStats
Week 2020/20 🌋 Volcano Eruptions by Smithsonian
Week 2020/19 🐻 Animal Crossing by Metacritic
Week 2020/18 🎭️ Broadway Musicals (RTFM Edition) by Playbill
Week 2020/16 🎙️ Best Hip-Hop Songs of All Time by BBC Music
Week 2020/15 🚵 Tour de France via the {tdf} data package
Week 2020/14 🍺 Beer Production by TTB
Week 2020/12 🏢 The Office by IMDb via data.world
Week 2020/08 🍖 Foot Carbon Footprints by FAO via nu3
Week 2020/07 🛏️ Hotel Bookings by Antonio, Almeida & Nunes 2019
Week 2020/05 🌳 San Francisco Trees by data.sfgov.org
Week 2020/04 🎶 Spotify Songs by Spotify via {spotifyr}
Week 2020/03 🔑 Passwords by Knowledge Is Beautiful
Week 2020/02 🔥 Australian Fires by NASA FIRMS
Week 2020/01 ❄️️ White Christmas in Berlin by Deutscher Wetterdienst
Week 2019/38 🏞️ US National Park Visits by data.world
Week 2019/52 🎄 Christmas Songs by Billboard Top 100
Week 2019/51 🐩 Adoptable Dogs by Petfinder.com and ThePudding.com
Week 2019/50 🎤 Replicating Plots by Matt Daniels in R
Week 2018/33 🏥 Malaria by OurWorldInData.org
Week 2018/03 ⚱️ Global Mortality by OurWorldInData.org
Week 2019/44️ 🐿️ NYC Squirrels by Squirrel Census
Week 2019/42️ 🚘 Big Cars by EPA
Week 2019/40️ 🍕 Pizza Ratings by Jared Lander & Bartools Sports
Week 2019/39️ 🏫️ School Diversity by NCES
Week 2019/36️ 🖥️ Moore's Law by Wikipedia
Week 2019/35️ 💛 Simpsons Guest Stars by Wikipedia
Week 2019/34️ ☢️ Nuclear Explosions by SIPRI
Week 2019/33️ 🌿 Roman Emperors by Wikipedia
Week 2019/28️ ⚽ FIFA Women's World Cups by data.world
Week 2019/27️ 💰 Media Franchise Revenues by Wikipedia
Week 2019/25 🐦 Christmas Bird Counts by Bird Studies Canada
Week 2019/24 🌠 Meteorites by NASA
Week 2019/22 🍷️ Wine Ratings by Vivino
Week 2019/21️ 🚮 Global Plastic Waste by OurWorldInData.org
Week 2019/20 🎖️ Nobel Prize Winners by Harvard Dataverse
Week 2019/19️ 👨🏫 Global Student to Teachers Ratios by UNESCO's "eAtlas of Teachers"
Week 2019/18️ 🐥 Chicago Bird Collisions by Winger et al. 2019
Week 2019/16️ 📊 Data Viz Mistakes by The Economist
Week 2019/14️ 🚴 Seattle Bike Traffic by seattle.gov
Week 2019/17 🐉 Anime Data by MyAnimeList.net
