Wordops Dashboard Save
Dashboard for WordOps backend
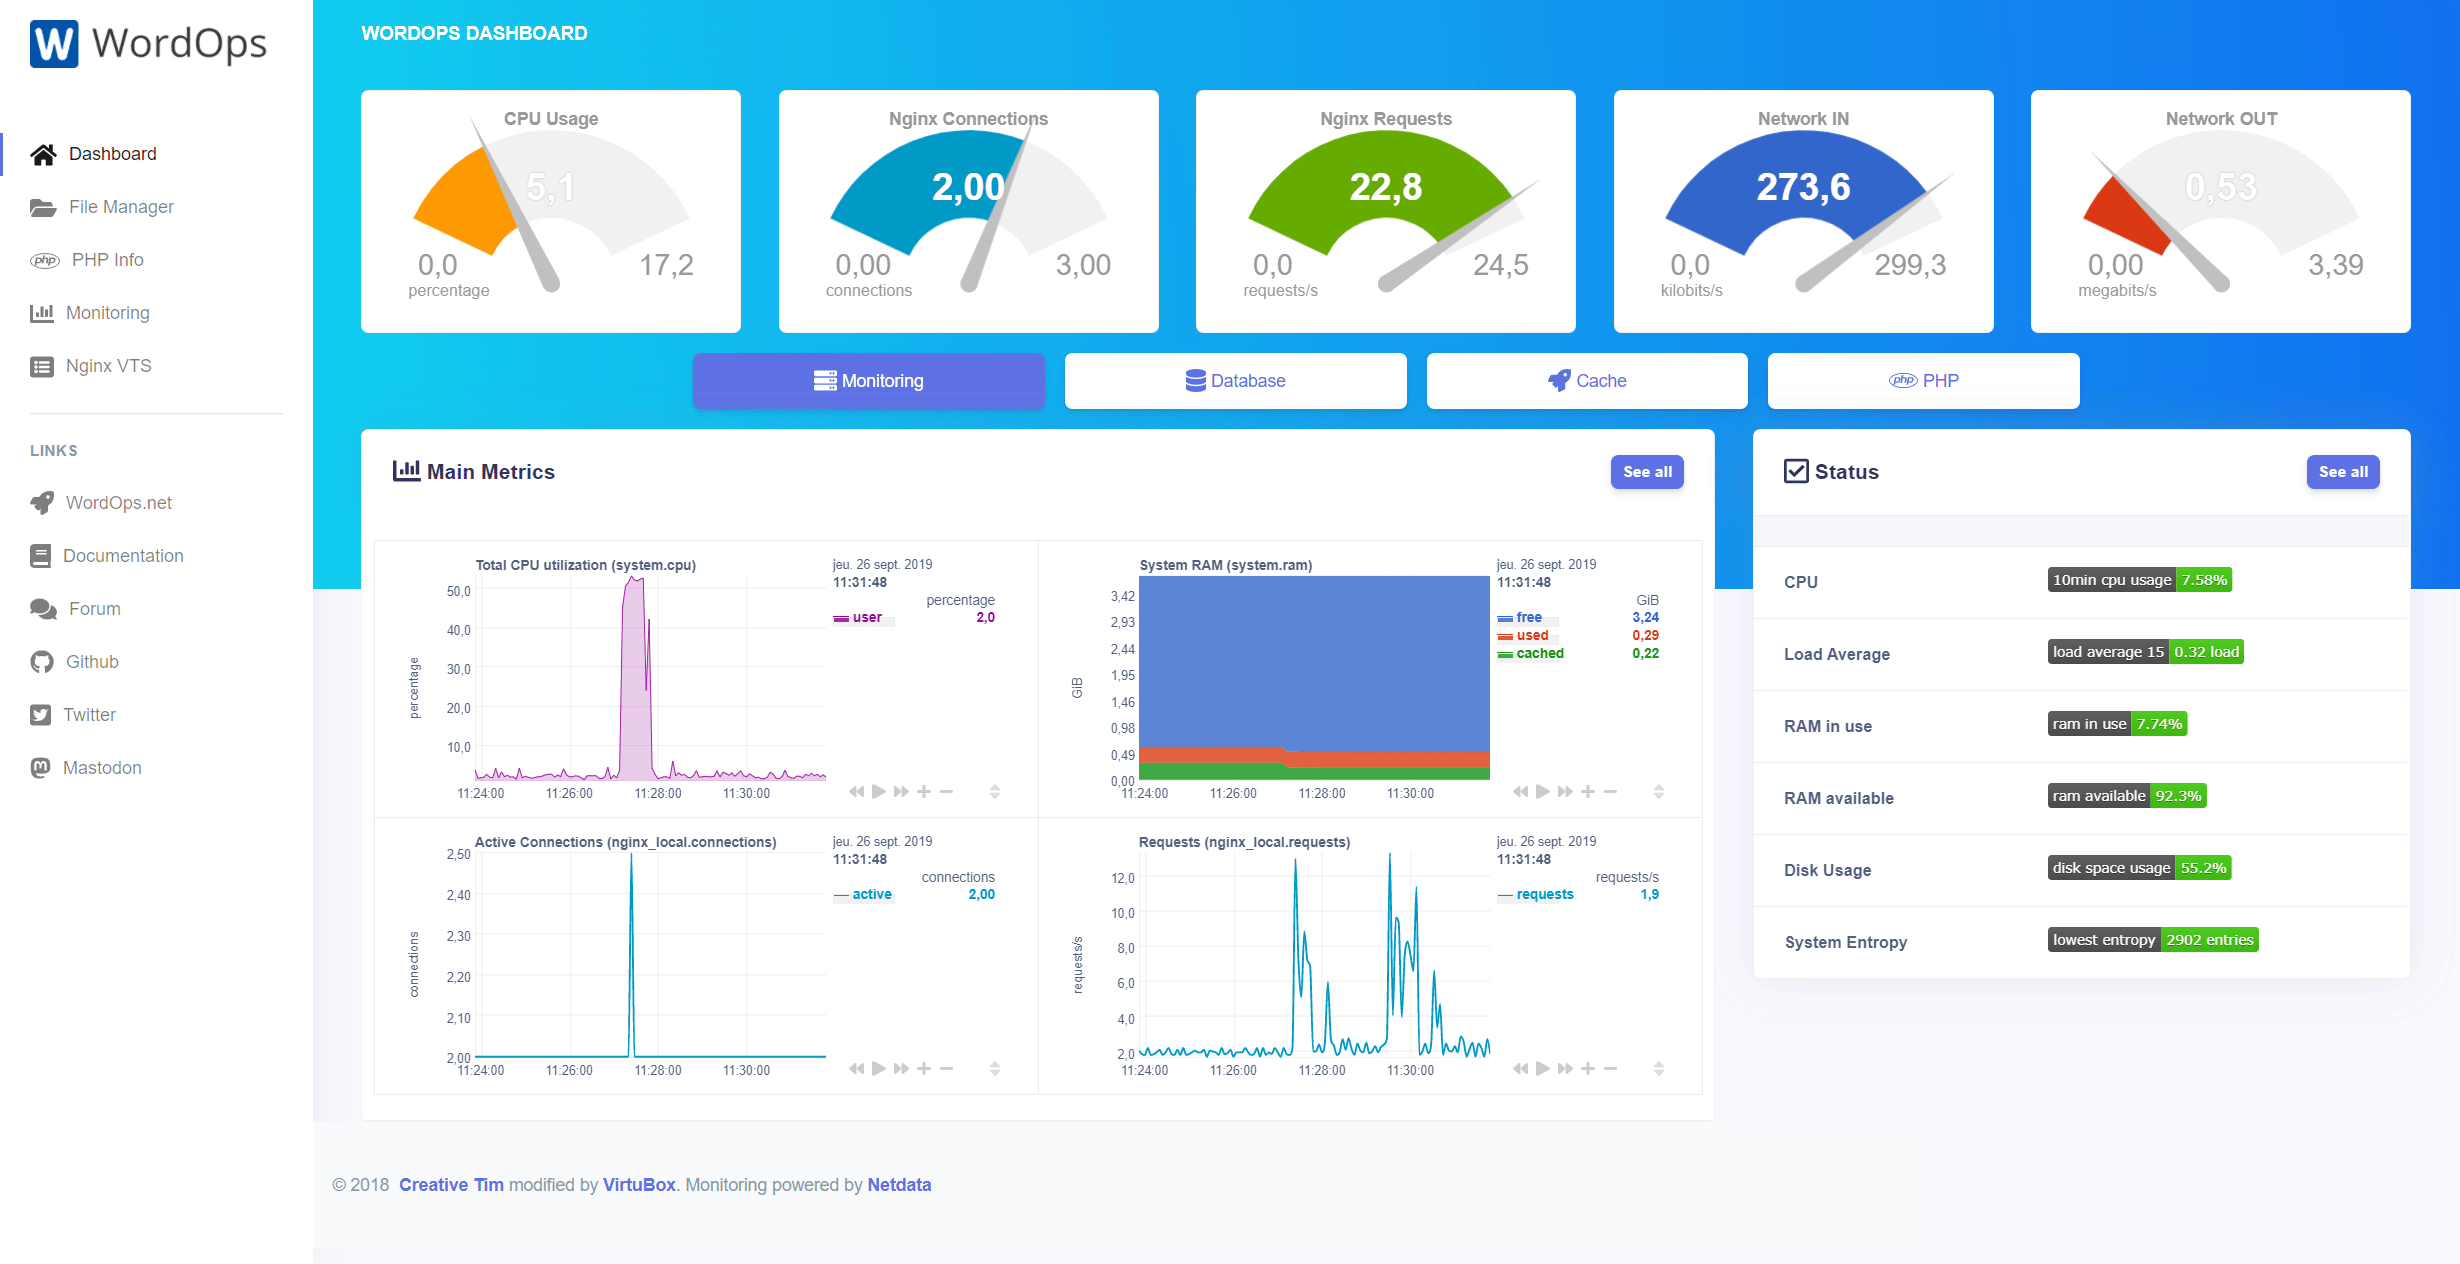
WordOps Dashboard
A clean Bootstrap dashboard for WordOps that show server metrics, Nginx current connection, requests and more powered by Netdata.
Features
Demo available on: demo.wordops.eu
- Real-time server metrics.
- One click access to various tools (Nginx VTS, phpMyAdmin, Adminer, phpRedisAdmin,... that can be installed with
wo stack installcommand) - Beautiful graph and gauge.
- Fast and clean.
Usage
Automatic
wo stack install --dashboard
wo stack install --netdata
Manual
Download and extract the archive in a directory :
curl -sL https://github.com/WordOps/wordops-dashboard/releases/download/v1.2/wordops-dashboard.tar.gz | tar -xzf - -C /path/you/want
Replace in the following line /netdata/ with the full and public address of your netdata instance :
<script type="text/javascript" src="/netdata/dashboard.js"></script>
Troubleshooting
Network interfaces meter are not displayed on the dashboard
If you network interface isn't named eth0, you just have to use the command ifconfig to find its name and to replace eth0 with the proper interface name in the dashboard index.php file. Example for a network interface named ens18:
sed -i 's/eth0/ens18/' /var/www/22222/htdocs/index.php
Build
The dashboard contains minified CSS, JS files that generated by Gulp build process. It's required to install Nodejs, Gulp and require package to build your own new CSS, JS files.
npm install # for the first time
gulp # or
gulp css # or
gulp js
Credits
Based on Argon dashboard template by Creative Tim.
Powered by Netdata Monitoring suite.
