Tracy Versions Save
Frame profiler
v0.10
6 months agoFor a more detailed change list, see https://github.com/wolfpld/tracy/blob/v0.10/NEWS.
System power usage
Under Linux, Tracy will now report how much power the system is using. The specifics of what is measured depends on what the hardware is capable of reporting.
Error markers removal
Zone error markers (red regions and error bars) have been removed to be consistent with how all other profiling events are displayed.
Major overhaul of how timeline items are processed in GUI

See https://wolf.nereid.pl/posts/how-tracy-faster/ if you are interested in more details.
Global configuration settings dialog
You can find it in the profiler's about menu (the wrench icon in the welcome dialog).
Trace description or filename is now displayed on the window title bar
History of viewed symbols
You can go back to previously displayed symbols in the symbol view. Currently the history granularity is at the symbol level.
Improvements in csvexport
You can now export messages and thread identifiers of zones.
GPU tracing improvements
Vulkan contexts can now use the VK_EXT_host_query_reset extension and Vulkan symbols can be dynamically loaded. The D3D11 and D3D12 instrumentation has been rewritten.
Support for running under rr
If you need to run a profiled application under the rr debugger, you can now use the TRACY_PATCHABLE_NOPSLEDS to make the instrumentation more efficient.
Custom program name support
You can now use the TracySetProgramName() macro to set a custom program name to be sent by the client. You may find this useful if you need to run the same executable in different roles, e.g. one executable would identify itself as a game server, the other as a game client, and so on.
v0.9.1
1 year agoFor a more detailed change list, see https://github.com/wolfpld/tracy/blob/v0.9.1/NEWS.
Source diff when comparing traces
Compare traces menu can now display source code differences between two traces.

Improvements to assembly listings
Listings are now annotated with source line information. To improve compatibility with external tools comments are now prefixed with '#' instead of ';'.

Histogram tooltip will now also show left/right counts.

Timeline handling improvements
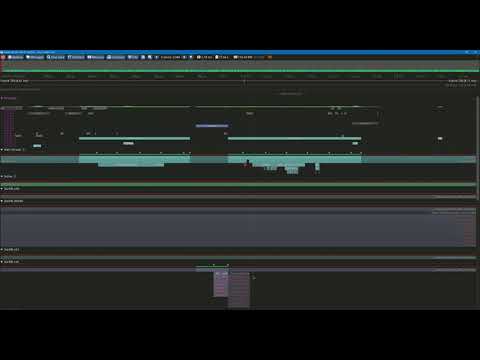
Tracy now actively manages timeline vertical scroll offset in order to keep the thread under the mouse cursor in the same place on screen.
See the following video:
Jump and call target queries
Tracy will now query jump and call target addresses. This enables discovery of target function names, even if such function has no samples and is not present in any call stack.
Instead of call 0x7ff61a5380c0 you will now more often see the following:

Native Wayland support
Tracy on Linux now targets and requires Wayland by default. Other platforms still use GLFW.
Pass LEGACY=1 parameter to make, if you want to instead rely on the GLFW library, like before.
Please don't ask about window decorations on Gnome. Current behavior is the intended behavior. Gnome does not want windows to have decorations, and Tracy respects this choice. If you find this problematic, use a desktop environment that actually listens to its users.
Privilege warning
Added warning when the profiler interface is run with privilege elevation. Advice is given to instead run the client with admin rights.

v0.9
1 year agoFor a more detailed change list, see https://github.com/wolfpld/tracy/blob/v0.9/NEWS.
Breaking changes
- All the header and source files used for integrating Tracy with applications were moved to the
public/directory. This will break your integration!- To fix this, update the source and include directories lists to point to the new location.
- Tracy include files directly referenced by the client were moved to
tracy/subdirectory, to facilitate setups which previously had Tracy checkout parent directory in the include paths list (i.e. when you included"tracy/Tracy.hpp"). - Previously, if you have included the Tracy checkout directory in your project include directories list (i.e. you could include
"Tracy.hpp"), this could result in third-party library conflicts, e.g. with ImGui. Such scenarios are no longer the case.
- Tracy macros now require to be terminated with a semicolon.
- The undocumented
___tracy_demangle()function API has been changed. Please refer to the source code for further instructions. - The parameter callback and its registration macro have been extended to include user data pointer. You will need to update your code accordingly.
- The API for
TracyPlotConfig()macro has been changed. Please refer to the manual to see how you can fix this.
Plots visualization improvements
- Each plot now has its own color, which can also be defined by the user.
- The area below the plot is now optionally filled with a color.
- Plots can now also be configured to be staircase instead of smooth. This new setting is appropriate for many inputs where only discrete values make sense, e.g. the memory allocation plot.

Frame time target
The range of frame bar colors in the frames overview on top of the screen can be now controlled with the "Target FPS" entry box in the options menu.

Zone name shortening
Previously zone name shortening supported only namespace removal, in a way that didn't consider function parameters or template arguments. The new shortening rules first perform normalization of the function name:
- The function const qualifier is removed.
- Common return types are removed.
- All function parameters and all template arguments are removed.
The next steps consist of repeated removal of namespaces, starting with the most outermost one. While the old process was all or nothing, the new implementation by default will dynamically adjust to the space available, trying to show the most context possible.
Previously shortening was only applied to the zone names displayed on the timeline. Currently this process will also apply to all other places in the UI where function names are displayed.

Path normalization
Symbol file paths are now normalized on libbacktrace systems. For example, instead of /usr/bin/../lib64/gcc/x86_64-pc-linux-gnu/12.2.0/../../../../include/c++/12.2.0/bits/std_mutex.h Tracy will now report such file as /usr/include/c++/12.2.0/bits/std_mutex.h.
Symbol view improvements
- Assembly view is now in color.

- Added microarchitecture data for Zen 4.
- Implemented optional propagation of inline cost down the local call stack. This feature may be useful when trying to get a general outlook of the cost at the top-level function in the symbol. On the image below notice that in the inserted fragment, which has this option enabled, the hidden cost of
ring.GetTail()is attributed to the calling line.

- Reversed mouse button assignments for jumping to source / assembly line in symbol view. The left mouse button will now focus the target line.
- Assembly lines tooltip will now display local call stack of inline functions (within the symbol).

- Right-clicking the source location entry in assembly line will show the local call stack, along with source code preview of each entry and ability to navigate to any selected inline function.

Various improvements
- If a client with an incompatible protocol is discovered, Tracy will now try to show which versions can be used to handle the connection.

- Messages list in zone info window can now show messages exclusive to the zone, filtering out the messages emitted from child zones.
- Added capture of vertical synchronization timings on Linux.
- Added context menu for timeline labels. Currently the only option is to hide the selected thread, plot, etc.
- You can now provide custom source file contents through a profiler callback. This enables profiler access to files contained in your custom data files, etc.

- Timeline can be now navigated with WASD keys.
- The import-chrome utility interprets Instant (
i/I) events where thenamefield contains the wordframeas a frame event. Thenameis the frame set name. - The profiler UI will no longer unnecessarily redraw the screen if nothing was changed. This should have a profound impact on power usage.
- Available clients now also broadcast their PID.
- The profiler UI will now indicate that it needs attention if the window is not focused and something interesting happens. For example when a connection is established, or when a saved trace finishes loading, etc.
v0.8.2
1 year ago- Added support for debuginfod debug information services. Note that since this depends on proper system configuration, vendors providing the debug information, and network retrieval, it is disabled by default. To enable, compile the profiled application with the
TRACY_DEBUGINFODdefine and link with libdebuginfod. - When Tracy server-side utilities are build with MSVC, the required libraries will be now automatically retrieved and built with vcpkg.
- Added microarchitecture data for: Bonnell, Airmont, Goldmont, Goldmont Plus, Tremont.
- Recognize additional CPUIDs of Zen 3, Alder Lake, Ice Lake microarchitectures.
- Assembly line width will be now extended, if needed. Previously the line width was calculated for the initial layout and changing amount of displayed data (especially listing the read/written registers) didn't affect this, which may have made some lines partially unreadable.
- Added ability to filter call stacks in memory tab by inactive allocations. Filtering by inactive allocations helps to pinpoint wasteful allocations in the program.

- Plot graph will no longer display min/max values interpolated for animation, but rather true values.
- The CPU topology tree structure was replaced by a CPU schematic showing the same thing in a more concise way.


v0.8.1
2 years ago- Support for pre-0.7 traces has been dropped.
- Update utility can now scan for source files missing in the trace cache, if the '-c' parameter is given. Found files will be added to the cache.
- Added high-priority queue for fast queries to bypass slow symbol queries.
- Fixed Android documentation to show how to enable context switch tracing.
- Workaround MSVC 2015 stupidity which prevented compilation as C++11.
- Added support for showing branch cost data for CPUs that don't report branch retirement events (but do report branch misses).
- The right-click context menu available for jump arrows in the symbol view window will now additionally display jump context, i.e. jump sources and jump target source code fragments.
- Added freedesktop.org compliant desktop entry and MIME type definition.
- The call stack column in list of messages will now be only displayed when at least one message on the list has call stack data.
- File dialogs on Unix will be now native to the desktop environment you are using. Note that this relies on xdg-desktop-portal and dbus.
v0.8
2 years agoSee the following video for a summary of changes:
v0.7.8
2 years agoFor a more detailed change list, see https://github.com/wolfpld/tracy/blob/v0.7.8/NEWS.
Child call times
Time spent in child function calls can be now optionally displayed in the symbol view window. Due to how programs are structured, time will be attributed to the next instruction (where the call will return).

General improvements to symbol view
Jump targets (typically out of screen) can be now also seen in tooltips.

Register access color codes are explained in tooltips.

Save options
When saving a trace you will be now able to select compression parameters. Previously this was only available through the update utility.

New GPU instrumentation options
- Vulkan contexts can be now calibrated on Linux.
- Direct3D 11 instrumentation is now supported.
Improvements to chrome tracing import
- Tracy can now import chrome traces compressed with Zstd.
- Custom source location tags are supported.
- Support for multiple PIDs has been added.

v0.7.7
3 years agoFor a more detailed change list, see https://github.com/wolfpld/tracy/blob/v0.7.7/NEWS.
Number of entry call stacks
Each sampled assembly line has a number of entry call stacks (unique execution paths leading to the instruction) assigned to it. This was previously accessible through the "sample entry call stacks" window, and it is now more exposed in a tooltip, along with a reminder which should increase discoverability of the aforementioned window.

Note: Entry call stacks were previously named "parent call stacks".
Source code preview
Source code contents will now have preview tooltips in various places in the UI. Keep in mind it's possible that the displayed source code might not be up-to-date. Please consult the user manual for the usual caveats.

v0.7.6
3 years agoFor a more detailed change list, see https://github.com/wolfpld/tracy/blob/v0.7.6/NEWS.
Executable timestamp
Timestamp of the profiled program is now stored in the capture.

Naming GPU contexts
Custom GPU context names can be now set through the Tracy*ContextName() macros.

Client-side source file transfer
Source file discovery and caching is now also performed on the client side, giving you insight into sources on remote hosts, without the need to manually copy them.
Updated libbacktrace
Most notably this fixes crashes due to memory corruption on macOS. Various other improvements were also made.
v0.7.5
3 years agoTracy Profiler 0.7.5
For a more detailed change list, see https://github.com/wolfpld/tracy/blob/v0.7.5/NEWS.
New tables UI
Tables displayed by Tracy can now have their columns reordered, hidden, or sorted both in ascending and in descending order (within reason). The column configuration is preserved between profiler sessions.

Chrome importer improvements
The chrome tracing importer will now properly set the trace name, which will be displayed on the profiler's title bar. Thread names, if present in the original capture, will also be converted.
Compatibility and bug fixes
Robustness of the profiler was increased by fixing some issues which previously flew under the radar, for example:
- System tracing on Android is now working in more software configurations.
- Localhost-only clients are now properly broadcasting their presence.
- Call stacks are now properly transferred for Vulkan events.
- OpenCL events will be now properly captured if some zones are inactive, or if the application was build without assert checks.
- The order of bytes in ARM machine code printout will now match the one printed by objdump.