Tachymeter Save Abandoned
A Go library for timing things and yielding rates, percentiles, and histograms

tachymeter
Tachymeter captures event timings and returns latency and rate statistics: "In a loop with 1,000 database calls, what was the 95%ile and lowest observed latency? What was the per-second rate?"
Tachymeter stores data in a lossless sliding window. This means it's accurate but take o(n) space in relation to the desired sample size.
Examples
Code examples. Tachymeter is also suitable for general purpose use, such as load testing tools.
Usage
After initializing a tachymeter, event durations in the form of time.Duration are added using the AddTime(t time.Duration) call. Once all desired timing have been collected, the data is summarized by calling the Calc(), returning a *Metrics). *Metrics fields can be accessed directly or via other output methods.
import "github.com/jamiealquiza/tachymeter"

func main() {
    // Initialize a tachymeter with a sample window
    // size of 50 events.
    t := tachymeter.New(&tachymeter.Config{Size: 50})

    for i := 0; i < 100; i++ {
        start := time.Now()
        doSomeWork()
        // We add the time that
        // each doSomeWork() call took.
        t.AddTime(time.Since(start))
    }

    // The timing summaries are calculated
    // and printed to console.
    fmt.Println(t.Calc())
}
50 samples of 100 events
Cumulative:	671.871ms
HMean:		125.38µs
Avg.:		13.43742ms
p50: 		13.165ms
p75:		20.058ms
p95:		27.536ms
p99:		30.043ms
p999:		30.043ms
Long 5%:	29.749ms
Short 5%:	399.666µs
Max:		30.043ms
Min:		4µs
Range:		30.039ms
StdDev:		8.385117ms
Rate/sec.:	74.42
Output Descriptions
-
Cumulative: Aggregate of all sample durations. -
HMean: Event duration harmonic mean. -
Avg.: Average event duration per sample. -
p<N>: Nth %ile. -
Long 5%: Average event duration of the longest 5%. -
Short 5%: Average event duration of the shortest 5%. -
Max: Max observed event duration. -
Min: Min observed event duration. -
Range: The delta between the max and min sample time -
StdDev: The population standard deviation -
Rate/sec.: Per-second rate based on cumulative time and sample count.
Output Methods
Tachymeter output is stored in two primary forms:
- A
*Metrics, which holds the calculated percentiles, rates and other information detailed in the Output Descriptions section - A
*Histogramof all measured event durations, nested in theMetrics.Histogramfield
t represents a tachymeter instance. Calling t.Calc() returns a *Metrics. Metrics and the nested Histogram types can be access in several ways:
Metrics: raw struct
metrics := t.Calc()
fmt.Printf("Median latency: %s\n", metrics.Time.P50)
Output:
Median latency: 13.165ms
Metrics: JSON string
fmt.Printf("%s\n\", metrics.JSON())
Output:
{"Time":{"Cumulative":"671.871ms","HMean":"125.38µs","Avg":"13.43742ms","P50":"13.165ms","P75":"20.058ms","P95":"27.536ms","P99":"30.043ms","P999":"30.043ms","Long5p":"29.749ms","Short5p":"399.666µs","Max":"30.043ms","Min":"4µs","Range":"30.039ms","StdDev":"8.385117ms"},"Rate":{"Second":74.41904770409796},"Samples":50,"Count":100,"Histogram":[{"4µs - 3.007ms":5},{"3.007ms - 6.011ms":4},{"6.011ms - 9.015ms":10},{"9.015ms - 12.019ms":6},{"12.019ms - 15.023ms":7},{"15.023ms - 18.027ms":3},{"18.027ms - 21.031ms":4},{"21.031ms - 24.035ms":3},{"24.035ms - 27.039ms":3},{"27.039ms - 30.043ms":5}]}
Metrics: pre-formatted, multi-line string
fmt.Println(metrics)
Output:
50 samples of 100 events
Cumulative:	671.871ms
HMean:		125.38µs
Avg.:		13.43742ms
p50: 		13.165ms
p75:		20.058ms
p95:		27.536ms
p99:		30.043ms
p999:		30.043ms
Long 5%:	29.749ms
Short 5%:	399.666µs
Max:		30.043ms
Min:		4µs
Range:		30.039ms
StdDev:		8.385117ms
Rate/sec.:	74.42
Histogram: text
The Histogram.String(int) method generates a text version of the histogram. Histogram bar scaling is specified with width int.
fmt.Println(metrics.Histogram.String(25))
Output:
       4µs - 3.007ms -----
   3.007ms - 6.011ms ---
   6.011ms - 9.015ms ---------------
  9.015ms - 12.019ms -------
 12.019ms - 15.023ms ---------
 15.023ms - 18.027ms -
 18.027ms - 21.031ms ---
 21.031ms - 24.035ms -
 24.035ms - 27.039ms -
 27.039ms - 30.043ms -----
Histogram: HTML
A Histogram can be written as HTML histograms. The Metrics.WriteHTML(p string) method is called where p is an output path where the HTML file should be written.
err := metrics.WriteHTML(".")
Output:
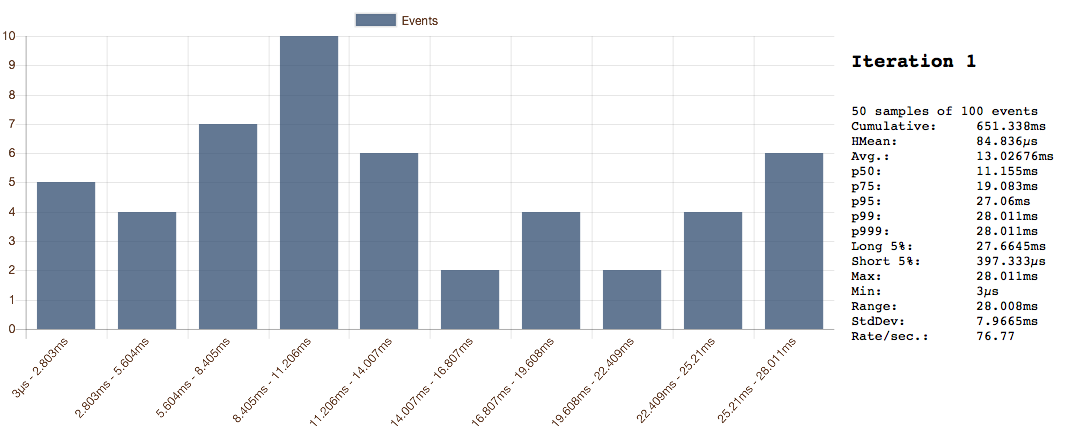
Tachymeter also provides a Timeline type that's used to gather a series of *Metrics (each *Metrics object holding data summarizing a series of measured events). *Metrics are added to a *Timeline using the AddEvent(m *Metrics) method. Once the desired number of *Metrics has been collected, WriteHTML can be called on the *Timeline, resulting in an single HTML page with a histogram for each captured *Metrics. An example use case may be a benchmark where tachymeter is used to summarize the timing results of a loop, but several iterations of the loop are to be called in series. See the tachymeter-graphing example for further details.
Configuration
Tachymeter is initialized with a Size parameter that specifies the maximum sample count that can be held. This is done to set bounds on tachymeter memory usage (since it's a lossless storage structure). The AddTime method is o(1) and typically sub-microsecond modern hardware. If the actual event count is smaller than or equal to the configured tachymeter size, all of the measured events will be included in the calculated results. If the event count exceeds the tachymeter size, the oldest data will be overwritten. In this scenario, the last window of Size events will be used for output calculations.
Accurate Rates With Parallelism
By default, tachymeter calculates rate based on the number of events possible per-second according to average event duration. This model doesn't work in asynchronous or parallelized scenarios since events may be overlapping in time. For example, with many Goroutines writing durations to a shared tachymeter in parallel, the global rate must be determined by using the total event count over the total wall time elapsed.
Tachymeter exposes a SetWallTime method for these scenarios.
Example:
<...>

func main() {
    // Initialize tachymeter.
    c := tachymeter.New(&tachymeter.Config{Size: 50})

    // Start wall time for all Goroutines.
    wallTimeStart := time.Now()
    var wg sync.WaitGroup

    // Run tasks.
    for i := 0; i < 5; i++ {
        wg.Add(1)
        go someTask(t, wg)
    }

    wg.Wait()

    // When finished, set elapsed wall time.
    t.SetWallTime(time.Since(wallTimeStart))

    // Rate outputs will be accurate.
    fmt.Println(t.Calc().String())
}

func someTask(t *tachymeter.Tachymeter, wg *sync.WaitGroup) {
    defer wg.Done()
    start := time.Now()

    // doSomeSlowDbCall()

    // Task we're timing added here.
    t.AddTime(time.Since(start))
}

<...>
