Streamlit Observable Save
Embed Observable notebooks into Streamlit apps!
streamlit-observable
Embed Observable notebooks into Streamlit apps!
Why tho
There are hundreds of Observable notebooks at observablehq.com that create beautiful data visualizations, graphs, charts, maps, and animations. With streamlit-observable, you can inject your own data, configuration, and styling into these notebooks, and listen to cell value updates for passing data back into Streamlit!
Install
pip install streamlit-observable
Usage
Check out the example Streamlit app to see a ton of in-depth examples! Below are some rough code examples to get a rough idea of how to use streamlit-observable.
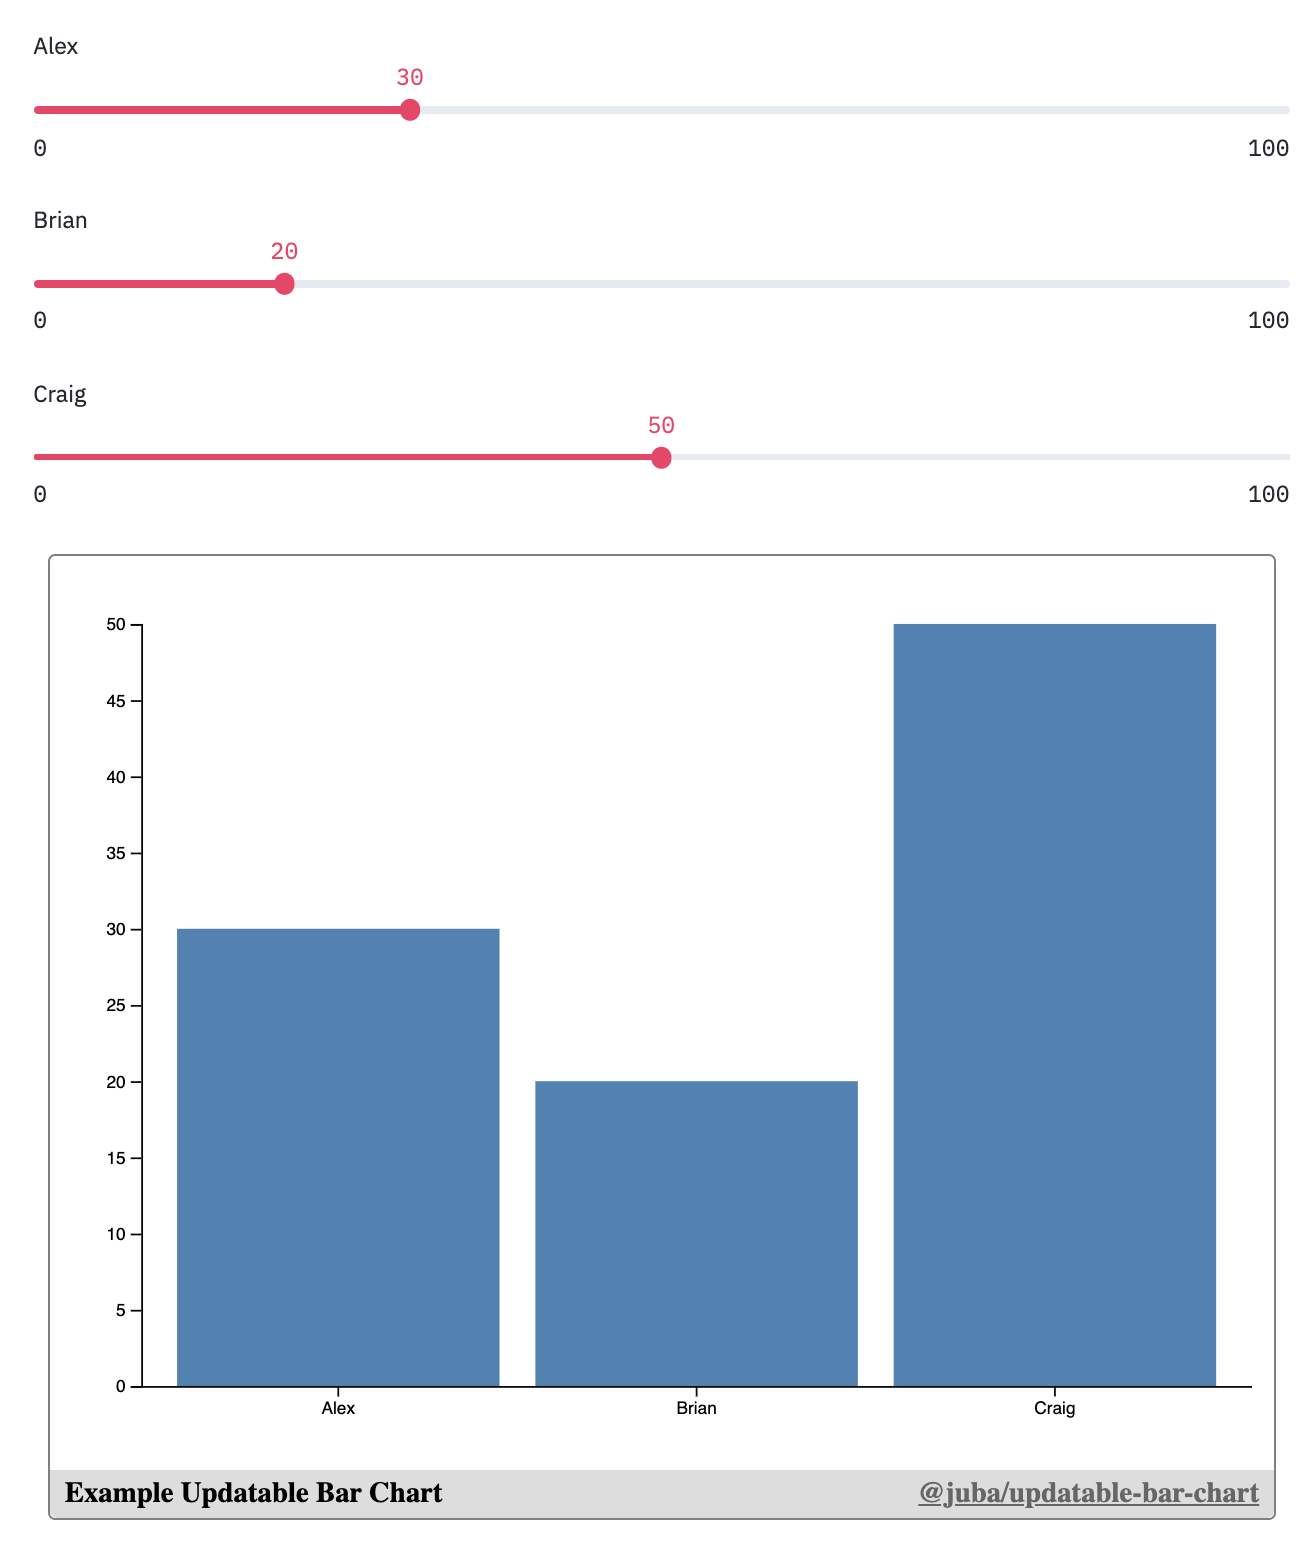
Embed Bar Chart
import streamlit as st
from streamlit_observable import observable

a = st.slider("Alex", value=30)
b = st.slider("Brian", value=20)
c = st.slider("Craig", value=50)

observable("Example Updatable Bar Chart",
    notebook="@juba/updatable-bar-chart",
    targets=["chart", "draw"],
    redefine={
        "data": [
            {"name": "Alex", "value": a},
            {"name": "Brian", "value": b},
            {"name": "Craig", "value": c}
        ],
    },
    hide=["draw"]
)
Trader Joes Voronoi Map
import streamlit as st
from streamlit_observable import observable

@st.cache
def get_trader_joes():
    # a lot of code...
    return df

df = get_trader_joes()

observable("Trader Joes Voronoi Map",
    notebook="@mbostock/u-s-voronoi-map-o-matic",
    targets=["map"],
    redefine={
        "data": df[["longitude", "latitude", "name"]].to_dict(orient="records")
    }
)

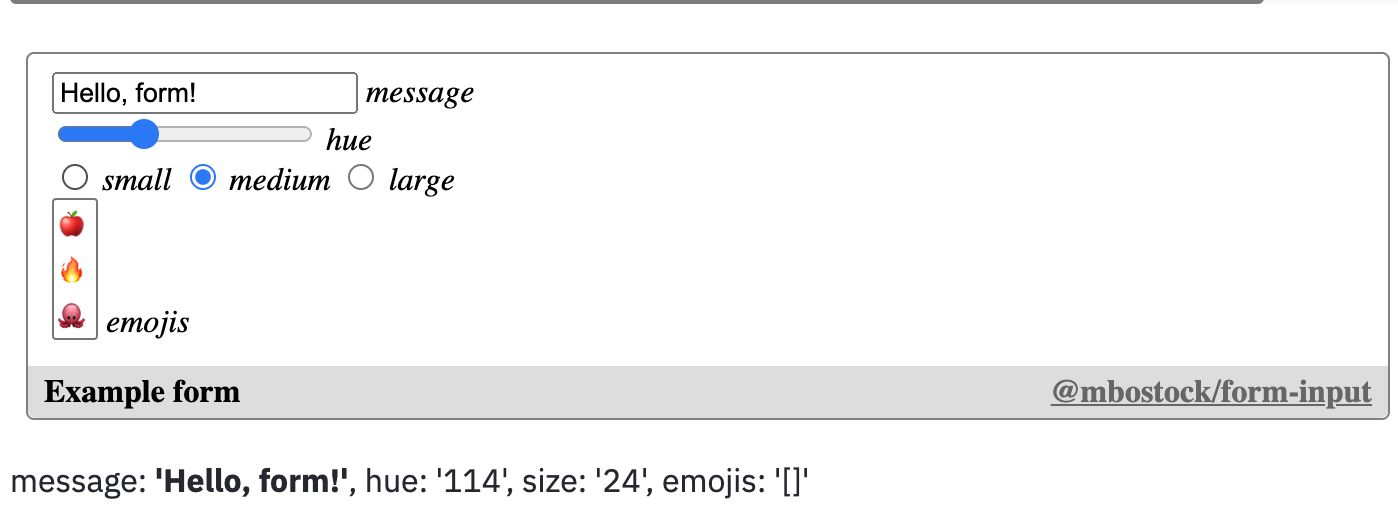
Form Input Example
import streamlit as st
from streamlit_observable import observable

observers = observable("Example form",
    notebook="@mbostock/form-input",
    targets=["viewof object"],
    observe=["object"]
)

o = observers.get("object")

if o is not None:
    st.write("message: **'{message}'**, hue: '{hue}', size: '{size}', emojis: '{emojis}'".format(
        message=o.get("message"),
        hue=o.get("hue"),
        size=o.get("size"),
        emojis=str(o.get("emojis"))
    ))
Selecting U.S. Counties
import streamlit as st
from streamlit_observable import observable

observers = observable("County Brush",
    notebook="d/4f9aa5feff9761c9",
    targets=["viewof countyCodes"],
    observe=["selectedCounties"]
)

selectedCounties = observers.get("selectedCounties")

API Reference
observable(key, notebook, targets=None, observe=[], redefine={}, hide=[])
Embed an Observable notebook into the Streamlit app. If any cells are passed into observe, then this will return a dict, where the keys are the name of the cells that are being observed, and the values are the values of those cells.
-
key: A unique string used to avoid re-renders of the iframe. This label will appear at the bottom of the embed. -
notebook: The observablehq.com notebook id to embed. Ex. "@"d3/bar-chart" or "d/1f434ef3b0569a00" -
targets: An optional list of cell names to render in the embeded notebook. By default, all cells, including unnamed cells, will be embeded. -
observe: An optional list of cell names to observe. When those cells are updated in the Observable notebook, the new values will be sent back to Streamlit as part of the return value. Keep in mind, there is a serialization process from going from Observable notebook JavaScript -> Streamlit Python (JSON serializing). -
redefine: An optional dict of cell names and values used to redefine in the embeded notebook. Keep in mind, there is a serialization process from going from Streamlit Python -> Observable notebook JavaScript (JSON serializing). -
hide: An optional list of cell names that will not be rendered in the DOM of the embed. Useful for side-effect logic cells, likemousein https://observablehq.com/@mbostock/eyes.
Caveats
Redefining or Observing Cells need to be JSON-serializable
In order to pass data from Python into an Observable notebook (with redefine), it needs to be JSON serializable, usually a list, dict, string or number. So if you're working with a pandas DataFrame or numpy array, you may need to wrangle it before redefining (usually with something like panda's .to_dict() or numpy's .tolist()).
Similarly, when passing data from an Observable notebook back into Streamlit/Python (with observe), that data also needs to be JSON serializable. So when passing back Date objects, Sets, or other custon objects, you'll first need to represent it in some JSON serializable way, then wrangle it in Python-land to match what you expect. For example, with a Date object, you could convert to to the JSON-friendly Unix Epoch (number) with .getTime(), then read it as a datetime object in Python with datetime.fromtimestamp(time / 1000).
Accessing webcam and microphone doesn't work
Not entirely sure why this is the case, but if someone figures it out, I'd love to see a PR!
Large Data is Hard
I haven't tried this, but I expect that if you try loading 1GB+ of data into a bar chart, something will break. All the data that you redefine will be read in memory in your browser when embeding into the chart, so something might break along the way. If you ever come across this, feel free to open an issue about it!
You'll need to fork a lot
Most Observable notebooks are built with only other Observable users in mind. Meaning, a lot of cells are exposed as custom Objects, Dates, functions, or classes, all of which you can't control very well in Python land. So, you may need to fork the notebook you want in Observable, make changes to make it a little friendlier, then publish/enable link-sharing to access in Streamlit. Thankfully, this is pretty quick to do on Observable once you get the hang of it, but it does take extra time.
