Stock Volatility Google Trends Save
Deep Learning Stock Volatility with Google Domestic Trends: https://arxiv.org/pdf/1512.04916.pdf
Deep Learning Stock Volatility with Google Domestic Trends
Tensorflow/Keras implementation of the [paper].
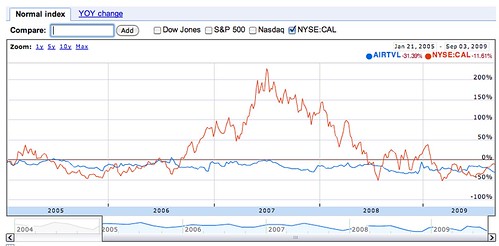
Trend displayed in Google Domestic Trends
Status?
Work accomplished so far:
- End-to-end implementation
- Test the data workflow pipeline
- Sanity check of the model
- Train the models
- Reproduction of the results in the paper
Plot

MAPE of the train, val and test along with dummy (benchmark future value = last value)
A new predictor is added every 600 epochs. We start with only the historical volatility as a predictor. Then, at 600 epochs, the second predictor is added: returns. At 1200, we had Trend COMPUT, 1800 Trend CRCARD, 2400 Trend INVEST and so forth.
We realized that we started to overfit after more than 5 predictors. The dataset is indeed incredibly small.
The lowest model MAPE loss on the test set coincide with the lowest MAPE loss on the validation set. They both have a comparable value (around 25), in agreement with the results found in the paper.
As a summary, the 5 best predictors are:
- sigma (volatility)
- returns
- Trend COMPUT
- Trend CRCARD
- Trend INVEST
As a conclusion, I'm a bit curious to know how they trained a model with 30 predictors on a such tiny dataset. They don't mention any information related to the model. It's just composed of a LSTM layer. I'm also a bit skeptical about this approach in general.
How to run it?
# might require python3.6.
git clone https://github.com/philipperemy/stock-volatility-google-trends.git svgt
cd svgt
pip3 install -r requirements.txt
python3 run_model.py
