Shinipsum Save
Lorem-Ipsum-like Helpers for fast Shiny Prototyping
![]()
![]()
![]()
shinipsum 
The goal of {shinipsum}is to provide random shiny elements for easiest
shiny app prototyping, so that you can focus on building the frontend
before building the backend.
The full documentation can be found on the {pkgdown}site:
https://thinkr-open.github.io/shinipsum/
Installation
You can install the dev version of shinipsum from GitHub with:
install.packages("shinipsum")
About
You’re reading the doc about version : 0.0.0.9000
This README has been compiled on the
Sys.time()
#> [1] "2023-03-27 11:19:38 CEST"
Here are the test & coverage results :
devtools::check(quiet = TRUE)
#> ══ Documenting ═════════════════════════════════════════════════════════════════
#> ℹ Installed roxygen2 version (7.2.3) doesn't match required (7.1.1)
#> ✖ `check()` will not re-document this package
#> ── R CMD check results ─────────────────────────────── shinipsum 0.0.0.9000 ────
#> Duration: 18.4s
#>
#> ❯ checking top-level files ... NOTE
#>   Non-standard file/directory found at top level:
#>     ‘README.html’
#>
#> ❯ checking dependencies in R code ... NOTE
#>   Namespace in Imports field not imported from: ‘utils’
#>     All declared Imports should be used.
#>
#> 0 errors ✔ | 0 warnings ✔ | 2 notes ✖
covr::package_coverage()
#> shinipsum Coverage: 97.91%
#> R/example.R: 44.44%
#> R/Table.R: 96.97%
#> R/Plot.R: 99.29%
#> R/DataTable.R: 100.00%
#> R/dygraphs.R: 100.00%
#> R/Image.R: 100.00%
#> R/LinearModel.R: 100.00%
#> R/Print.R: 100.00%
#> R/Text.R: 100.00%
#> R/utils.R: 100.00%
Demo
Available examples:
library(shinipsum)
ipsum_examples()
#> [1] "01_navbar.R"
You can run {shinipsum} demos with:
shiny::runApp(
  ipsum_examples("01_navbar.R")
)
Available ipsums :
Note: {shinipsum} only load functions which are necessary to its internal job. If you want to customise an output or to use a renderXX / XXOutput, you’ll need to explicitely load the packages needed (for example, if you want to customise a dygraph, a ggplot, or use ggplotly).
DataTable
random_DT takes 4 args :
-
nrow&ncol: number of row and columns of the table -
type: random, numeric, character, numchar - the type of the columns -
...: args to be passed toDT::datatable
Image
random_image returns a random image.
Plot
random_ggplot takes one arg :
-
type: Can be any of “random”, “point”, “bar”, “boxplot”,“col”, “tile”, “line”, “bin2d”, “contour”, “density”, “density_2d”, “dotplot”, “hex”, “freqpoly”, “histogram”, “ribbon”, “raster”, “tile”, “violin” and defines the geom of the ggplot. Default is “random”, and chooses a random geom for you.
Default theme is minimal.
As the return object is a ggplot, it can be enhanced like any other
ggplot with +.
library(ggplot2)
random_ggplot(type = "col") +
  labs(title = "Random plot") +
  theme_bw()
random_ggplotly calls the ggplotly function on a random_ggplot.
Dygraph
random_dygraph returns a random dygprah. It takes one arg:
-
...: arguments which are passed to thedygraph()function.
As the return object is a dygraph, it can be enhanced like any other
dygraph.
library(dygraphs)
random_dygraph()  %>%
  dyRangeSelector()
random_print takes one arg:
-
type: can be any of"character", "numeric", "model", "table", and defines the type of print. Default is"character".
Table
random_table takes three args : nrow, ncols and type. See
random_DT.
Text
random_text takes one of these two args:
-
nchar: lorem ipsum ofncharcharacters -
nwords: lorem ipsum ofnwordscharacters -
offset: number of characters or words to offset the result by
Lm
random_lm returns a random lm model output:
-
nobs: Number of observations -
nx: Number of variables (should be lower thannobs)
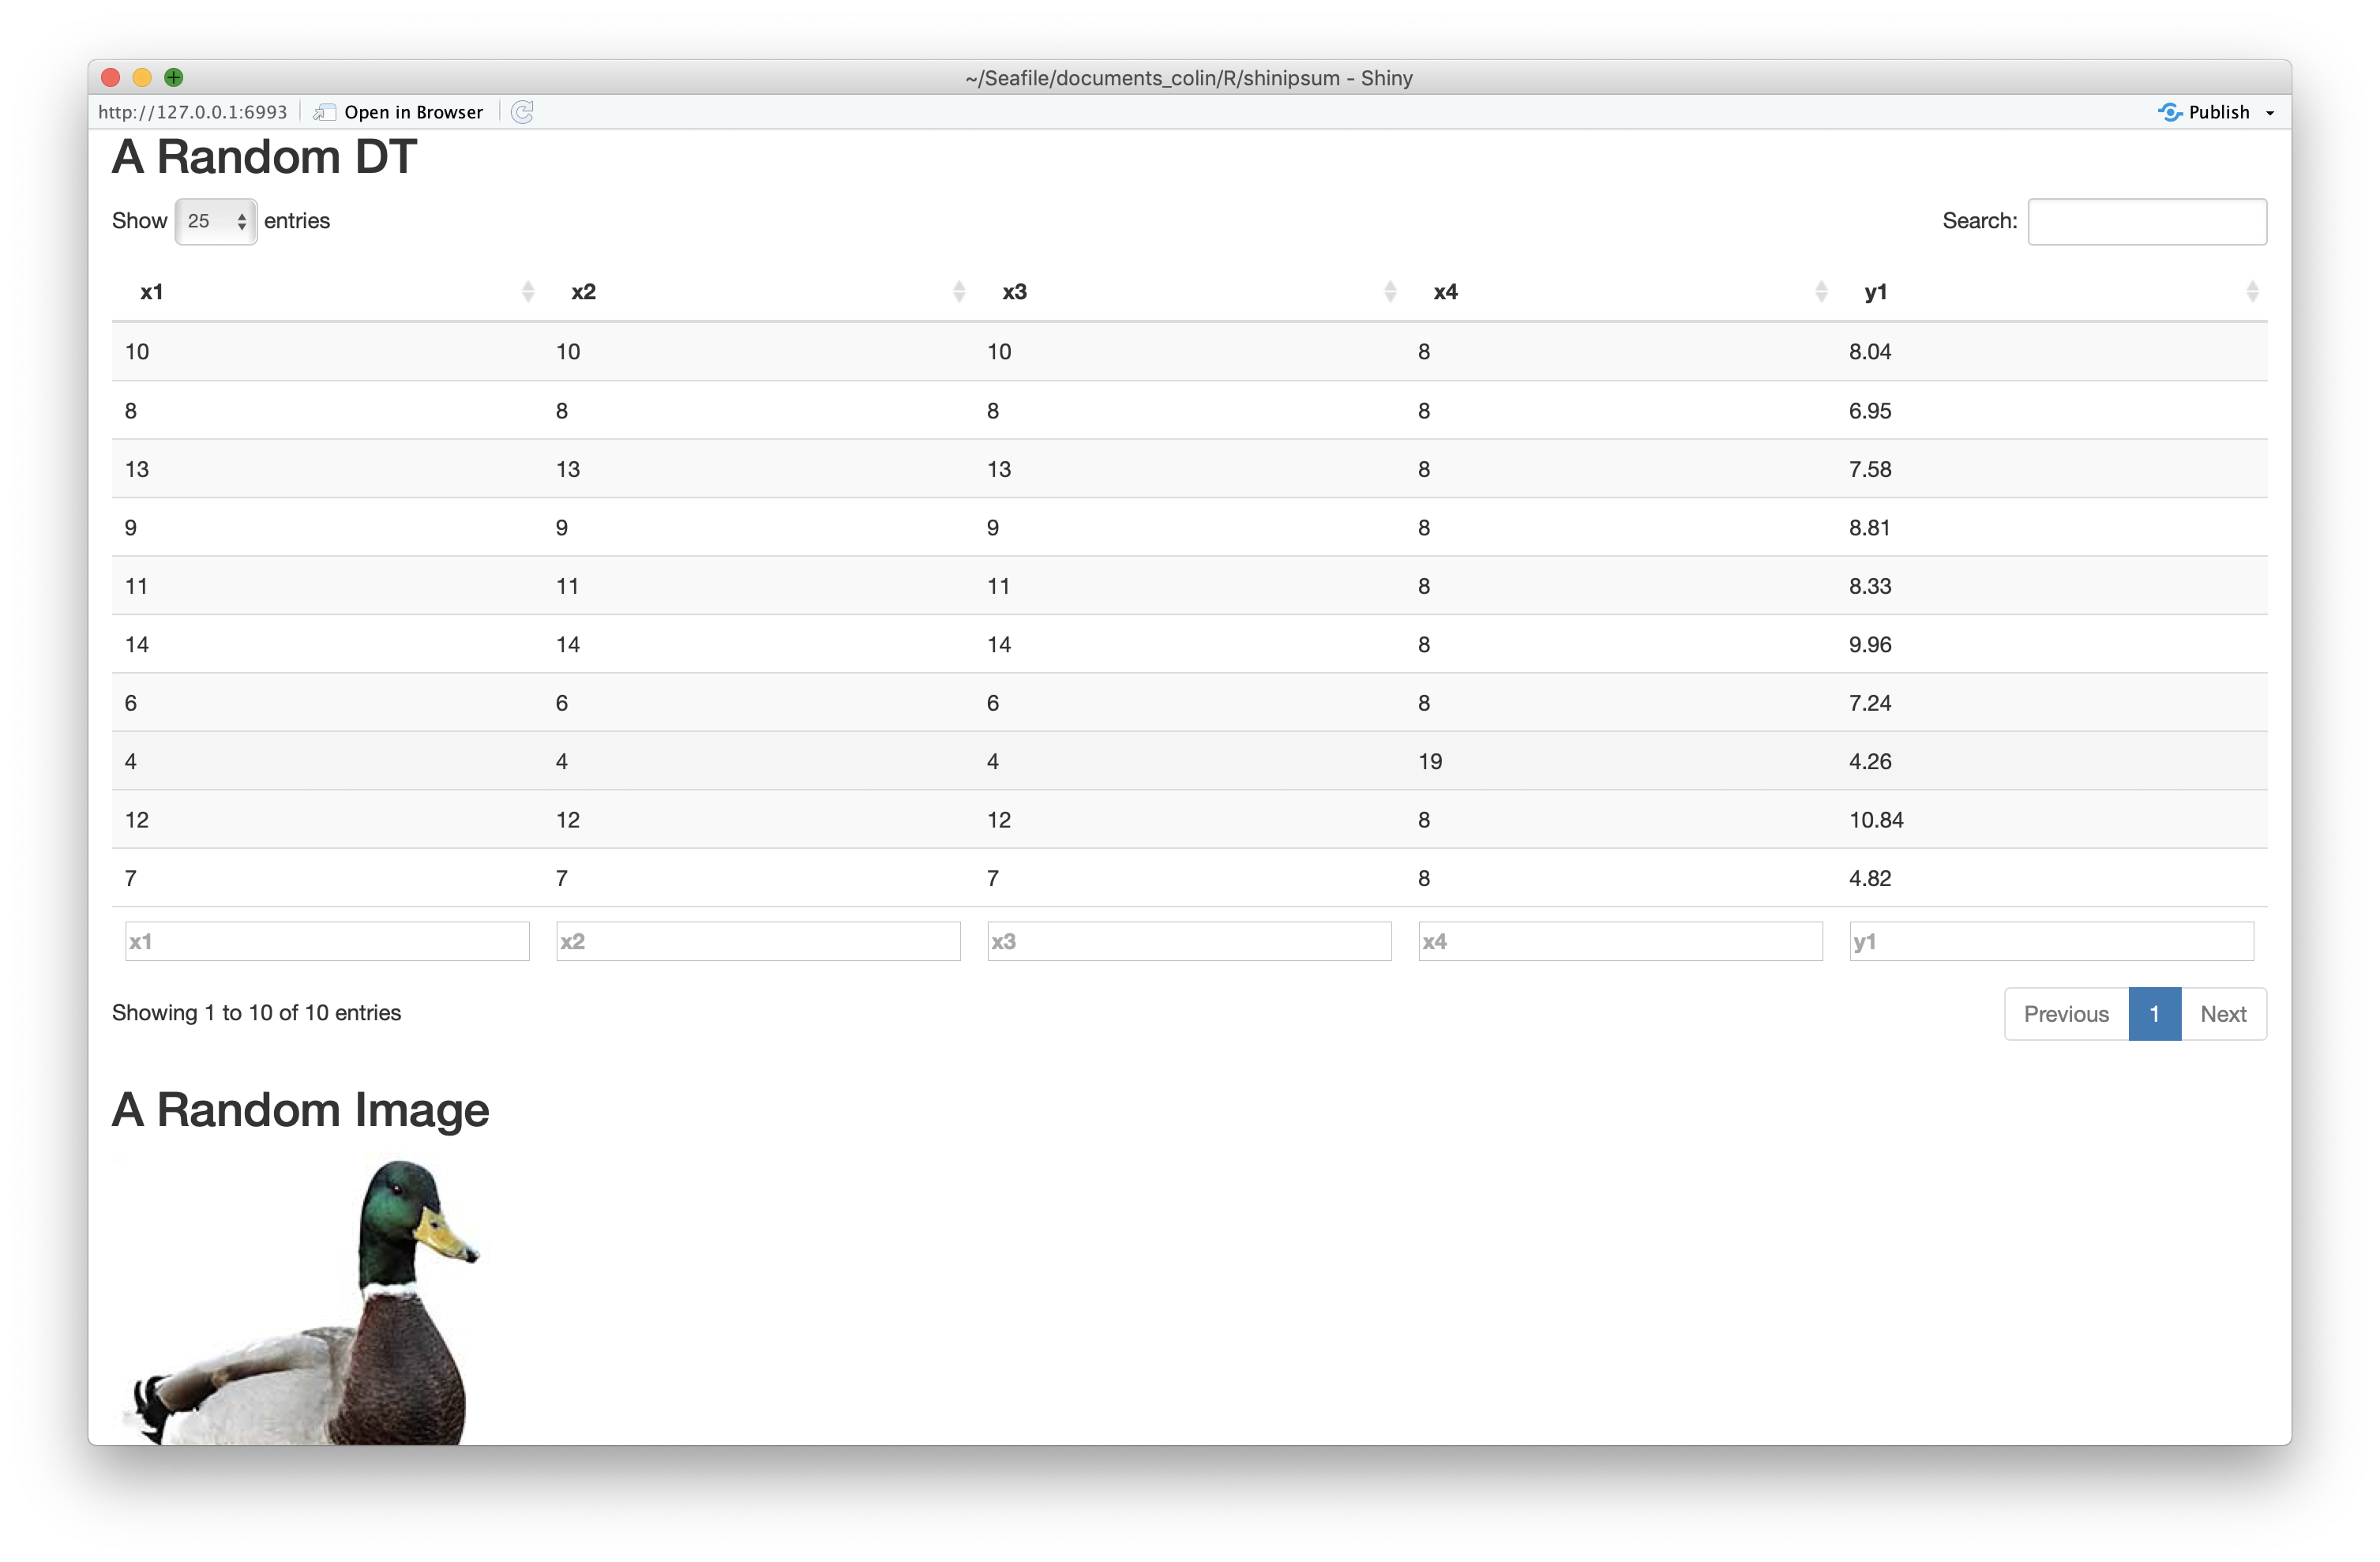
Example
Here is an example of using {shinipsum} to generate a random app:
library(shiny)
library(shinipsum)
library(DT)
ui <- fluidPage(
  h2("A Random DT"),
  DTOutput("data_table"),
  h2("A Random Image"),
  plotOutput("image", height = "300px"),
  h2("A Random Plot"),
  plotOutput("plot"),
  h2("A Random Print"),
  verbatimTextOutput("print"),
  h2("A Random Table"),
  tableOutput("table"),
  h2("A Random Text"),
  tableOutput("text")
)

server <- function(input, output, session) {
  output$data_table <- DT::renderDT({
    random_DT(10, 5)
  })
  output$image <- renderImage({
    random_image()
  })
  output$plot <- renderPlot({
    random_ggplot()
  })
  output$print <- renderPrint({
    random_print("model")
  })
  output$table <- renderTable({
    random_table(10, 5)
  })
  output$text <- renderText({
    random_text(nwords = 50)
  })
}
shinyApp(ui, server)
Please note that the ‘shinipsum’ project is released with a Contributor Code of Conduct. By contributing to this project, you agree to abide by its terms.
