React Google Sheet To Chart Save
📊 React component that renders Google Sheets as attractive charts with minimum effort
React Google Sheet to Chart
Postlight's React Google Sheet to Chart React component transforms Google Sheets to attractive charts in your webapp with minimal effort. Read all about it in this handy introduction.
Try it now at the demo site and check out the demo site GitHub repository.
Installation
The package can be installed via NPM:
npm install @postlight/react-google-sheet-to-chart --save

# or

yarn add @postlight/react-google-sheet-to-chart
Usage
To use this component, you'll need a Google API key. First enable Google Sheets API and then generate the API Key here and restrict it to HTTP referrers (web sites).
Second, you'll need a Google Sheet containing the data you wish to plot. (Be sure to check out the spreadsheet format guidelines.)
Finally, import the React component and initialize it with at least three required props:
-
id: Spreadsheet ID, e.g.1RE_JYUCXBXY2LNV5Tp5GegLnMue-CpfTVMxjdudZ8Js(extractable from a Google sheet URL) -
sheet: Sheet name to parse data from, e.g.Sheet1 -
token: The Google API key you created above
import RoboChart from '@postlight/react-google-sheet-to-chart';

// ...your component code and then...

<RoboChart
  id="GOOGLE_SPREADSHEET_ID"
  sheet="Sheet1"
  token="GENERATED_GOOGLE_API_KEY"
/>;
Quick setup in an app
yarn create react-app my-app
cd my-app
- Install the package
yarn add @postlight/react-google-sheet-to-chart
- Paste the following in
App.jsand replaceGOOGLE_SPREADSHEET_IDandGENERATED_GOOGLE_API_KEYwith appropriate values:
import React, { Component } from 'react';
import RoboChart from '@postlight/react-google-sheet-to-chart';
import './App.css';

const style = { width: '1200px', margin: '0 auto' };
class App extends Component {
  render() {
    return (
      <div style={style}>
        <RoboChart
          id="GOOGLE_SPREADSHEET_ID"
          sheet="Sheet1"
          token="GENERATED_GOOGLE_API_KEY"
        />
      </div>
    );
  }
}
export default App;
- Start the project
yarn start
Optional props
-
starte.g. "A5" (startandendcreate a custom range for your data) -
ende.g. "E15" -
titleThis is the chart title, e.g. "My Accounts" -
flipAxisdefault: {false} -
startFromdefault: {0} -
stackedUse only with type bar, default: {false} -
typedefault: "line", should be one of: "line", "bar", "horizontalBar", "pie", "semi-pie", "doughnut", "semi-doughnut" -
colorse.g. {['#a1a1a1', '#434343', '#ff0055']} -
xsuffixAdd a suffix to x-Axis labels, e.g. " USD" -
ysuffixAdd a suffix to y-Axis labels
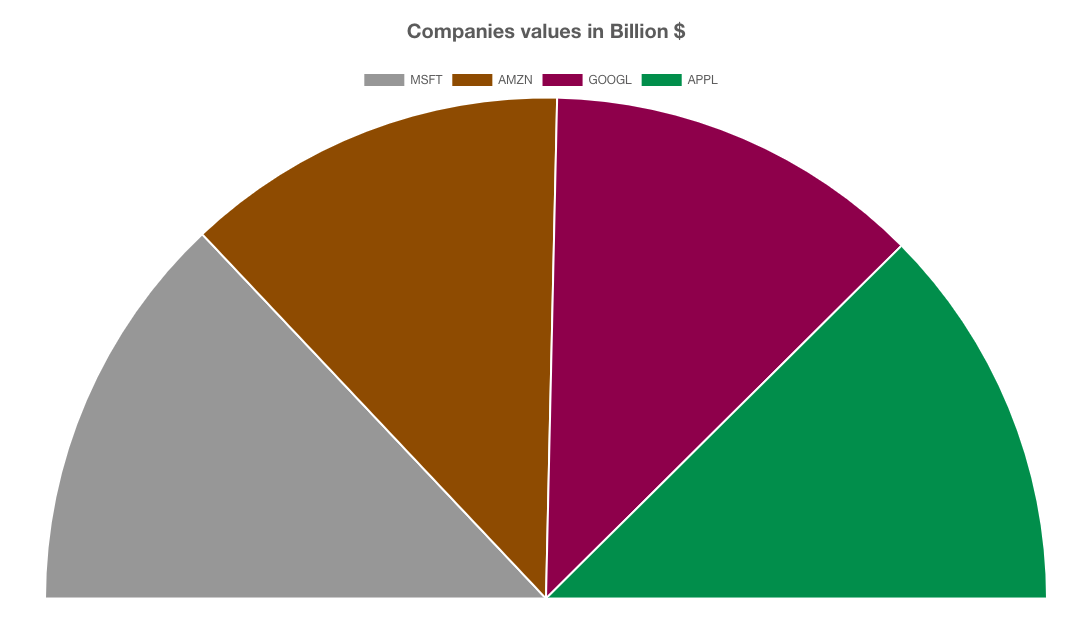
Example:
<RoboChart
  id="GOOGLE_SPREADSHEET_ID"
  sheet="Companies Values"
  token="GENERATED_GOOGLE_API_KEY"
  type="semi-pie"
  title="Companies values in Billion $"
  colors={['#a1a1a1', '#995500', '#990055', '#009955']}
/>
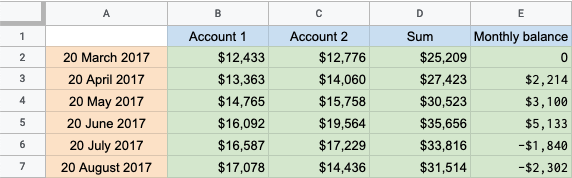
Spreadsheet format
In order to successfuly generate a chart, the Spreadsheet should have Row titles, Column titles and Values, example:
License
Licensed under either of the below, at your preference:
- Apache License, Version 2.0 (LICENSE-APACHE or http://www.apache.org/licenses/LICENSE-2.0)
- MIT license (LICENSE-MIT or http://opensource.org/licenses/MIT)
Contributing
Unless it is explicitly stated otherwise, any contribution intentionally submitted for inclusion in the work, as defined in the Apache-2.0 license, shall be dual licensed as above without any additional terms or conditions.
🔬 A Labs project from your friends at Postlight. Happy coding!
