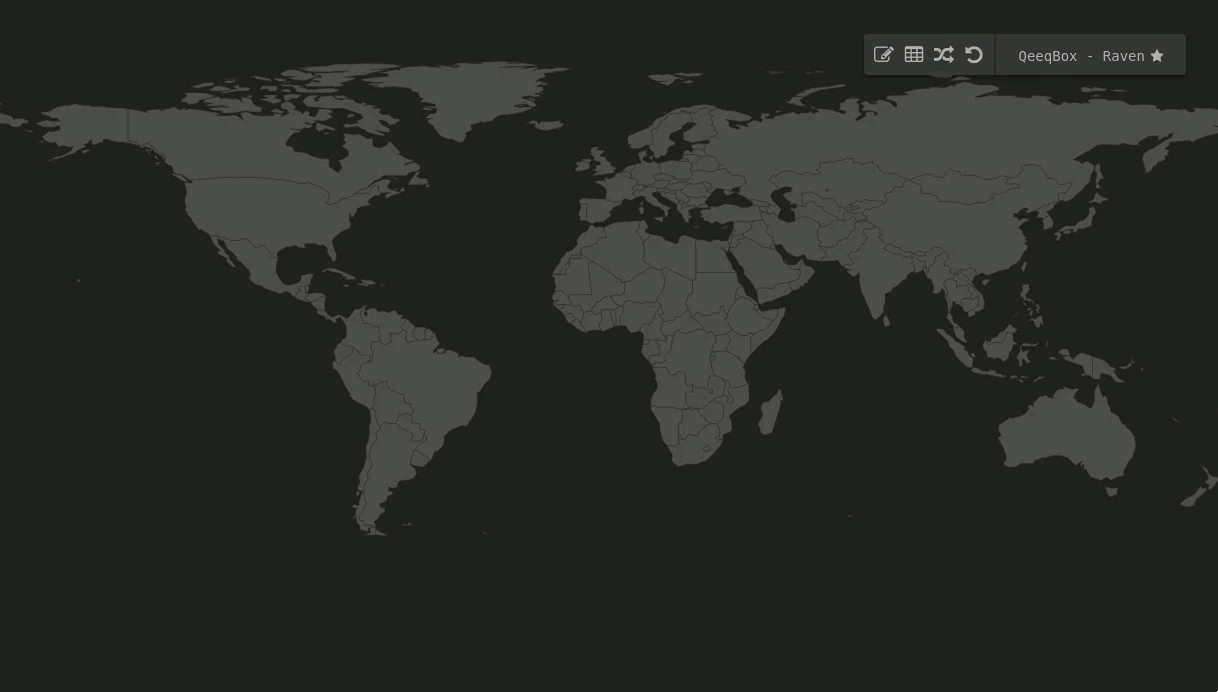
Qeeqbox Raven Save
Advanced Cyber Threat Map (Simplified, customizable, responsive and optimized)
Project README

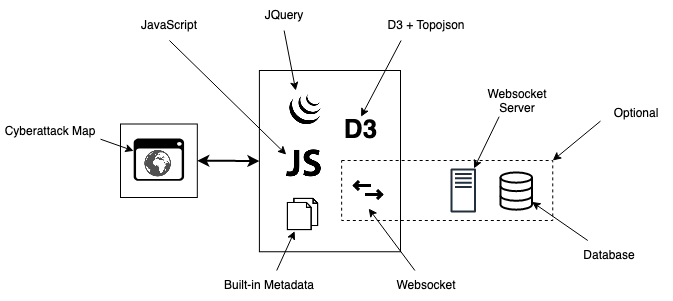
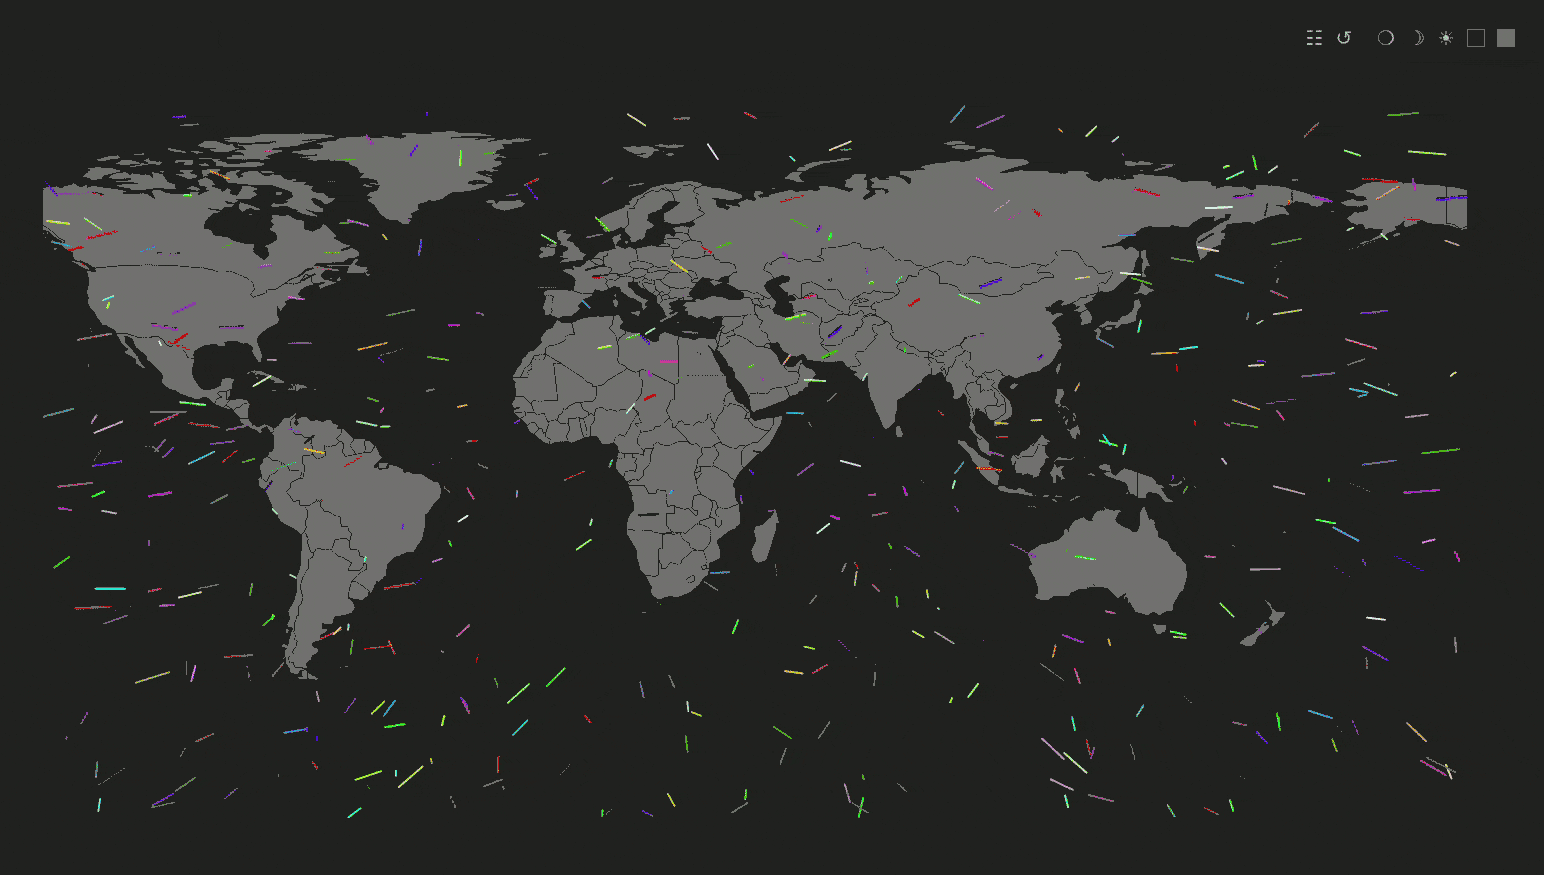
Raven - Advanced Cyber Threat Map (Simplified, customizable and responsive. It uses D3.js with TOPO JSON, has 247 countries, ~100,000 cities, and can be used in an isolated environment without external lookups!.
Structure
Offline - Demo [Firefox, Chrome or Safari]
Live - Regression 500 attacks at once [Firefox, Chrome or Safari]
Live - Demo [Firefox, Chrome or Safari]
https://qeeqbox.github.io/raven/
Features
- Uses D3.js (Not Anime.js)
- Plot by gussing feature (Mix name, ip or coordinates)
- Active threat map (Live and replay)
- IP, country, city, and port info for each attack
- Attacks stats for countries (Only known attacks)
- Responsive interface (Move, drag, zoom in and out)
- Customize options for countries and cites
- 247 countries are listed on the interface (Not 174)
- Optimized worldmap for faster rendering
- Includes IP lookup, port information
- Random simulation (IP, country, city)
- Can be used online or offline (Static)
- Theme picker module
- Handles large number of attacks
Data
You have different options ip, name, and coordinates
-
ipprivate or public ip -> any of these IPs ->0.0.0.0or8.8.8.8as{'from':'0.0.0.0','to':'8.8.8.8'} -
namecity,state,country -> any of these formats work ->seattle,wa,usor0,usas{'from':'seattle,wa,us','to':'0,in'} -
coordinatesLatitude and Longitude as{'from'-11.074920','-51.648929'],'to'51.464957','-107.583864']}
Method 1 - Embed it and interact with it
  //You only need to embed this iframe in your project.
  <iframe id="raven-iframe" src="src/raven.html" frameborder="0" width="100%" height="100%" scrolling="auto"></iframe>

  //Then, run the initialization script with your custom settings - That's all!
  <script type="text/javascript">

    document.getElementById('raven-iframe').addEventListener("load", function() {

      var raven_options = {
        'world_type': null,
        'selected_countries': [],
        'remove_countries': ['aq'],
        'height': window.innerHeight,
        'width': window.innerWidth,
        'backup_background_color': '#212222',
        'orginal_country_color': '#737373',
        'clicked_country_color': '#6c4242',
        'selected_country_color': '#ff726f',
        'attack_output': true,
        'global_timeout': 2000,
        'global_stats_limit': 10,
        'db_length': 1000,
        'location': 'scripts',
        'panels': ['multi-output', 'single-output','tooltip', 'random', 'insert','taskbar'],
        'disable': [],
        'verbose': true
      }

      window['raven'] = document.getElementById('raven-iframe').contentWindow.raven
      window['raven'].init_all(raven_options)
      window['raven'].init_world()
    });

    //After that, you can plot any data you want
    raven.add_to_data_to_table({'from':'seattle,wa,us','to':'delhi,in'},{'line':{'from':null,'to':null}},2000,['line','multi-output','single-output'])

  </script>
Plotting data (functions)
raven.add_marker_by_gussing()       //Plot info by country or city name, ip or coordinates

marker_object                       //An object {'from':'','to':""} see examples
colors_object                       //An object {'line: {'from': ''#FF0000','to': 'FF0000'}} this the color of the line between 2 points - (if null, then a random color will be picked)
timeout                             //Animation time out
options = []                        //A list of options such as animation marker
Plotting data (As line, from -> to)
raven.add_marker_by_gussing({'from':'seattle,wa,us','to':'8.8.8.8'},{'line':{'from':null,'to':null}},2000,['line'])
raven.add_marker_by_gussing({'from':'-11.074920,-51.648929','to':'0.0.0.0:53'},{'line':{'from':'#FF0000','to':'#FF0000'}},1000,['line'])
raven.add_marker_by_gussing({'from':'-11.074920,-51.648929','to':'us'},{'line':{'from':null,'to':'#FFFF00'}},1000,['line'])
Plotting data (As point)
raven.add_marker_by_gussing({'from':'portland,or,us','to':null},{'line':{'from':null,'to':null}},2000,['point'])
raven.add_marker_by_gussing({'from':'8.8.8.8','to':null},{'line':{'from':'#FF0000','to':'#FF0000'}},1000,['point'])
raven.add_marker_by_gussing({'from':'-11.074920,-51.648929','to':null},{'line':{'from':null,'to':'#FFFF00'}},1000,['point'])
Plotting data + adding it to the output table (function)
raven.add_to_data_to_table()        //Plot info and add them to the output table

method                              //Name, IP or coordinates
marker_object                       //An object {'from':'','to':""} see examples
colors_object                       //An object {'line: {'from': ''#FF0000','to': 'FF0000'}} this the color of the line between 2 points - (if null, then a random color will be picked)
timeout                             //Animation time out
options = []                        //A list of options such as animation marker 'line', and plot place 'multi-output' or 'single-out' table or both
Plotting data + adding it to the output table (As line, from -> to)
raven.add_to_data_to_table({'from':'8.8.8.8','to':'delhi,in'},{'line':{'from':null,'to':null}},2000,['line','multi-output','single-output'])
raven.add_to_data_to_table({'from':'-11.074920,-51.648929','to':'0.0.0.0:3389'},{'line':{'from':'#FF0000','to':'#FF0000'}},1000,['line','multi-output'])
raven.add_to_data_to_table({'from':'br','to':'51.464957,-107.583864'},{'line':{'from':null,'to':'#FFFF00'}},1000,['line','single-output'])
Plotting data + adding it to the output table (As point)
raven.add_to_data_to_table({'from':'seattle,wa,us','to':null},{'line':{'from':null,'to':null}},2000,['line','multi-output','single-output'])
raven.add_to_data_to_table({'from':'0.0.0.0','to':null},{'line':{'from':'#FF0000','to':'#FF0000'}},1000,['line','multi-output'])
raven.add_to_data_to_table({'from':'-11.074920,-51.648929','to':null},{'line':{'from':null,'to':'#FFFF00'}},1000,['line','single-output'])
Method 2 - Embed it, and use websocket for plotting
Raven Map
  //You only need to embed this iframe in your project.
  <iframe id="raven-iframe" src="src/raven.html" frameborder="0" width="100%" height="100%" scrolling="auto"></iframe>

  <script type="text/javascript">

    document.getElementById('raven-iframe').addEventListener("load", function() {

      var raven_options = {
        'world_type': null,
        'selected_countries': [],
        'remove_countries': ['aq'],
        'height': window.innerHeight,
        'width': window.innerWidth,
        'backup_background_color': '#212222',
        'orginal_country_color': '#737373',
        'clicked_country_color': '#6c4242',
        'selected_country_color': '#ff726f',
        'attack_output': true,
        'global_timeout': 2000,
        'global_stats_limit': 10,
        'db_length': 1000,
        'location': 'scripts',
        'panels': ['single-output'],
        'disable': ['multi-output','tooltip', 'random', 'insert','taskbar','move_to_country'],
        'websocket':{'server':'ws://localhost:5678',
                      'request_timeout':3000},
        'verbose': false
      }

      window['raven'] = document.getElementById('raven-iframe').contentWindow.raven
      window['raven'].init_all(raven_options)
      window['raven'].init_world()
      window['raven'].fetch_data_from_server()
    });
  </script>
Plotting data - Send the json object using Websocket ws://localhost:5678
    {
    "function":"marker",
      "method": "ip",
      "object": {
        "from": "0.0.0.0",
        "to": "us"
      },
      "color": {
        "line": {
          "from": "#977777",
          "to": "#17777",
        }
      },
      "timeout": 1000,
      "options": [
        "line",
        "single-output",
        "multi-output"
      ]
    }
Plotting data and add to table - Send the json object using Websocket ws://localhost:5678
    {
    "function":"table",
      "object": {
        "from": "-11.074920,-51.648929",
        "to": "br"
      },
      "color": {
        "line": {
          "from": "#977777",
          "to": "#17777",
        }
      },
      "timeout": 1000,
      "options": [
        "line",
        "single-output",
        "multi-output"
      ]
    }
Run simulation (Isolated)
sudo docker build -t simulation . && sudo docker run -p 5678:5678 -p 8080:8080 -it simulation
Then, go to http://localhost:8080/simulation.html
Resources
- Wikipedia, naturalearthdata, d3.js, topojson, jquery, font-awesome, OSINT package, iana, geonames, AFRINIC, APNIC, ARIN, LACNIC and RIPE
- Let me know if I missed a reference or resource!
Disclaimer\Notes
- The dark gray style is typical in my projects (You can change that if you want)
- If you need help improving your world map or cyber threat map, reach out, and I might be able to help you!
Other Projects


Open Source Agenda is not affiliated with "Qeeqbox Raven" Project. README Source: qeeqbox/raven
Stars
149
Open Issues
2
Last Commit
8 months ago
Repository
License
