Pyss3 Save
A Python package implementing a new interpretable machine learning model for text classification (with visualization tools for Explainable AI :octocat:)

![]()
![]()
![]()
A Python package implementing a new simple and interpretable model for text classification
:sushi: Online live demos: http://tworld.io/ss3/ :icecream::ice_cream::cake:
The SS3 text classifier is a novel and simple supervised machine learning model for text classification which is interpretable, that is, it has the ability to naturally (self)explain its rationale. It was originally introduced in Section 3 of the paper "A text classification framework for simple and effective early depression detection over social media streams" (arXiv preprint). This simple model obtained the best and 2nd-best results, consecutively, in the last three editions of the CLEF's eRisk lab among all participating models [Burdisso et al. 2019; Loyola et al. 2021]. Given its white-box nature, it allows researchers and practitioners to deploy interpretable (i.e. self-explainable) and therefore more reliable, models for text classification (which could be especially useful for those working with classification problems by which people's lives could be somehow affected).
Note: this package also incorporates different variations of the original model, such as the one introduced in "t-SS3: a text classifier with dynamic n-grams for early risk detection over text streams" (arXiv preprint) which allows SS3 to recognize important variable-length word n-grams "on the fly".
What is PySS3?
PySS3 is a Python package that allows you to work with SS3 in a very straightforward, interactive and visual way. In addition to the implementation of the SS3 classifier, PySS3 comes with a set of tools to help you developing your machine learning models in a clearer and faster way. These tools let you analyze, monitor and understand your models by allowing you to see what they have actually learned and why. To achieve this, PySS3 provides you with 3 main components: the SS3 class, the Live_Test class, and the Evaluation class, as pointed out below.
:point_right: The SS3 class
which implements the classifier using a clear API. For instance, let's first load one of the tutorial's dataset:
from pyss3.util import Dataset

url = "https://github.com/sergioburdisso/pyss3/raw/master/examples/datasets/movie_review.zip"

x_train, y_train = Dataset.load_from_url(url, "train")
x_test, y_test = Dataset.load_from_url(url, "test")
Now let's train our first SS3 model! note that the API is very similar to that of sklearn's models:
from pyss3 import SS3

clf = SS3()
clf.fit(x_train, y_train)
y_pred = clf.predict(x_test)
Also, this class provides a handful of other useful methods, such as, for instance, extract_insight() to extract the text fragments involved in the classification decision (allowing you to better understand the rationale behind the model’s predictions) or classify_multilabel() to provide multi-label classification support:
doc = "Liverpool CEO Peter Moore on Building a Global Fanbase"

# standard "single-label" classification
label = clf.classify_label(doc) # 'business'

# multi-label classification
labels = clf.classify_multilabel(doc)  # ['business', 'sports']
:point_right: The Live_Test class
which allows you to interactively test your model and visually see the reasons behind classification decisions, with just one line of code:
from pyss3.server import Live_Test

clf = SS3()
clf.fit(x_train, y_train)

Live_Test.run(clf, x_test, y_test) # <- this one! cool uh? :)
As shown in the image below, this will open up, locally, an interactive tool in your browser which you can use to (live) test your models with the documents given in x_test (or typing in your own!). This will allow you to visualize and understand what your model is actually learning.

For example, we have uploaded two of these live tests online for you to try out: "Movie Review (Sentiment Analysis)" and "Topic Categorization", both were obtained following the tutorials.
:point_right: And last but not least, the Evaluation class
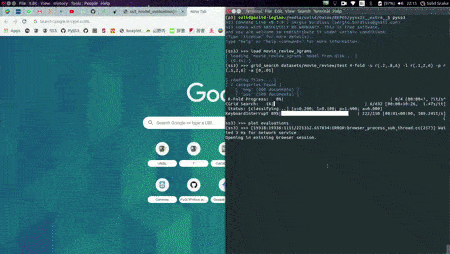
This is probably one of the most useful components of PySS3. As the name suggests, this class provides the user easy-to-use methods for model evaluation and hyperparameter optimization, like, for example, the test, kfold_cross_validation, grid_search, and plot methods for performing tests, stratified k-fold cross validations, grid searches for hyperparameter optimization, and visualizing evaluation results using an interactive 3D plot, respectively. Probably one of its most important features is the ability to automatically (and permanently) record the history of evaluations that you've performed. This will save you a lot of time and will allow you to interactively visualize and analyze your classifier performance in terms of its different hyper-parameters values (and select the best model according to your needs). For instance, let's perform a grid search with a 4-fold cross-validation on the three hyperparameters, smoothness(s), significance(l), and sanction(p):
from pyss3.util import Evaluation

best_s, best_l, best_p, _ = Evaluation.grid_search(
    clf, x_train, y_train,
    s=[0.2, 0.32, 0.44, 0.56, 0.68, 0.8],
    l=[0.1, 0.48, 0.86, 1.24, 1.62, 2],
    p=[0.5, 0.8, 1.1, 1.4, 1.7, 2],
    k_fold=4
)
In this illustrative example, s, l, and p will take those 6 different values each, and once the search is over, this function will return (by default) the hyperparameter values that obtained the best accuracy.
Now, we could also use the plot function to analyze the results obtained in our grid search using the interactive 3D evaluation plot:
Evaluation.plot()
In this 3D plot, each point represents an experiment/evaluation performed using that particular combination of values (s, l, and p). Also, these points are painted proportional to how good the performance was according to the selected metric; the plot will update "on the fly" when the user select a different evaluation metric (accuracy, precision, recall, f1, etc.). Additionally, when the cursor is moved over a data point, useful information is shown (including a "compact" representation of the confusion matrix obtained in that experiment). Finally, it is worth mentioning that, before showing the 3D plots, PySS3 creates a single and portable HTML file in your project folder containing the interactive plots. This allows users to store, send or upload the plots to another place using this single HTML file. For example, we have uploaded two of these files for you to see: "Sentiment Analysis (Movie Reviews)" and "Topic Categorization", both evaluation plots were also obtained following the tutorials.
Want to give PySS3 a shot? :eyeglasses: :coffee:
Just go to the Getting Started page :D
Installation
Simply use:
pip install pyss3
Want to contribute to this Open Source project? :sparkles::octocat::sparkles:
Thanks for your interest in the project, you're ![]() !!
Any kind of help is very welcome (Code, Bug reports, Content, Data, Documentation, Design, Examples, Ideas, Feedback, etc.), Issues and/or Pull Requests are welcome for any level of improvement, from a small typo to new features, help us make PySS3 better :+1:
!!
Any kind of help is very welcome (Code, Bug reports, Content, Data, Documentation, Design, Examples, Ideas, Feedback, etc.), Issues and/or Pull Requests are welcome for any level of improvement, from a small typo to new features, help us make PySS3 better :+1:
Remember that you can use the "Edit" button ('pencil' icon) up the top to edit any file of this repo directly on GitHub.
Finally, in case you're planning to create a new Pull Request, for committing to this repo, we follow the "seven rules of a great Git commit message" from "How to Write a Git Commit Message", so make sure your commits follow them as well.
(if you need any further information, please, do not hesitate to contact me - [email protected])
Contributors :muscle::sunglasses::+1:
Thanks goes to these awesome people (emoji key):
 Florian Angermeir 💻 🤔 🔣 |
 Muneeb Vaiyani 🤔 🔣 |
 Saurabh Bora 🤔 |
 Hubert Baniecki 🤔 📖 |
This project follows the all-contributors specification. Contributions of any kind welcome!
