Programming Language Benchmarks Visualization Save
Automaticlly updated language performance banchmarks in visualization. Data source from debian's the computer language benchmakrs game.
Programming-Language-Benchmarks-Visualization
![]()
![]()
Benchmarks data & source codes come from the computer language benchmarks game.
This project relies on github actions and will be updated weekly with the latest data and render them into visualizations. In addition to images, you can also visit https://goodmanwen.github.io/Programming-Language-Benchmarks-Visualization/ for live demo.
For the author's interest, this project adds additional benchmarks for Python's jit interpreters such as Pypy and Pyston
This project relies to some extent on manual adjustments, so if you find that some items are inconsistent with the original ones, feel free to submit an issue.
Additional technical details
It is worth mentioning that this project is not designed to provide a rigorous performance test, but to provide an approximate reference for those who need it. Since comprehensive comparison tests are difficult to design and sometimes lacking scientific basis, you should always rely on the use case if you need a percice performance comparison.
Here is a supplementary note for those who want to know the technical details.
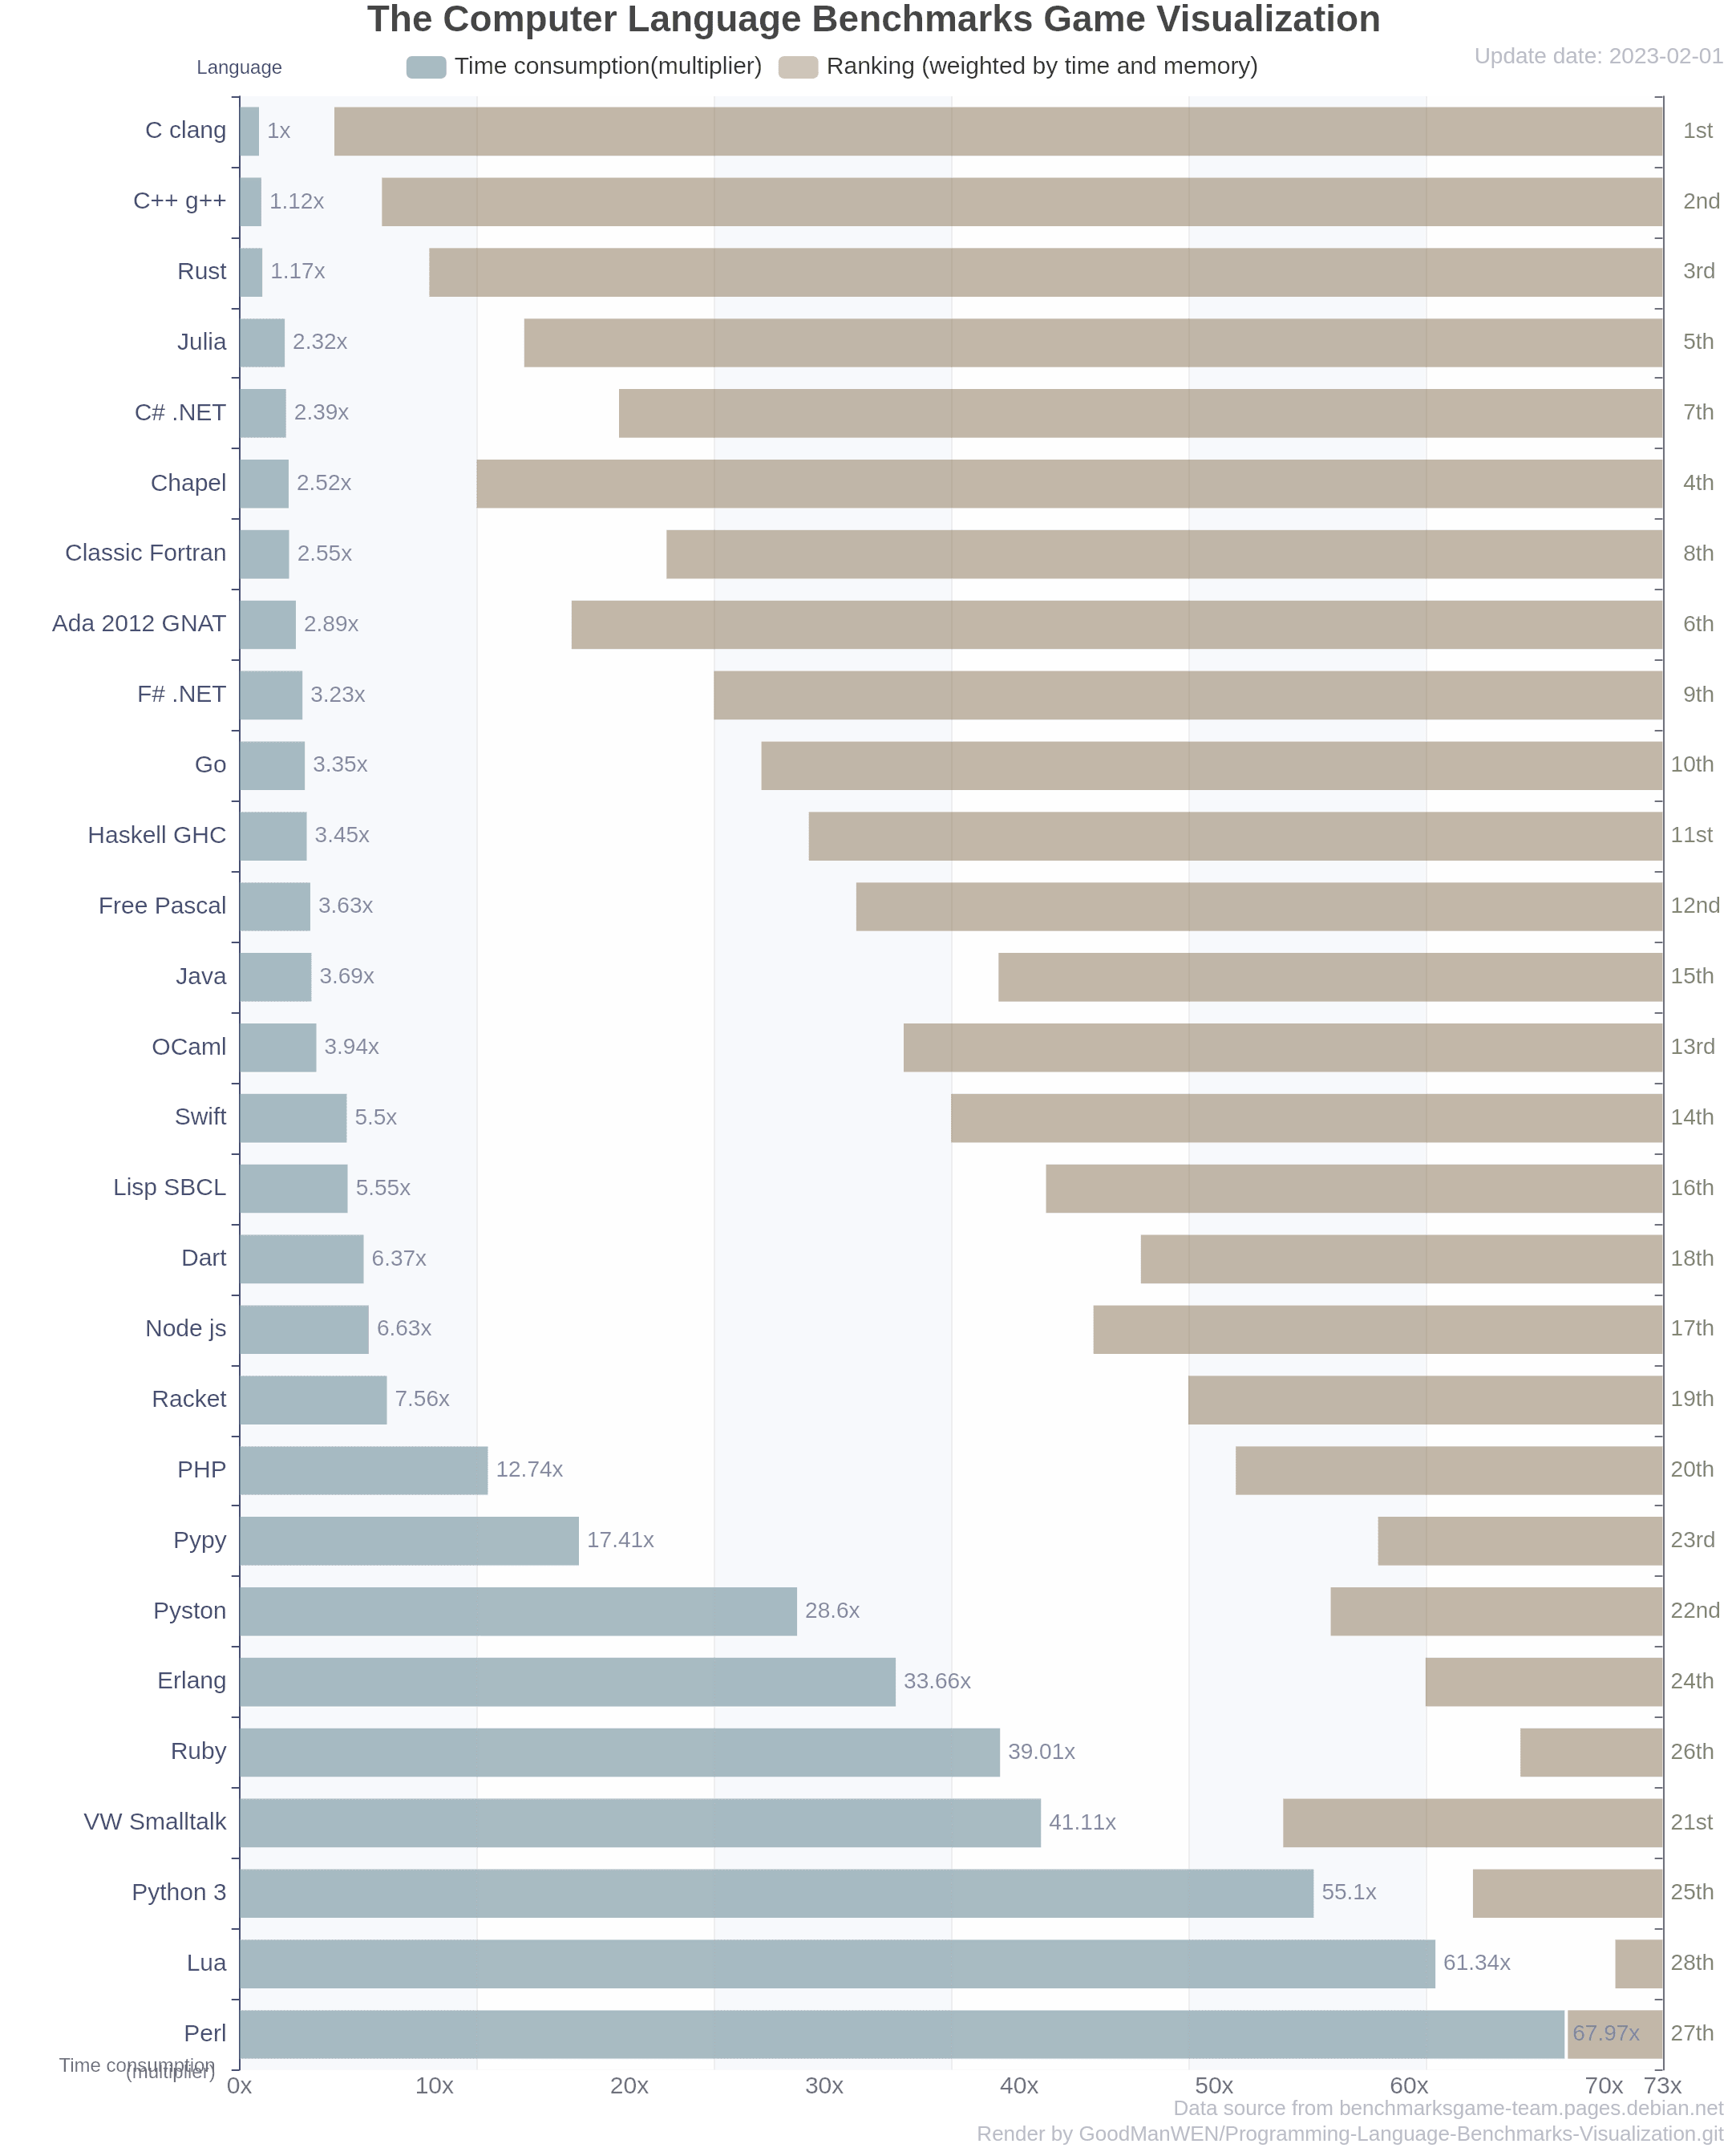
About "Time consumption"
This is a figure reflects the time efficiency directly. As an example if the C++/g++ is shown as 1x while C# .net is shown as 2x, which means that the latter took twice as long as the former in the testing programs overall according to The Benchmarks Game.
One scenario here is to consider how to avoid the effect of extreme values. Say a scenario that we have ten tests, and if the majority of them take less than 10 seconds, but one extreme item takes over 600 seconds, then the overall average elapsed time will depend mainly on this longest project, thus cutting the impact of other projects and that's what we don't expect. Hence in this project the final data is weighted among all test items, followed the following formula generally:


Where δ indicates standard deviation, r indicates weight, V indicates final output, L is a constant.
It is designed with the idea that when the overall execution time of all languages in a particular test item is longer than others, it will be given a relatively small weight to avoid affecting other tests. Also due to the different degrees of dispersion, the variance differences between items could be very large, we don't want the weights of the different items to be too different, but we want them all to be at least in the same order of magnitude. After the adjusting of these formulas, the difference in the contribution of different items to the total elapsed time will between 1 to 3 times.
About "Weighted by time and memory"
Since raw data provides not only the execution time but also the memory consumption, we can argue that if a language is "a language with good efficient" then it needs not only good time efficiency, but also good space efficiency, hence this composite sort was born.
Its sorting logic is very simple, we sort the time and memory usage separately then we take the average of them to get the final result. Considering that most people are more concerned about time efficiency than spatial efficiency, I simply set the weighting ratio of the two to 80% to 20%.
About the data source and update policy
All the data used for testing was obtained from The Benchmarks Game (except to the two we run on our own), the fastest record for each language in each test will be taken. The update frequency is once a week, we ensure up-to-date data via web access.
