ODSC India 2018 Save
My presentation at ODSC India 2018 about Deep Learning with Apache Spark
ODSC India 2018

Deep Learning with Pyspark
Hi everyone and welcome back to learning :). In this article I’ll continue the discussion on Deep Learning with Apache Spark. You can see the preparation part for this repo and code here.
Here I will focus entirely on the DL pipelines library and how to use it from scratch.
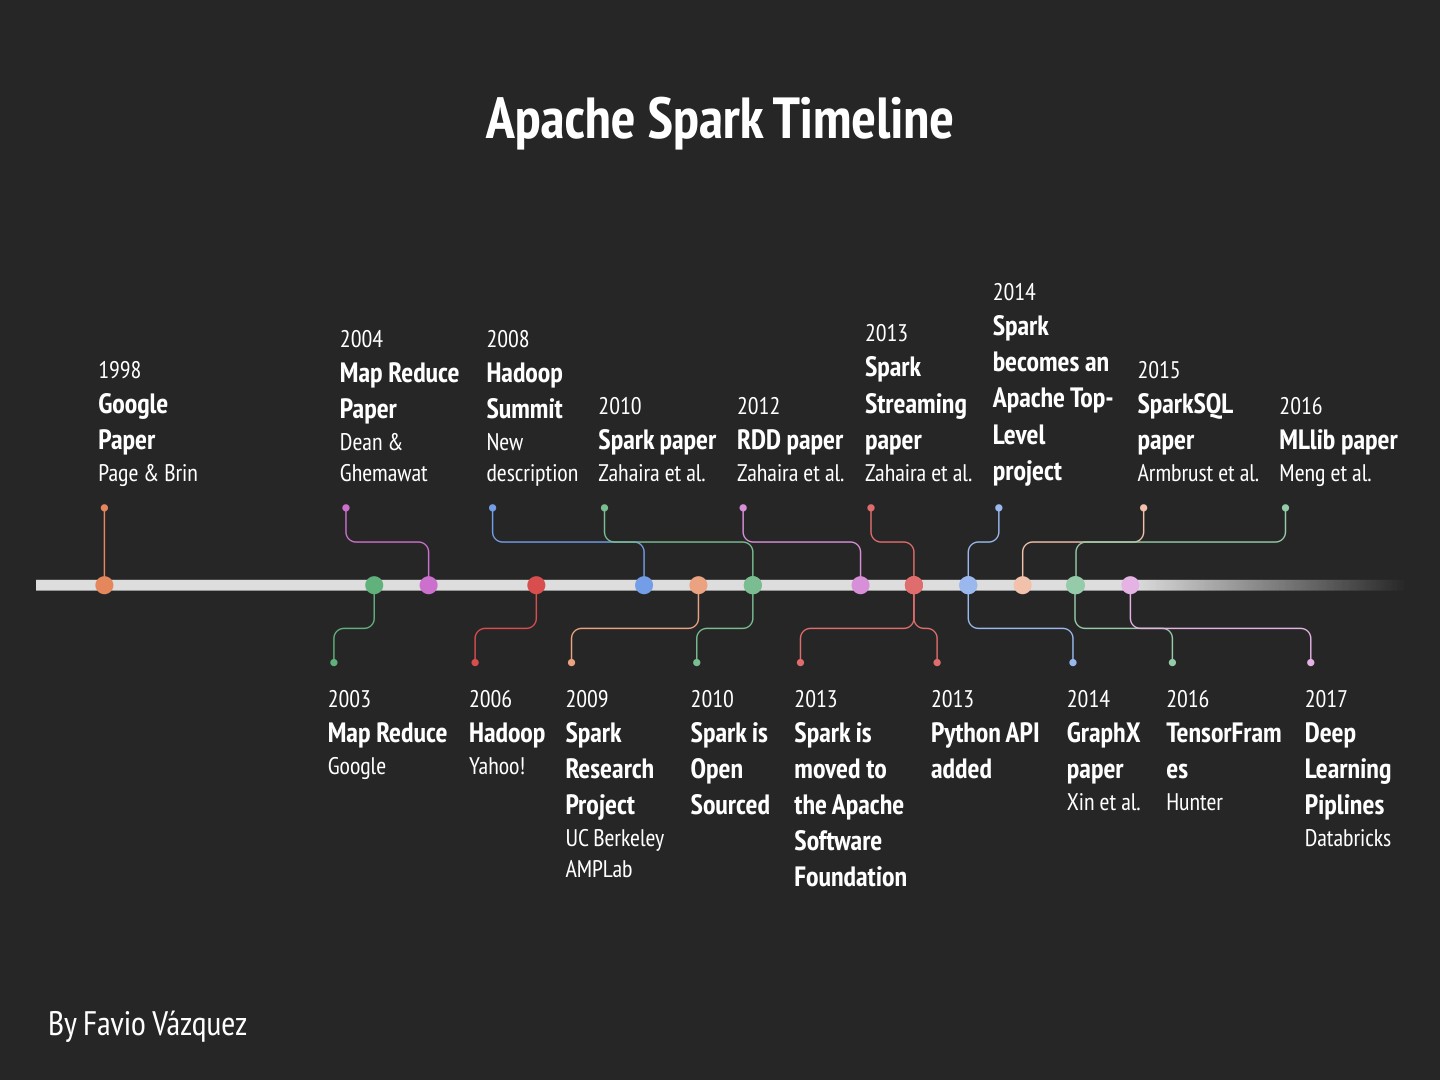
Apache Spark Timeline
The continuous improvements on Apache Spark lead us to this discussion on how to do Deep Learning with it. I created a detailed timeline of the development of Apache Spark until now to see how we got here.
Deep Learning Pipelines
 Databricks
Deep Learning Pipelines is an open source library created by Databricks that provides high-level APIs for scalable deep learning in Python with Apache Spark.
It is an awesome effort and it won’t be long until is merged into the official API, so is worth taking a look of it.
Some of the advantages of this library compared to the ones that joins Spark with DL are:
- In the spirit of Spark and Spark MLlib, it provides easy-to-use APIs that enable deep learning in very few lines of code.
- It focuses on ease of use and integration, without sacrificing performace.
- It’s build by the creators of Apache Spark (which are also the main contributors) so it’s more likely for it to be merged as an official API than others.
- It is written in Python, so it will integrate with all of its famous libraries, and right now it uses the power of TensorFlow and Keras, the two main libraries of the moment to do DL.
Deep Learning Pipelines builds on Apache Spark’s ML Pipelines for training, and with Spark DataFrames and SQL for deploying models. It includes high-level APIs for common aspects of deep learning so they can be done efficiently in a few lines of code:
- Image loading
- Applying pre-trained models as transformers in a Spark ML pipeline
- Transfer learning
- Applying Deep Learning models at scale
- Deploying models in DataFrames and SQL
I will describe each of these features in detail with examples. These examples comes from the official notebook by Databricks.
Optimus

Optimus is the missing framework to profile, clean, process and do ML in a distributed fashion using Apache Spark(PySpark).
Installation (pip):
In your terminal just type pip install optimuspyspark
Loading data
Now Optimus can load data in csv, json, parquet and avro from a local file or an URL.
#csv
df = op.load.csv("data/foo.csv")

#json
df = op.load.json("data/foo.json")

# parquet
df = op.load.parquet("data/foo.parquet")

# avro
df = op.load.avro("data/foo.avro").table(5)
If you want to load from a URL you just need to use load.url() with the path and the type file (csv, json, parquet, avro)
df = op.load.url("https://raw.githubusercontent.com/ironmussa/Optimus/feature/load_save_improvements/examples/data/foo.json", "json")
Cleaning and Processing
Optimus V2 was created to make data cleaning a breeze. The API was designed to be super easy to newcomers and very familiar for people that comes from Pandas. Optimus expand the Spark DataFrame functionality adding .rows and .cols attributes.
For example you can load data from a url, transform and apply some predefined cleaning functions:
from optimus import Optimus
op = Optimus()

# This is a custom function
def func(value, arg):
    return "this was a number"

df =op.load.url("https://raw.githubusercontent.com/ironmussa/Optimus/master/examples/foo.csv")

df\
    .rows.sort("product","desc")\
    .cols.lower(["firstName","lastName"])\
    .cols.date_transform("birth", "new_date", "yyyy/MM/dd", "dd-MM-YYYY")\
    .cols.years_between("birth", "years_between", "yyyy/MM/dd")\
    .cols.remove_accents("lastName")\
    .cols.remove_special_chars("lastName")\
    .cols.replace("product","taaaccoo","taco")\
    .cols.replace("product",["piza","pizzza"],"pizza")\
    .rows.drop(df["id"]<7)\
    .cols.drop("dummyCol")\
    .cols.rename(str.lower)\
    .cols.apply_by_dtypes("product",func,"string", data_type="integer")\
    .cols.trim("*")\
    .show()
You transform this:
+---+--------------------+--------------------+---------+----------+-----+----------+--------+
| id|           firstName|            lastName|billingId|   product|price|     birth|dummyCol|
+---+--------------------+--------------------+---------+----------+-----+----------+--------+
|  1|                Luis|         Alvarez$$%!|      123|      Cake|   10|1980/07/07|   never|
|  2|               André|              Ampère|      423|      piza|    8|1950/07/08|   gonna|
|  3|               NiELS|          Böhr//((%%|      551|     pizza|    8|1990/07/09|    give|
|  4|                PAUL|              dirac$|      521|     pizza|    8|1954/07/10|     you|
|  5|              Albert|            Einstein|      634|     pizza|    8|1990/07/11|      up|
|  6|             Galileo|             GALiLEI|      672|     arepa|    5|1930/08/12|   never|
|  7|                CaRL|            Ga%%%uss|      323|      taco|    3|1970/07/13|   gonna|
|  8|               David|          H$$$ilbert|      624|  taaaccoo|    3|1950/07/14|     let|
|  9|            Johannes|              KEPLER|      735|      taco|    3|1920/04/22|     you|
| 10|               JaMES|         M$$ax%%well|      875|      taco|    3|1923/03/12|    down|
| 11|               Isaac|              Newton|      992|     pasta|    9|1999/02/15|  never |
| 12|              Emmy%%|            Nöether$|      234|     pasta|    9|1993/12/08|   gonna|
| 13|              Max!!!|           Planck!!!|      111|hamburguer|    4|1994/01/04|    run |
| 14|                Fred|            Hoy&&&le|      553|    pizzza|    8|1997/06/27|  around|
| 15|(((   Heinrich )))))|               Hertz|      116|     pizza|    8|1956/11/30|     and|
| 16|             William|          Gilbert###|      886|      BEER|    2|1958/03/26|  desert|
| 17|               Marie|               CURIE|      912|      Rice|    1|2000/03/22|     you|
| 18|              Arthur|          COM%%%pton|      812|    110790|    5|1899/01/01|       #|
| 19|               JAMES|            Chadwick|      467|      null|   10|1921/05/03|       #|
+---+--------------------+--------------------+---------+----------+-----+----------+--------+
into this:
+---+---------+--------+---------+-----------------+-----+----------+----------+-------------+
| id|firstname|lastname|billingid|          product|price|     birth|  new_date|years_between|
+---+---------+--------+---------+-----------------+-----+----------+----------+-------------+
| 10|    james| maxwell|      875|             taco|    3|1923/03/12|12-03-1923|      95.4355|
| 11|    isaac|  newton|      992|            pasta|    9|1999/02/15|15-02-1999|      19.5108|
| 12|     emmy| noether|      234|            pasta|    9|1993/12/08|08-12-1993|      24.6962|
| 13|      max|  planck|      111|       hamburguer|    4|1994/01/04|04-01-1994|      24.6237|
| 14|     fred|   hoyle|      553|            pizza|    8|1997/06/27|27-06-1997|      21.1452|
| 15| heinrich|   hertz|      116|            pizza|    8|1956/11/30|30-11-1956|      61.7204|
| 16|  william| gilbert|      886|             BEER|    2|1958/03/26|26-03-1958|      60.3978|
| 17|    marie|   curie|      912|             Rice|    1|2000/03/22|22-03-2000|      18.4086|
| 18|   arthur| compton|      812|this was a number|    5|1899/01/01|01-01-1899|     119.6317|
| 19|    james|chadwick|      467|             null|   10|1921/05/03|03-05-1921|       97.293|
|  7|     carl|   gauss|      323|             taco|    3|1970/07/13|13-07-1970|      48.0995|
|  8|    david| hilbert|      624|             taco|    3|1950/07/14|14-07-1950|      68.0968|
|  9| johannes|  kepler|      735|             taco|    3|1920/04/22|22-04-1920|      98.3253|
+---+---------+--------+---------+-----------------+-----+----------+----------+-------------+
Note that you can use Optimus functions and Spark functions(.WithColumn()) at the same time. To know about all the Optimus functionality please go to this notebooks
Custom functions
Spark have multiple ways to transform your data like rdd, Column Expression ,udf and pandas udf. In Optimus we create the apply() and apply_expr which handle all the implementation complexity.
Here you apply a function to the "billingid" column. Sum 1 and 2 to the current column value. All powered by Pandas UDF
from optimus import Optimus
op = Optimus()

df =op.load.url("https://raw.githubusercontent.com/ironmussa/Optimus/master/examples/foo.csv")

def func(value, args):
    return value +args[0] + args[1]

df.cols.apply("billingid",func,"int", [1,2]).show()
If you want to apply a Column Expression use apply_expr() like this. In this case we pasa an argument 10 to divide the actual column value
from pyspark.sql import functions as F
from optimus import Optimus
op = Optimus()


df =op.load.url("https://raw.githubusercontent.com/ironmussa/Optimus/master/examples/foo.csv")

def func(col_name, args):
    return F.col(col_name)/20

df.cols.apply_expr("billingid", func, 20).show()
Data profiling
Optimus comes with a powerful and unique data profiler. Besides basic and advance stats like min, max, kurtosis, mad etc,
it also let you know what type of data has every column. For example if a string column have string, integer, float, bool, date Optimus can give you an unique overview about your data.
Just run df.profile("*") to profile all the columns. For more info about the profiler please go to this notebook
Machine Learning
Machine Learning is one of the last steps, and the goal for most Data Science WorkFlows.
Apache Spark created a library called MLlib where they coded great algorithms for Machine Learning. Now with the ML library we can take advantage of the Dataframe API and its optimization to create easily Machine Learning Pipelines.
Even though this task is not extremely hard, is not easy. The way most Machine Learning models work on Spark are not straightforward, and they need lots feature engineering to work. That's why we created the feature engineering section inside the Transformer.
To import the Machine Learning Library you just need to say to import Optimus and the ML API:
    from optimus import Optimus

    op = Optimus()
One of the best "tree" models for machine learning is Random Forest. What about creating a RF model with just one line? With Optimus is really easy.
    df_cancer =op.load.url("https://raw.githubusercontent.com/ironmussa/Optimus/master/tests/data_cancer.csv")
    columns = ['diagnosis', 'radius_mean', 'texture_mean', 'perimeter_mean', 'area_mean', 'smoothness_mean',
           'compactness_mean', 'concavity_mean', 'concave points_mean', 'symmetry_mean',
           'fractal_dimension_mean']
    df_predict, rf_model = op.ml.random_forest(df_cancer, columns, "diagnosis")
This will create a DataFrame with the predictions of the Random Forest model.
So lets see the prediction compared with the actual label:
df_predict.cols.select(["label","prediction"]).show()
+-----+----------+
|label|prediction|
+-----+----------+
|  1.0|       1.0|
+-----+----------+
|  1.0|       1.0|
+-----+----------+
|  1.0|       1.0|
+-----+----------+
|  1.0|       1.0|
+-----+----------+
|  1.0|       1.0|
+-----+----------+
|  1.0|       1.0|
+-----+----------+
|  1.0|       1.0|
+-----+----------+
|  1.0|       1.0|
+-----+----------+
|  1.0|       1.0|
+-----+----------+
|  1.0|       1.0|
+-----+----------+
|  1.0|       1.0|
+-----+----------+
|  1.0|       1.0|
+-----+----------+
|  1.0|       1.0|
+-----+----------+
|  1.0|       1.0|
+-----+----------+
|  1.0|       1.0|
+-----+----------+
|  1.0|       1.0|
+-----+----------+
|  1.0|       0.0|
+-----+----------+
|  1.0|       1.0|
+-----+----------+
|  1.0|       1.0|
+-----+----------+
|  0.0|       0.0|
+-----+----------+
only showing top 20 rows
The rf_model variable contains the Random Forest model for analysis.
