Nodesoup Save
Force-directed graph layout with Fruchterman-Reingold
Graph untangling
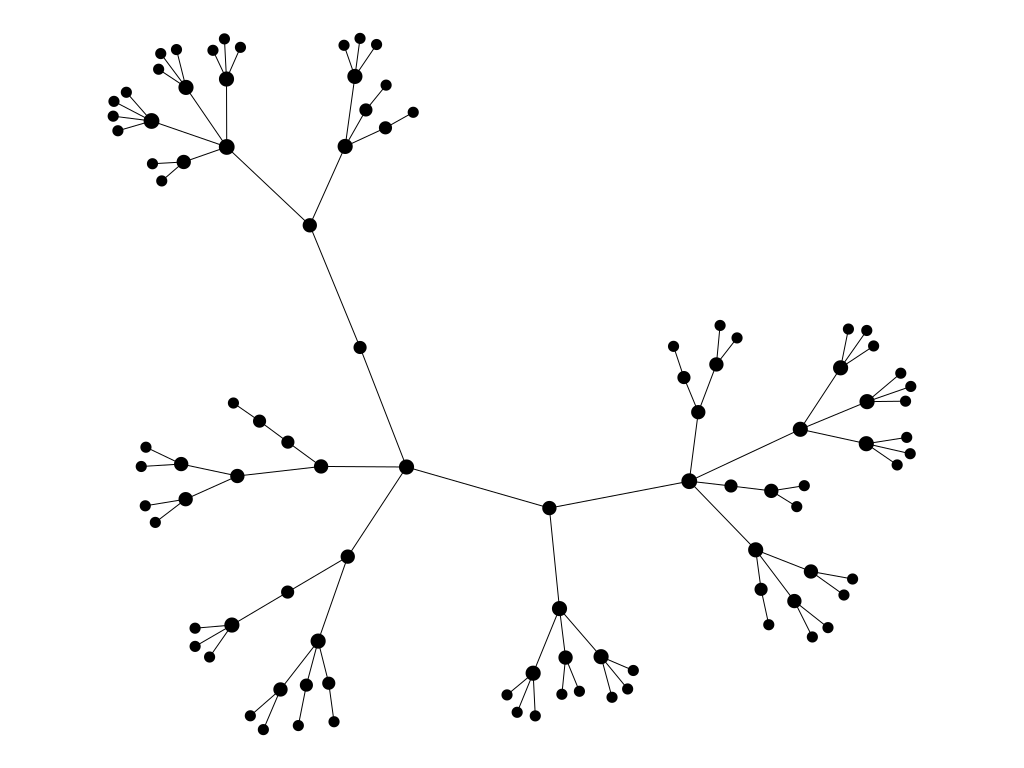
Force-directed graph layout simulates forces to give motion to vertices and arrange them in a way that is visually pleasing and/or reveals structure. The Fruchterman-Reingold algorithm assigns a repelling force to vertices pair of the graph, effectively pushing apart vertices so they don't overlap, and a attraction force between each adjacent vertices pair, thus dragging closer connected vertices. The forces attenuate when the vertices get respectively further apart or closer, and a global temperature also serves as a simulated annealing, capping the maximum vertex displacement at each iteration. As the forces between each component and the temperature gradually diminish, the layout stabilizes.
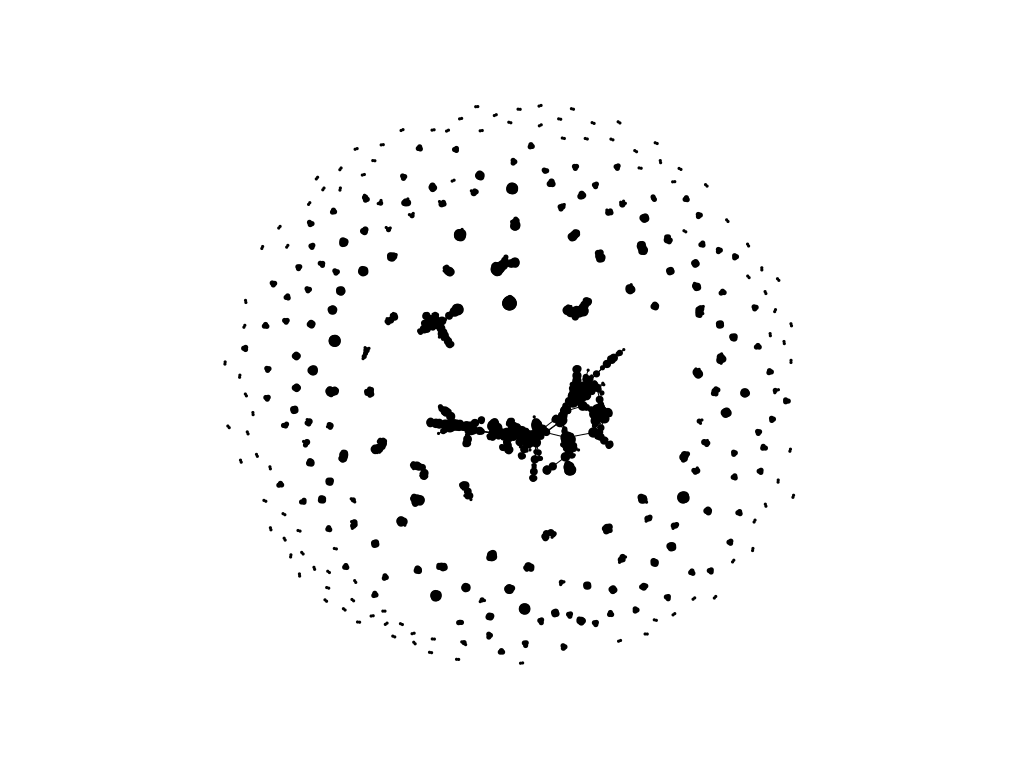
Another method, the Kamada Kawai algorithm, relies on the simulation of springs between each vertex, which strength is determined by the length of the shortest path between both vertices. The potential energy of each vertex, ie the sum of the energy of all its springs, is then computed. The goal being to reduce the global energy of the layout, each vertex is moved step-by-step until its potential energy is considered low-enough, using a Newton-Raphson algorithm.
Implementation
This implementation of Fruchterman-Reingold starts by positioning all vertices on a circle as this appears to favor "unmangling" compared to random positions. The radius of the circle is alway 1.0, and all further computations are performed with floating point values, without knowledge of the canvas dimensions. In consequence, contrary to the original Fruchterman-Reingold algorithm, no bound checking is performed, and the layout can spread constraint-free. The final result is then scaled to fit into the canvas dimensions.
A Kamada-Kawai algorithm is also provided, mostly for comparison purpose. Its complexity makes it rather unsuitable for larger graphs.
Results
Click for full-scale image
K6 graph
| Fruchterman-Reingold | Kamada-Kawai | Graphviz |
|---|---|---|
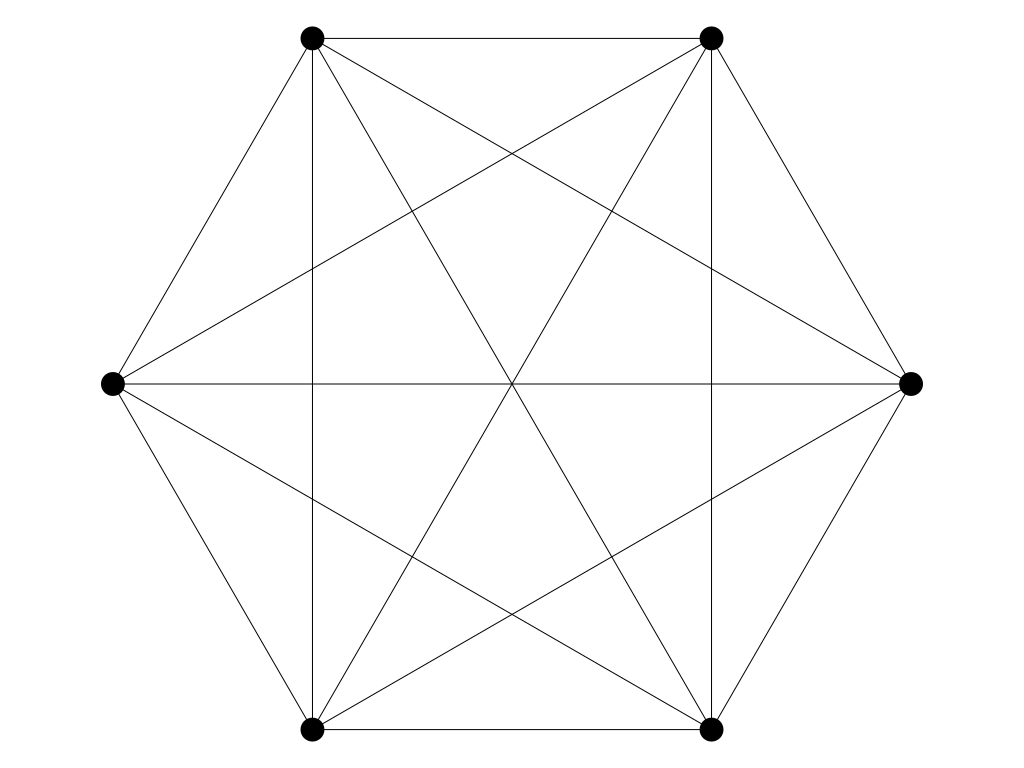 |
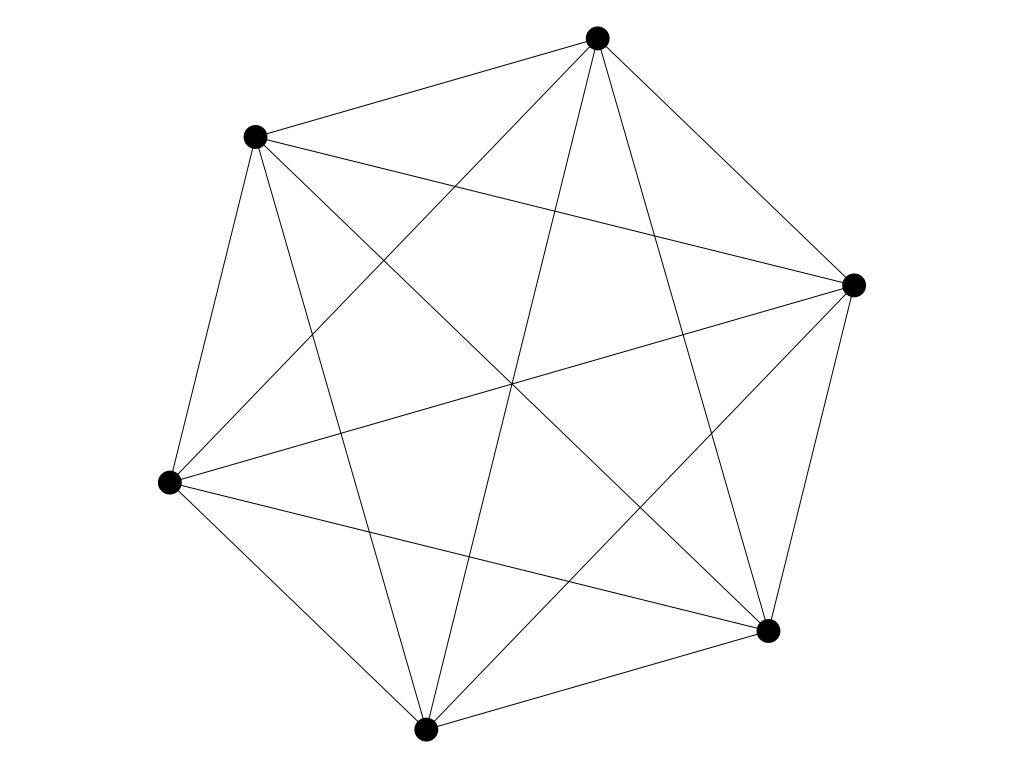 |
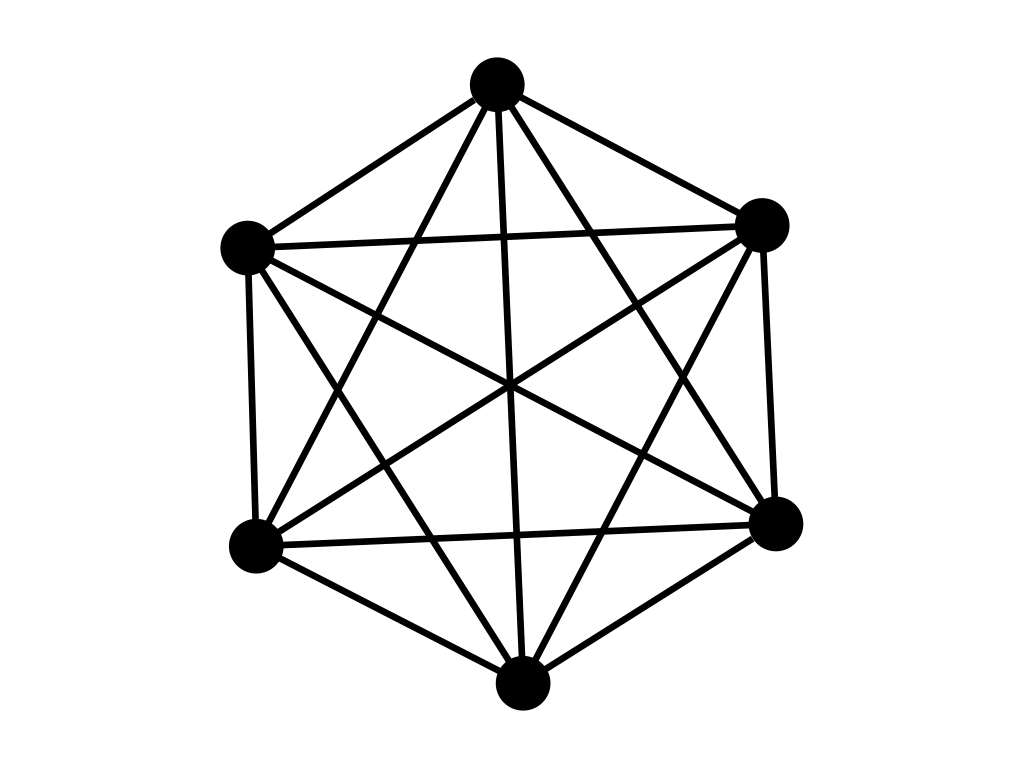 |
| x.xxs | x.xxs | x.xxs |
DOT file from graphs.grevian.org
Small dense graph
| Fruchterman-Reingold | Kamada-Kawai | Graphviz |
|---|---|---|
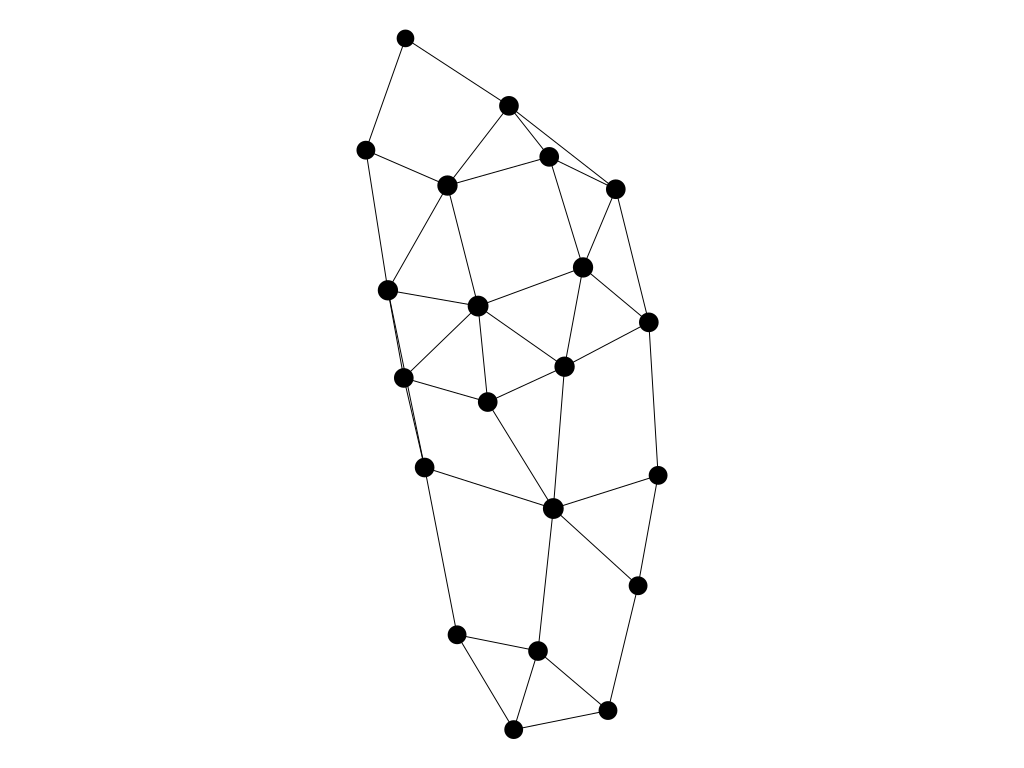 |
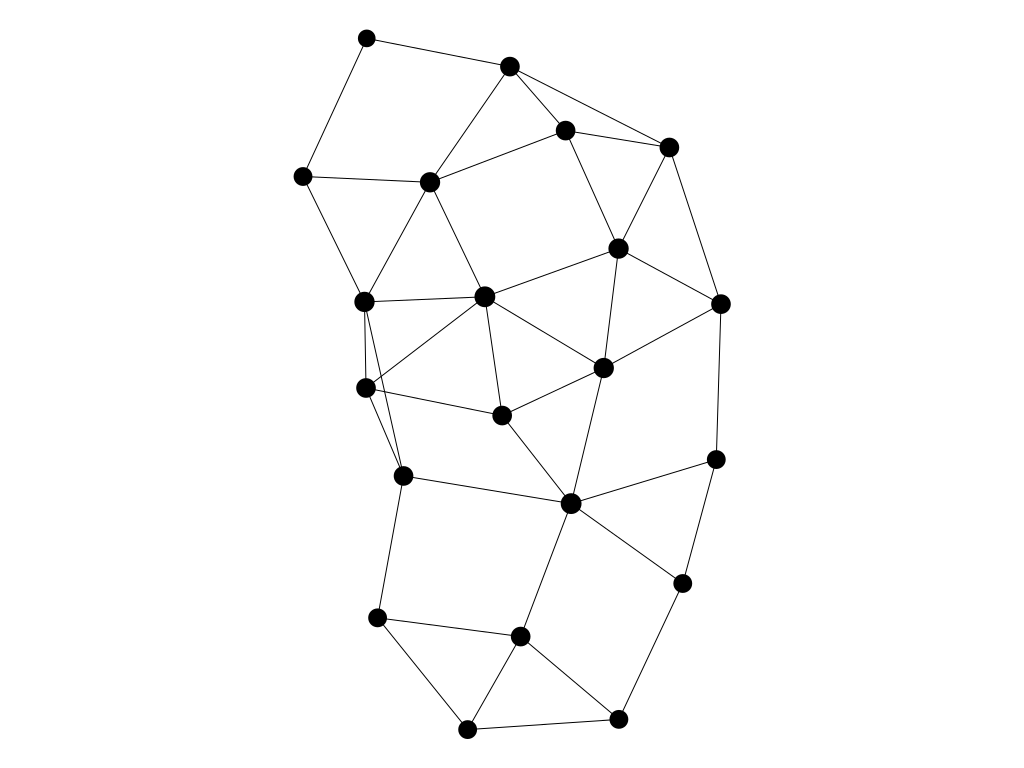 |
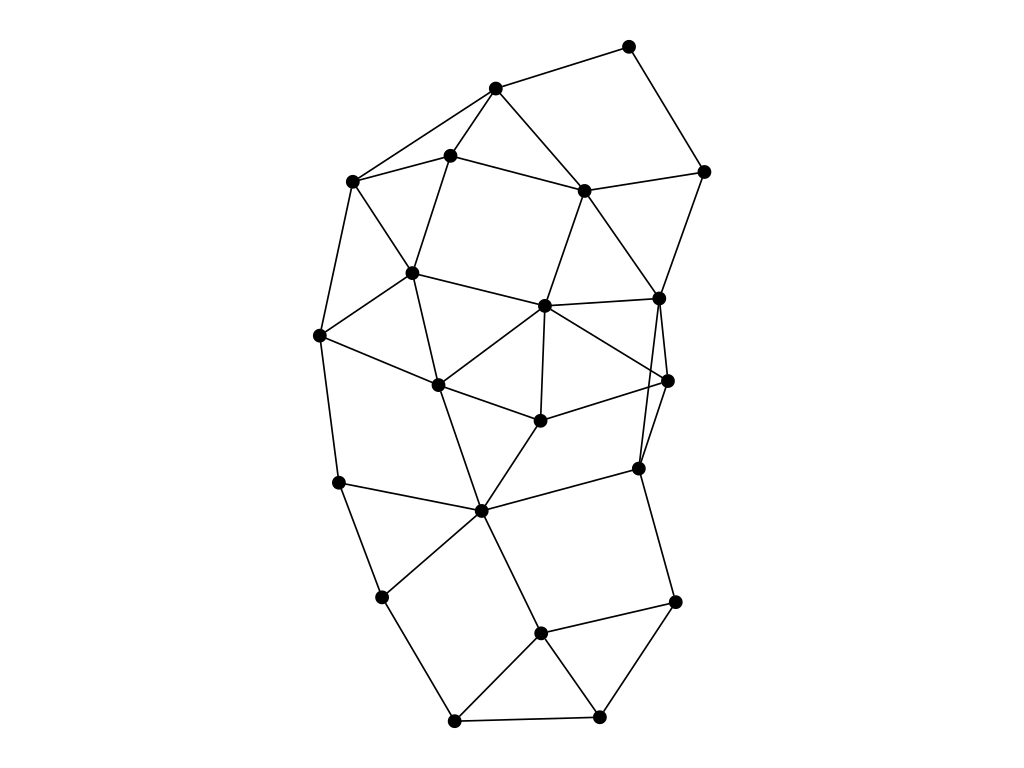 |
| x.xxs | x.xxs | x.xxs |
DOT file from graphs.grevian.org
Binary tree
| Fruchterman-Reingold | Kamada-Kawai | Graphviz |
|---|---|---|
 |
 |
 |
| x.xxs | x.xxs | x.xxs |
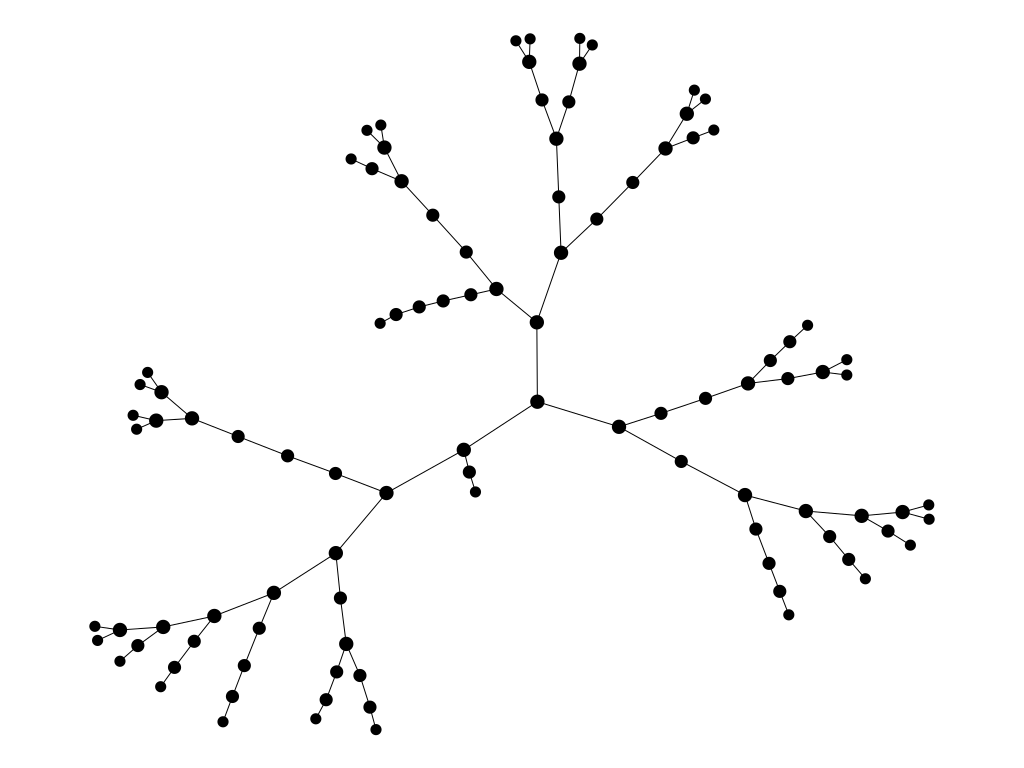
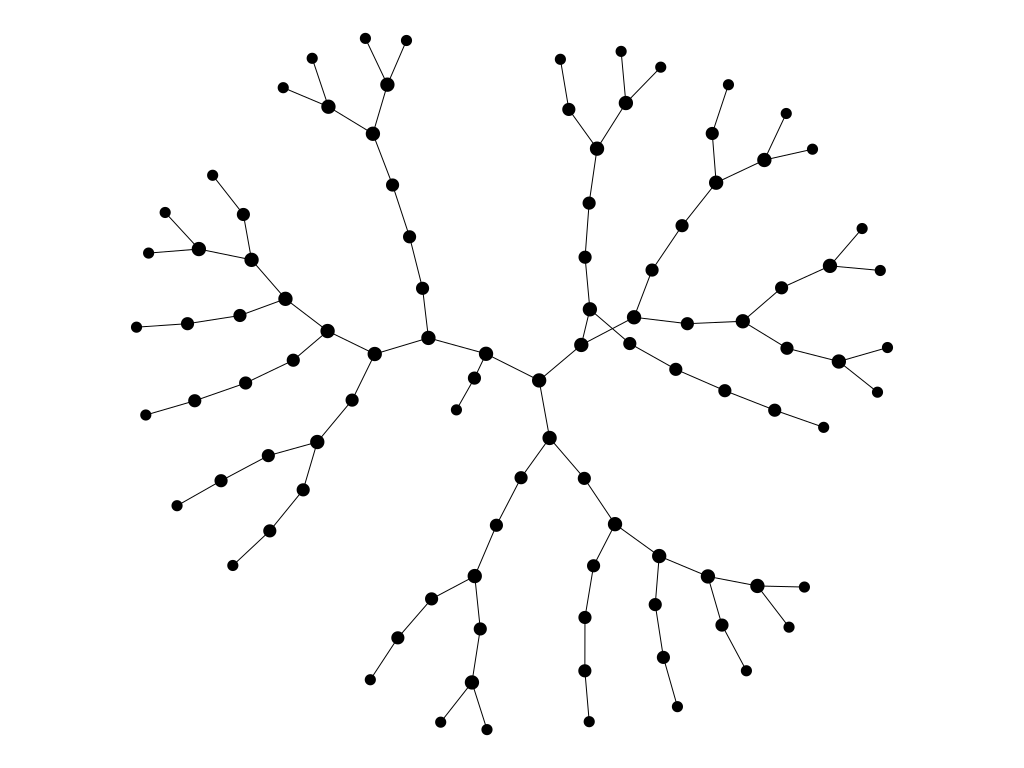
Quad tree
| Fruchterman-Reingold | Kamada-Kawai | Graphviz |
|---|---|---|
 |
 |
 |
| x.xxs | x.xxs | x.xxs |
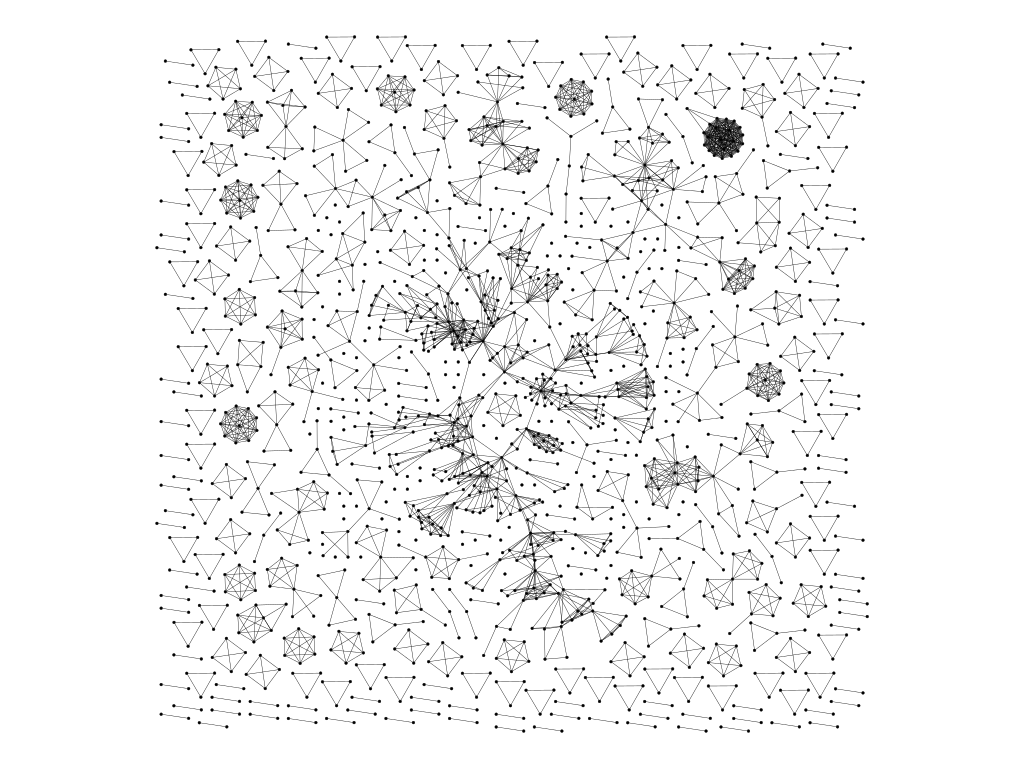
Large graph with disconnected components
| Fruchterman-Reingold | Graphviz |
|---|---|
 |
 |
| x.xxs | x.xxs |
GML file from gephi based on dataset by M. E. J. Newman
It might take some twiddling with the k parameter (a constant used to compute attractive and repulsive forces between vertices), as well as of the number of iterations, in order to get a layout perfectly free of edge-crossing. A better solution could be to introduce a "fine-tuning" phase during which we slightly raise again the temperature (and possibly the k value?) so as to shake the layout a bit before cooling it down again.
