Netdata Influx Save Abandoned
Netdata ➡️ InfluxDB metrics exporter & Grafana dashboard
Project README
Netdata to InfluxDB exporter
- GitHub: https://github.com/terorie/netdata-influx
- Grafana: https://grafana.com/grafana/dashboards/10922
- Zero-config, no need to modify netdata settings
- Uses the Netdata V1 API to pull data (
dashboard_url + '/api') - Periodically writes data to InfluxDB
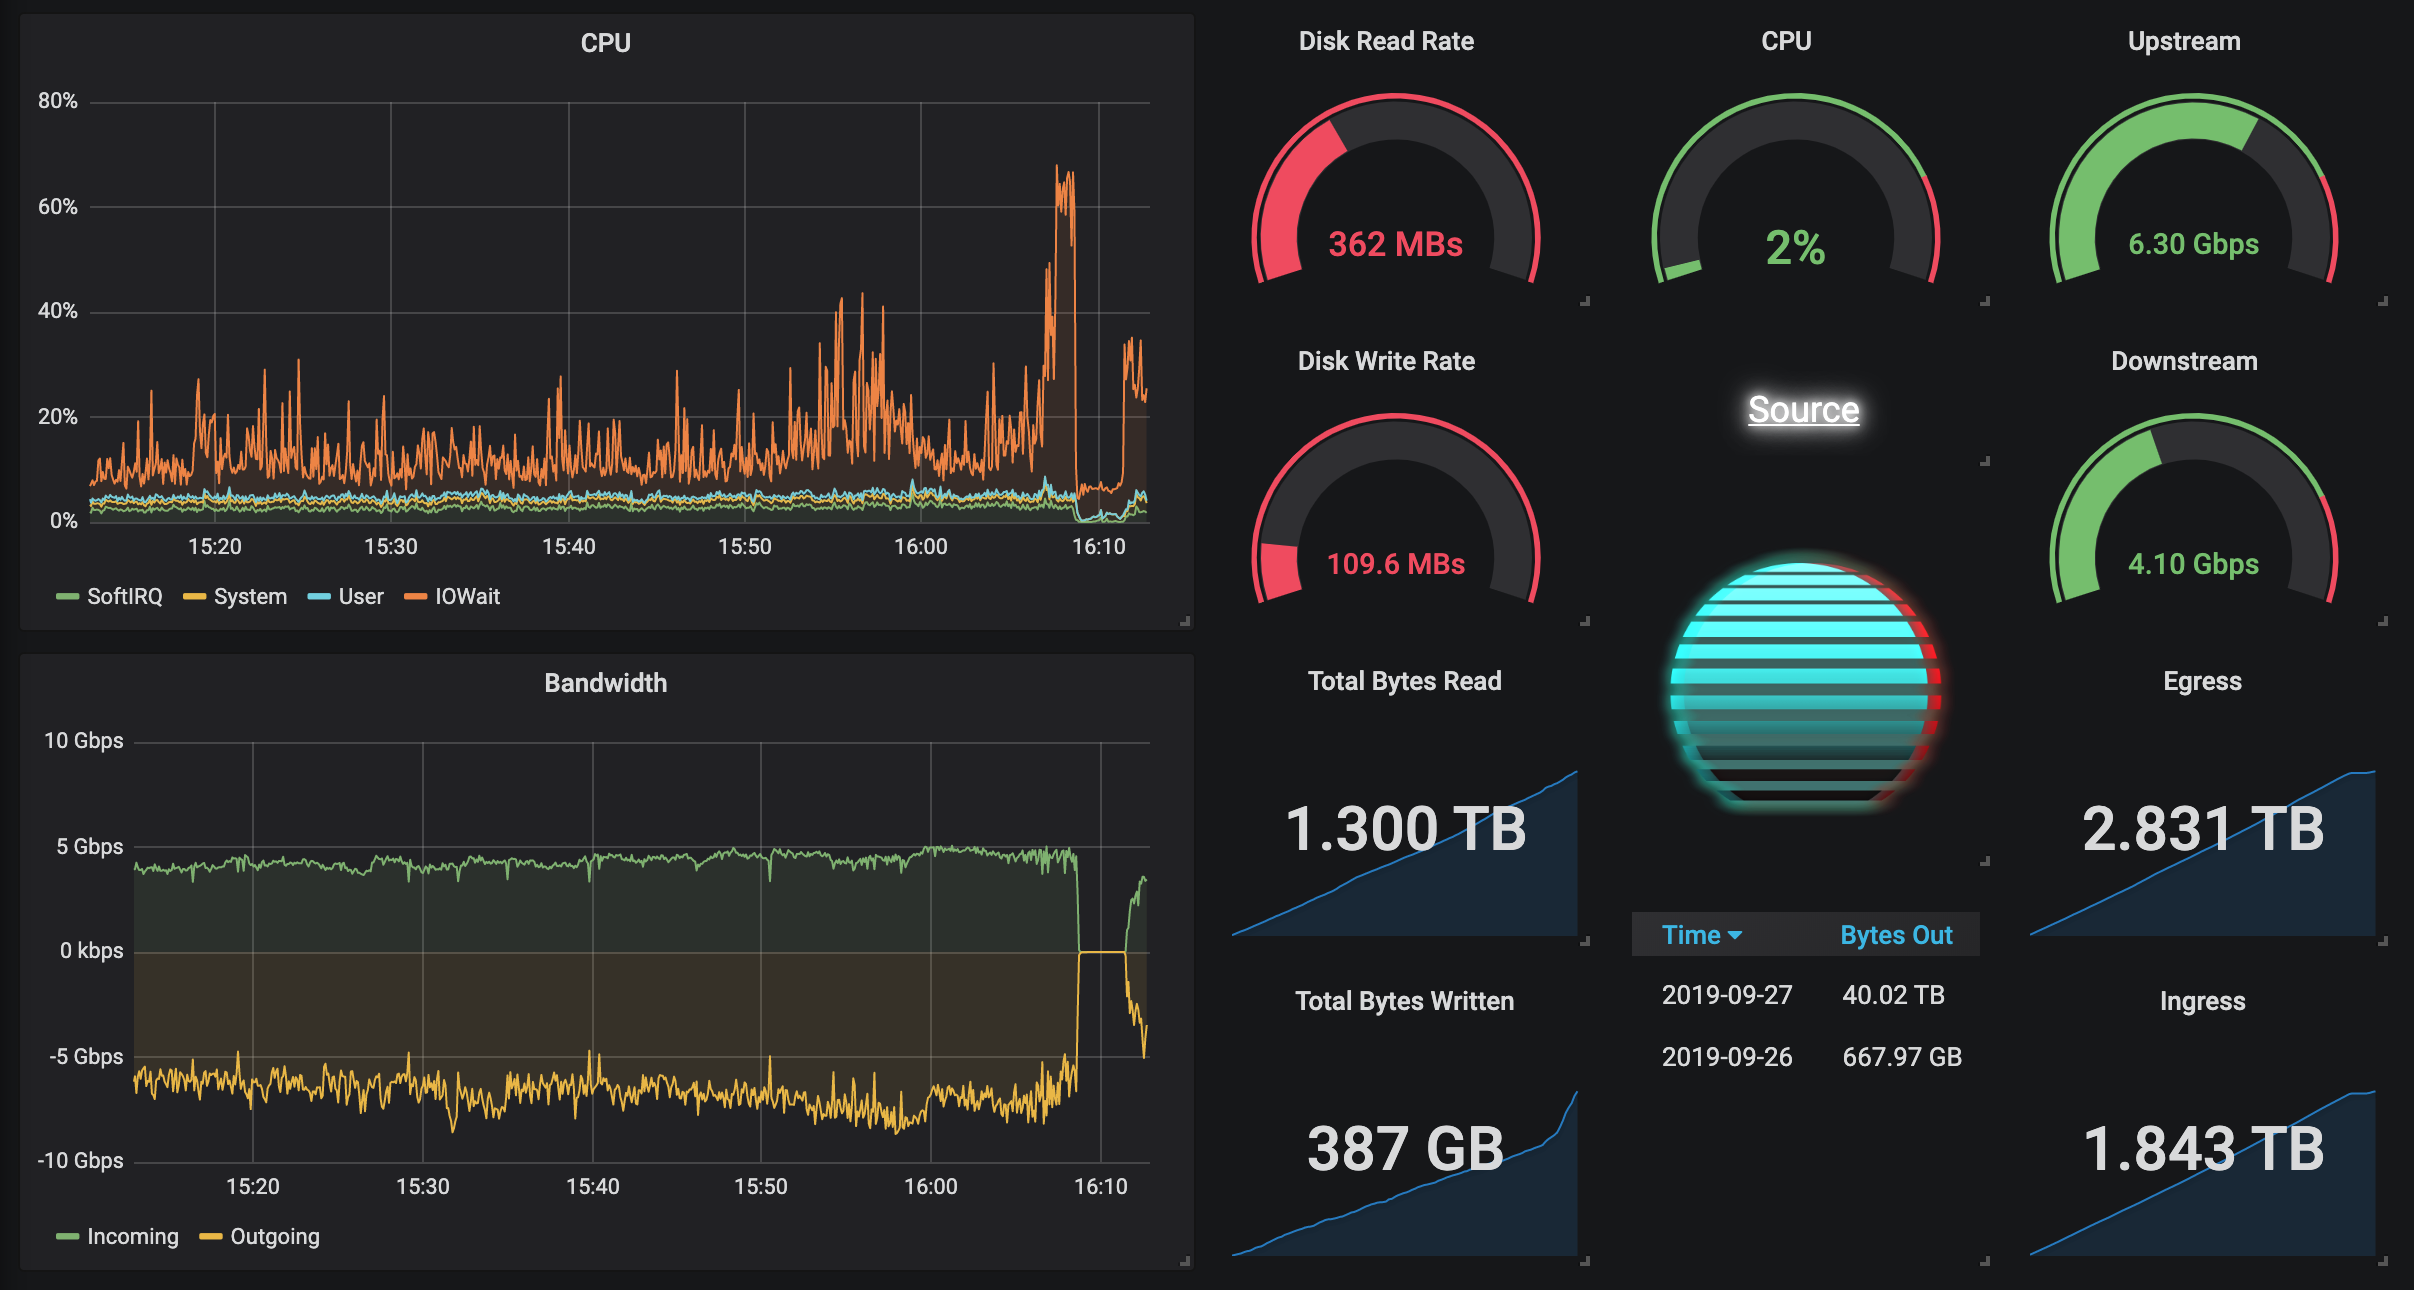
Showcase
Demo Page
Quickstart
Install InfluxDB, Netdata and Grafana using Docker Compose in under a minute!
GitHub Container Registry
A pre-built lightweight Docker image is available here:
ghcr.io/terorie/netdata-influx
Console:
# Create workspace
mkdir netdata; cd netdata

# Get docker-compose config
wget https://raw.githubusercontent.com/terorie/netdata-influx/master/quickstart/docker-compose.yml

# Start services
docker-compose up -d

# Create netdata database
curl -i -XPOST http://localhost:8086/query --data-urlencode "q=CREATE DATABASE netdata"
Grafana:
- Visit
http://<your_ip>:3000 - Login with
admin:admin - Add InfluxDB datasource
- URL:
http://influxdb:8086, or with authhttp://user:pass@influxdb:8086 - Details > Database:
netdata
- URL:
- Import dashboard with ID
10922(help)
Exporter Configuration
To change settings or add more charts, use these config variables
| var | meaning | default |
|---|---|---|
$NI_LOG_TIMESTAMPS |
Include timestamps in log | "true" |
$NI_INFLUX_ADDR |
Influx URL | — |
$NI_INFLUX_DB |
Influx database | — |
$NI_REFRESH_RATE |
Netdata polling rate | "10s" |
$NI_NETDATA |
Netdata API URL | — |
$NI_HOST_TAG |
Influx host tag (recommended) | $NI_NETDATA |
$NI_CHARTS |
Space-separated list of charts to monitor | system.cpu system.net system.pgpgio |
$NI_POINTS |
Number of points to fetch (0 for all) | 0 |
Open Source Agenda is not affiliated with "Netdata Influx" Project. README Source: terorie/netdata-influx
Stars
31
Open Issues
2
Last Commit
9 months ago
License
