MultiQC Versions Save
Aggregate results from bioinformatics analyses across many samples into a single report.
v1.21
2 months agoHighlights
Box plot
Added a new plot type: box plot. It's useful to visualise a distribution when you have a set of values for each sample.
from multiqc.plots import box
self.add_section(
    ...,
    plot=box.plot(
        {
            "sample 1": [4506, 4326, 3137, 1563, 1730, 3254, 2259, 3670, 2719, ...],
            "sample 2": [2145, 2011, 3368, 2132, 1673, 1993, 6635, 1635, 4984, ...],
            "sample 3": [1560, 1845, 3247, 1701, 2829, 2775, 3179, 1724, 1828, ...],
        },
        pconfig={
            "title": "Iso-Seq: Insert Length",
        },
    )
)
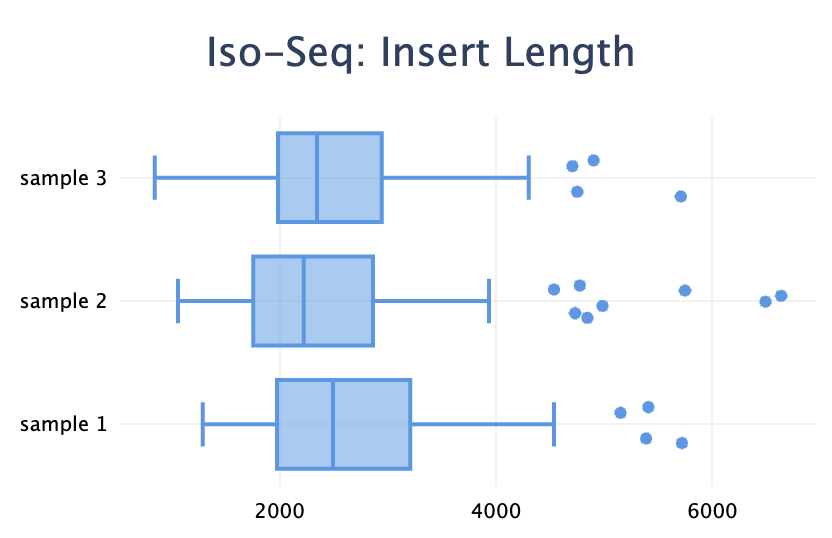
Note the difference with the violin plot: the box plot visualises the distributions of many values within one sample, whereas the violin plot shows the distribution of one metric across many samples.
pyproject.toml
The setup.py file has been superseded by pyproject.toml for the build configuration.
Note that now for new modules, an entry point should be added to pyproject.toml instead of setup.py, e.g.:
[project.entry-points."multiqc.modules.v1"]
afterqc = "multiqc.modules.afterqc:MultiqcModule"
Heatmap
The heatmap plot now supports passing a dict as input data, and also supports a zlab
parameter to set the label for the z-axis:
from multiqc.plots import heatmap
self.add_section(
    ...,
    plot=heatmap.plot(
        {
            "sample 1": {"sample 2": 0, "sample 3": 1},
            "sample 2": {"sample 1": 0, "sample 3": 0},
            "sample 3": {"sample 1": 1, "sample 2": 0, "sample 3": 1},
        },
        pconfig={
            "title": "Sample comparison",
            "zlab": "Match",
        },
    )
)
MultiQC updates
- New plot type: box plot (#2358)
- Add "Export to CSV" button for tables (#2394)
- Replace
setup.pywithpyproject.toml(#2353) - Heatmap: allow a dict dicts of data (#2386)
- Heatmap: add
zlabconfig parameter. Showxlab,ylab,zlabin tooltip (#2387) - Warn if
run_modulescontains a non-existent module (#2322) - Catch non-hashable values (dicts, lists) passed as a table cell value (#2348)
- Always create JSON even when MegaQC upload is disabled (#2330)
- Use generic font family for Plotly (#2368)
- Use a padded span with
nowrapinstead of before suffixes in table cells (#2395) - Refactor: fix unescaped regex strings (#2384)
Fixes:
- Pin the required Plotly version and add a runtime version check (#2325)
- Bar plot: preserve the sample order (#2339)
- Bar plot: fix inner gap in group mode (#2321)
- Violin: filter
Infvalues (#2380) - Table: Fix use of the
no_violin(ex-no_beeswarm) table config flag (#2376) - Heatmap: prevent from parsing numerical sample names (#2349)
- Work around call of
full_figure_for_developmentto avoid Kaleido errors (#2359) - Auto-generate plot
idwhenpconfig=None(#2337) - Fix: infinite
dmaxordminfail JSON dump load in JavaScript (#2354) - Fix: dump
pconfigfor MegaQC (#2344)
New modules
-
IsoSeq
- Iso-Seq contains the newest tools to identify transcripts in PacBio single-molecule sequencing data (HiFi reads).
clusterandrefinecommands are supported.
- Iso-Seq contains the newest tools to identify transcripts in PacBio single-molecule sequencing data (HiFi reads).
-
Space Ranger
- Works with data from 10X Genomics Visium. Processes sequencing reads and images created using the 10x Visium platform to generate count matrices with spatial information.
- New MultiQC module parses Space Ranger quality reports.
Module updates
- bcl2fastq: fix the top undetermined barcodes plot (#2340)
- DRAGEN: add few coverage metrics in general stats (#2341)
- DRAGEN: fix showing the number of found samples (#2347)
-
DRAGEN: support
gvcf_metrics(#2327) - fastp: fix detection of JSON files (#2334)
-
HTSeq Count: robust file reading loop, ignore
.parquetfiles (#2364) -
Illumina InterOp Statistics: do not set
'scale': Falseas a default (#2350) - mosdepth: fix regression in showing general stats (#2346)
-
Picard: Crosscheck Fingerprints updates (#2388)
- add a heatmap for LOD scores besides a table
- if too many pairs in table, skip those with
Expectedstatus - use the
warnstatus forInconclusive - add a separate sample-wise table instead of general stats
- sort tables by status, not by sample name
- add a column "Best match" and "Best match LOD" in tables
- hide the LOD Threshold column
-
PURPLE: support v4.0.1 output without
versioncolumn (#2366) -
Samtools: support new
coveragecommand (#2356) -
UMI-tools: support new
extractcommand (#2296) - Whatshap: make robust when a stdout is appended to TSV (#2361)
New Contributors
- @grst made their first contribution in https://github.com/MultiQC/MultiQC/pull/1945
Full Changelog: https://github.com/MultiQC/MultiQC/compare/v1.20...v1.21
v1.20
3 months agoHighlights
New plotting library
MultiQC v1.20 comes with totally new plotting code for MultiQC reports. This is a huge change to the report output. We've done our best to maintain feature parity with the previous plotting code, but please do let us know if you spot any bugs or changes in behaviour by creating a GitHub issue.
This change comes with many improvements and new features, and paves the way for more in the future. To find out more, read the associated blog post.
For now, you can revert to the previous plotting code by using the highcharts report template (multiqc --template highcharts). This will be removed in v1.21.
Note that there are several plotting configuration options which have been removed:
-
click_func -
cursor -
tt_percentages(usett_suffix: "%") - Bar plot:
-
use_legend(automatically hidden if there is only 1 category)
-
- Line plot:
-
labelSize -
xDecimals,yDecimals(automatic if all values can be cast to int) -
xLabelFormat,yLabelFormat(usett_label) -
pointFormat
-
- Heatmap:
-
datalabel_colour -
borderWidth
-
Moved GitHub and docker repositories
The v1.20 release is also the first release we've had since we moved the MultiQC repositories. Please note that the code is now at MultiQC/MultiQC (formerly ewels/MultiQC) and the same for the Docker repository. The GitHub repo should automatically redirect, but it's still good to update any references you may have.
MultiQC updates
- Support Plotly as a new backend for plots (#2079)
- The default template now uses Plotly for all plots
- Added a new plot type
violin(replacesbeeswarm) - Moved legacy Highcharts/Matplotlib code under an optional template
highcharts(#2292)
- Move GitHub repository to
MultiQCorganisation (#2243) - Update all GitHub actions to their latest versions (#2242)
- Update docs to work with Astro 4 (#2256)
- Remove unused dependency on
futurelibrary (#2258) - Fix incorrect scale IDs caught by linting (#2272)
- Docs: fix missing
vprefix in docker image tags (#2273) - Unicode file reading errors: attempt to skip non-unicode characters (#2275)
- Heatmap: check if value is numeric when calculating min and max (#2276)
- Add
filesearch_file_sharedconfig option, remove unnecessary per-modulesharedflags in search patterns (#2227) - Use alternative method to walk directory using pathlib (#2277)
- Export
config.output_dirin MegaQC JSON (#2287) - Drop support for module tags (#2278)
- Pin
Pillowpackage, wrap add_logo in try-except (#2312) - Custom content: support multiple datasets (#2291)
- Configuration: fix reading config.output_fn_name and --filename (#2314)
New modules
-
Bamdst (#2161)
- Bamdst is a lightweight tool to stat the depth coverage of target regions of bam file(s).
-
MetaPhlAn (#2262)
- MetaPhlAn is a computational tool for profiling the composition of microbial communities from metagenomic shotgun sequencing data.
-
MEGAHIT (#2222)
- MEGAHIT is an ultra-fast and memory-efficient NGS assembler
-
Nonpareil (#2215)
- Estimate metagenomic coverage and sequence diversity.
Module updates
- Bcftools: order variant depths plot categories (#2289)
-
Bcftools: add missing
self.ignore_samplesin stats (#2288) - BCL Convert: add index, project names to sample statistics and calculate mean quality for lane statistics. (#2261)
-
BCL Convert: fix duplicated
yieldfor 3.9.3+ when the yield is provided explicitly in Quality_Metrics (#2253) - BCL Convert: handle samples with zero yield (#2297)
- Bismark: fix old link in Bismark docs (#2252)
- Bismark: fix old link in docs (#2252)
- Cutadapt: support JSON format (#2281)
- HiFiasm: account for lines with no asterisk (#2268)
- HUMID: add cluster statistics (#2265)
- mosdepth: add additional summaries to general stats #2257 (#2257)
-
Picard: fix using multiple times in report: do not pass
module.anchortoself.find_log_files(#2255) - QualiMap: address NBSP as thousands separators (#2282)
- Seqera Platform CLI: updates for v0.9.2 (#2248)
- Seqera Platform CLI: handle failed tasks (#2286)
New Contributors
- @a-detiste made their first contribution in https://github.com/MultiQC/MultiQC/pull/2258
- @mbeavitt made their first contribution in https://github.com/MultiQC/MultiQC/pull/2268
- @almahans made their first contribution in https://github.com/MultiQC/MultiQC/pull/2262
- @kmlhpk made their first contribution in https://github.com/MultiQC/MultiQC/pull/2273
- @studioph made their first contribution in https://github.com/MultiQC/MultiQC/pull/2277
- @vsmalladi made their first contribution in https://github.com/MultiQC/MultiQC/pull/1503
Full Changelog: https://github.com/MultiQC/MultiQC/compare/v1.19...v1.20
v1.19
5 months agoHighlights
An early Christmas present 🎁 Happy holidays everyone! 🎄
This release is mostly bugfixes and minor additions, whilst we lay the groundwork for some bigger updates coming in the new year. Still, there are plenty of goodies in here. Enjoy!
See the full changes in this release here: https://github.com/ewels/MultiQC/compare/v1.18...v1.19
MultiQC updates
- Add missing table
idin DRAGEN modules, and requireidin plot configs in strict mode (#2228) - Config
table_columns_visibleandtable_columns_name: support flat config andtable_idas a group (#2191) - Add
sort_samples: falseconfig option for bar graphs (#2210) - Upgrade the jQuery tablesorter plugin to v2 (#1666)
- Refactor pre-Python-3.6 code, prefer f-strings over
.format()calls (#2224) - Allow specifying default sort columns for tables with
defaultsort(#1667) - Create CODE_OF_CONDUCT.md (#2195)
- Add
.cramto sample name cleaning defaults (#2209)
MultiQC bug fixes
- Re-add
runinto themultiqcnamespace (#2202) - Fix the
"square": Trueflag to scatter plot to actually make the plot square (#2189) - Fix running with the
--no-reportflag (#2212) - Fix guessing custom content plot type: do not assume first row of a bar plot data are sample names (#2208)
- Fix detection of changed specific module in Changelog CI (#2234)
Module updates
- BCLConvert: fix mean quality, fix count-per-lane bar plot (#2197)
-
deepTools: handle missing data in
plotProfile(#2229) - Fastp: search content instead of file name (#2213)
-
GATK: square the
BaseRecalibratorscatter plot (#2189) - HiC-Pro: add missing search patterns and better handling of missing data (#2233)
-
Kraken: fix
UnboundLocalError(#2230) - Kraken: fixed column keys in genstats (#2205)
-
QualiMap: fix
BamQCfor global-only stats (#2207) -
Picard: add more search patterns for
MarkDuplicates, includingMarkDuplicatesSpark(#2226) -
Salmon: add
library_types,compatible_fragment_ratio,strand_mapping_biasto the general stats table (#1485)
New Contributors
- @gsmashd made their first contribution in https://github.com/ewels/MultiQC/pull/2205
- @kclem made their first contribution in https://github.com/ewels/MultiQC/pull/2235
Full Changelog: https://github.com/ewels/MultiQC/compare/v1.18...v1.19
v1.18
6 months agoHighlights
Better configs
As of this release, you can now set all of your config variables via environment variables! (see docs).
Better still, YAML config files can now use string interpolation to parse environment variables within strings (see docs), eg:
report_header_info:
  - Contact E-mail: !ENV "${NAME:info}@${DOMAIN:example.com}"
Picard refactoring
In this release, there was a significant refactoring of the Picard module. It has been generalized for better code sharing with other Picard-based software, like Sentieon and Parabricks. As a result of this, the standalone Sentieon module was removed: Sentieon QC files will be interpreted directly as Picard QC files.
If you were using the Sentieon module in your pipelines, make sure to update any places that reference the module name:
- MultiQC command line (e.g. replace
--module sentieonwith--module picard). - MultiQC configs (e.g. replace
sentieonwithpicardin options likerun_modules,exclude_modules,module_order). - Downstream code that relies on names of the files in
multiqc_dataormultiqc_plotssaves (e.g.,multiqc_data/multiqc_sentieon_AlignmentSummaryMetrics.txtbecomesmultiqc_data/multiqc_picard_AlignmentSummaryMetrics.txt). - Code that parses data files like
multiqc_data/multiqc_data.json. - Custom plugins and templates that rely on HTML anchors (e.g.
#sentieon_aligned_readsbecomes#picard_AlignmentSummaryMetrics). - Also, note that Picard fetches sample names from the commands it finds inside the QC headers (e.g.
# net.sf.picard.analysis.CollectMultipleMetrics INPUT=Szabo_160930_SN583_0215_AC9H20ACXX.bam ...->Szabo_160930_SN583_0215_AC9H20ACXX), whereas the removed Sentieon module prioritized the QC file names. To revert to the old Sentieon approach, use theuse_filename_as_sample_nameconfig flag.
MultiQC updates
- Config can be set with environment variables, including env var interpolation (#2178)
- Try find config in
~/.configor$XDG_CONFIG_HOME(#2183) - Better sample name cleaning with pairs of input filenames (#2181)
- Software versions: allow any string as a version tag (#2166)
- Table columns with non-numeric values and now trigger a linting error if
scaleis set (#2176) - Stricter config variable typing (#2178)
- Remove
position:absoluteCSS from table values (#2169) - Fix column sorting in exported TSV files from a matplotlib linegraph plot (#2143)
- Fix custom anchors for kraken (#2170)
- Fix logging spillover bug (#2174)
New Modules
-
Seqera Platform CLI (#2151)
- Seqera Platform CLI reports statistics generated by the Seqera Platform CLI.
-
Xenome (#1860)
- A tool for classifying reads from xenograft sources.
-
xengsort (#2168)
- xengsort is a fast xenograft read sorter based on space-efficient k-mer hashing
Module updates
- fastp: add version parsing (#2159)
-
fastp: correctly parse sample name from
--in1/--in2in bash command. Prefer file name if notfastp.json; fallback to file name when error (#2139) -
Kaiju: fix
division by zeroerror (#2179) -
Nanostat: account for both tab and spaces in
v1.41+search pattern (#2155) - Pangolin: update for v4: add QC Note , update tool versions columns (#2157)
- Picard: Generalize to directly support Sentieon and Parabricks outputs (#2110)
-
Sentieon: Removed the module in favour of directly supporting parsing by the Picard module (#2110)
- Note that any code that relies on the module name needs to be updated, e.g.
-m sentieonwill no longer work - The exported plot and data files will be now be prefixed as
picardinstead ofsentieon, etc. - Note that the Sentieon module used to fetch the sample names from the file names by default, and now it follows the Picard module's logic, and prioritizes the commands recorded in the logs. To override, use the
use_filename_as_sample_nameconfig flag
- Note that any code that relies on the module name needs to be updated, e.g.
v1.17
7 months agoThe one with the new logo
Highlights:
- Introducing the new MultiQC logo!
- Adding support for Python 3.12 and dropping support for Python 3.7
- New
--require-logsto fail if expected tool outputs are not found - Rename
--lintto--strict - Modules should now use
ModuleNotFoundErrorinstead ofUserWarningwhen no logs are found - 2 new modules and updates to 9 modules.
MultiQC updates
- Add CI action changelog.yml to populate the changelog from PR titles, triggered by a comment
@multiqc-bot changelog(#2025, #2102, #2115) - Add GitHub Actions bot workflow to fix code linting from a PR comment (#2082)
- Use custom exception type instead of
UserWarningwhen no samples are found. (#2049) - Lint modules for missing
self.add_software_version(#2081) - Strict mode: rename
config.linttoconfig.strict, crash early on module or template error. AddMULTIQC_STRICT=1(#2101) - Matplotlib line plots now respect
xLog: TrueandyLog: Truein config (#1632) - Fix matplotlib linegraph and bargraph for the case when
xmax<xminin config (#2124) - Add
--require-logsflag to error out if requested modules not used (#2109) - Fixes for python 3.12
- Drop Python 3.6 and 3.7 support, add 3.12 (#2121)
- Just run CI on the oldest + newest supported Python versions (#2074)
-
 New logo
 - Set name and anchor for the custom content "module" #2131
- Fix use of
shutil.copytreewhen overriding existing template files intmp_dir(#2133)
New Modules
-
Bracken
- A highly accurate statistical method that computes the abundance of species in DNA sequences from a metagenomics sample.
-
Truvari (#1751)
- Truvari is a toolkit for benchmarking, merging, and annotating structural variants
Module updates
- Dragen: make sure all inputs are recorded in multiqc_sources.txt (#2128)
- Cellranger: Count submodule updated to parse Antibody Capture summary (#2118)
- fastp: parse unescaped sample names with white spaces (#2108)
- FastQC: Add top overrepresented sequences table (#2075)
- HiCPro: Fix parsing scientific notation in hicpro-ashic. Thanks @Just-Roma (#2126)
- HTSeq Count: allow counts files with more than 2 columns (#2129)
- mosdepth: fix prioritizing region over global information (#2106)
- Picard: Adapt WgsMetrics to parabricks bammetrics outputs (#2127)
-
Picard: MarkDuplicates: Fix parsing mixed strings/numbers, account for missing trailing
0(#2083, #2094) - Samtools: Add MQ0 reads to the Percent Mapped barplot in Stats submodule (#2123)
- WhatsHap: Process truncated input with no ALL chromosome (#2095)
v1.16
7 months agoHighlight: Reporting software versions
New in v1.16 - software version information can now automatically parsed from log output where available, and added to MultiQC in a standardised manner. It's shown in the MultiQC report next to section headings and in a dedicated report section, as well as being saved to multiqc_data. Where version information is not available in logs, it can be submitted manually by using a new special file type with filename pattern *_mqc_versions.yml. There's the option of representing groups of versions, useful for a tool that uses sub-tools, or pipelines that want to report version numbers per analysis step.
There are a handful of new config scopes to control behaviour: software_versions, skip_versions_section, disable_version_detection, versions_table_group_header.
See the documentation for more (writing modules, supplying stand-alone)
Huge thanks to @pontushojer for the contribution (#1927). This idea goes way back to issue #290, made in 2016! 🎉
MultiQC updates
- Removed
simplejsonunused dependency (#1973) - Give config
custom_plot_configpriority over column-specific settings set by modules - When exporting plots, make a more clear error message for unsupported FastQC dot plot (#1976)
- Fixed parsing of
plot_type: "html"datain json custom content - Replace deprecated
pkg_resources -
Fix the module groups configuration for modules where the namespace is passed explicitly to
general_stats_addcols. Namespace is now always appended to the module name in the general stats (2037). - Do not call
sys.exit()in themultiqc.run()function, to avoid breaking interactive environments. #2055 - Fixed the DOI exports in
multiqc_datato include more than just the MultiQC paper (#2058) - Fix table column color scaling then there are negative numbers (1869)
- Export plots as static images and data in a ZIP archive. Fixes the issue when only 10 plots maximum were downloaded due to the browser limitation.
New Modules
-
Bakta
- Rapid and standardized annotation of bacterial genomes, MAGs & plasmids.
-
mapDamage
- mapDamage2 is a computational framework written in Python and R, which tracks and quantifies DNA damage patterns among ancient DNA sequencing reads generated by Next-Generation Sequencing platforms.
-
Sourmash
- Quickly search, compare, and analyze genomic and metagenomic data sets.
Module updates
-
BcfTools
- Stats: fix parsing multi-sample logs (#2052)
-
Custom content
- Don't convert sample IDs to floats (#1883)
-
DRAGEN
- Make DRAGEN module use
fn_clean_extsinstead of hardcoded file names. Fixes working with arbitrary file names (#1994)
- Make DRAGEN module use
-
FastQC:
- fix
UnicodeDecodeErrorwhen parsingfastqc_data.txt: try latin-1 or fail gracefully (#2024)
- fix
-
Kaiju:
- Fix
UnboundLocalErroron outputs when Kanju was run with the-eflag (#2023)
- Fix
- Kraken
-
Mosdepth
- Add X/Y relative coverage plot, analogous to the one in samtools-idxstats (#1978)
- Added the
perchrom_fraction_cutoffoption into the config to help avoid clutter in contig-level plots - Fix a bug happening when both
regionandglobalcoverage histograms for a sample are available (i.e. when mosdepth was run with--by, see mosdepth docs). In this case, data was effectively merged. Instead, summarise it separately and add a separate report section for the region-based coverage data. - Do not fail when all input samples have no coverage (#2005).
-
NanoStat
- Support new format (#1997).
- RSeQC
-
Samtools
- Stats: fix "Percent Mapped" plot when samtools was run with read filtering (#1972)
-
Qualimap
- BamQC: Include
% On Targetin General Stats table (#2019)
- BamQC: Include
-
WhatsHap
- Bugfix: ensure that TSV is only split on tab character. Allows sample names with spaces (#1981)
New Contributors
- @gdrosos made their first contribution in https://github.com/ewels/MultiQC/pull/1973
- @antass made their first contribution in https://github.com/ewels/MultiQC/pull/1991
- @lindenb made their first contribution in https://github.com/ewels/MultiQC/pull/1972
- @odcambc made their first contribution in https://github.com/ewels/MultiQC/pull/1968
- @ehenrion made their first contribution in https://github.com/ewels/MultiQC/pull/1855
- @louperelo made their first contribution in https://github.com/ewels/MultiQC/pull/1959
- @Joon-Klaps made their first contribution in https://github.com/ewels/MultiQC/pull/1903
- @sstrong99 made their first contribution in https://github.com/ewels/MultiQC/pull/1891
- @taylorreiter made their first contribution in https://github.com/ewels/MultiQC/pull/1812
- @FerriolCalvet made their first contribution in https://github.com/ewels/MultiQC/pull/2020
Full Changelog: https://github.com/ewels/MultiQC/compare/v1.15...v1.16
v1.15
9 months agoBig speedup in file search step
This release of MultiQC introduces speed improvements to the file search (~5-7x fold improvement) 🎉
One way it does this is by limiting the number of lines loaded by each search pattern. For the vast majority of users, this should have no effect except faster searches. However, in some edge cases it may introduce some breaking changes. Hypothetically, for example:
- If you concatenate log files from multiple tools
- If you have a custom plugin module that we haven't tested
See the troubleshooting docs for more information.
MultiQC updates
- Refactor file search for performance improvements (#1904)
- Bump
log_filesize_limitdefault (to skip large files in the search) from 10MB to 50MB. - Table code now tolerates lambda function calls with bad data (#1739)
- Beeswarm plot now saves data to
multiqc_data, same as tables (#1861) - Don't print DOI in module if it's set to an empty string.
- Don't sort table headers alphabetically if we don't have an
OrderedDict- regular dicts are fine in Py3 (#1866) - New back-end to preview + deploy the new website when the docs are edited.
- Fixed a lot of broken links in the documentation from the new website change in structure.
New Modules
-
Librarian
- A tool to predict the sequencing library type from the base composition of a supplied FastQ file.
Module updates
- Cell Ranger
- DRAGEN
-
filtlong
- Handle reports from locales that use
.as a thousands separator (#1843)
- Handle reports from locales that use
-
HUMID
- Fix bug that prevent HUMID stats files from being parsed (#1856)
-
Mosdepth
- Fix data not written to
mosdepth_cumcov_dist.txtandmosdepth_cov_dist.txt(#1868) - Update documentation with new file
{prefix}.mosdepth.summary.txt(#1868) - Fill in missing values for general stats table (#1868)
- Include mosdepth/summary file paths in
multiqc_sources.txt(#1868) - Enable log switch for Coverage per contig plot (#1868)
- Fix y-axis scaling for Coverage distribution plot (#1868)
- Handle case of intermediate missing coverage x-values in the
*_dist.txtfile causing a distorted Coverage distribution plot (#1960)
- Fix data not written to
- Picard
-
Porechop
- Don't render bar graphs if no samples had any adapters trimmed (#1850)
- Added report section listing samples that had no adapters trimmed
-
RSeQC
- Fix
ZeroDivisionErrorerror forbam_statresults when there are 0 reads (#1735)
- Fix
-
UMI-tools
- Fix bug that broke the module with paired-end data (#1845)
v1.14
1 year agoMultiQC new features
- Rewrote the
Dockerfileto build multi-arch images (amd64 + arm), run through a non-privileged user and build tools for non precompiled python binaries (#1541, #1541) - Add a new lint test to check that colour scale names are valid (#1835)
- Update github actions to run tests on a single module if it is the only file affected by the PR (#915)
- Add CI testing for Python 3.10 and 3.11
- Optimize line-graph generation to remove an n^2 loop (#1668)
- Parsing output file column headers is much faster.
MultiQC code cleanup
- Remove Python 2-3 compatability
from __future__imports - Remove unused
#!/usr/bin/env pythonhashbangs from module files - Add new code formatting tool isort to standardise the order and formatting of Python module imports
- Add Pycln pre-commit hook to remove unused imports
MultiQC updates
- Bugfix: Make
config.data_formatwork again (#1722) - Bump minimum version of Jinja2 to
>=3.0.0(#1642) - Disable search progress bar if running with
--quietor--no-ansi(#1638) - Allow path filters without full paths by trying to prefix analysis dir when filtering (#1308)
- Fix sorting of table columns with text values
- Don't crash if a barplot is given an empty list of categories (#1540)
- New logos! MultiQC is now developed and maintained at Seqera Labs. Updated logos and email addresses accordingly.
New Modules
-
Anglerfish
- A tool designed to assess pool balancing, contamination and insert sizes of Illumina library dry runs on Oxford Nanopore data.
-
BBDuk
- Combines most common data-quality-related trimming, filtering, and masking operations via kmers into a single high-performance tool.
-
Cell Ranger
- Works with data from 10X Genomics Chromium. Processes Chromium single cell data to align reads, generate feature-barcode matrices, perform clustering and other secondary analysis, and more.
- New MultiQC module parses Cell Ranger quality reports from VDJ and count analysis
-
DIAMOND
- A high-throughput program for aligning DNA reads or protein sequences against a protein reference database.
-
DRAGEN-FastQC
- Illumina Bio-IT Platform that uses FPGA for accelerated primary and secondary analysis
- Finally merged the epic 2.5-year-old pull request, with 3.5k new lines of code.
- Please report any bugs you find!
-
Filtlong
- A tool for filtering long reads by quality.
-
GoPeaks
- GoPeaks is used to call peaks in CUT&TAG/CUT&RUN datasets.
-
HiFiasm
- A haplotype-resolved assembler for accurate Hifi reads
-
HUMID
- HUMID is a tool to quickly and easily remove duplicate reads from FastQ files, with or without UMIs.
-
mOTUs
- Microbial profiling through marker gene (MG)-based operational taxonomic units (mOTUs)
-
Nextclade
- Tool that assigns clades to SARS-CoV-2 samples
-
Porechop
- A tool for finding and removing adapters from Oxford Nanopore reads
-
PRINSEQ++
- PRINSEQ++ is a C++ of
prinseq-lite.plprogram for filtering, reformating or trimming genomic and metagenomic sequence data.
- PRINSEQ++ is a C++ of
-
UMI-tools
- Work with Unique Molecular Identifiers (UMIs) / Random Molecular Tags (RMTs) and single cell RNA-Seq cell barcodes.
Module updates
- Bcftools stats
-
BclConvert
- Handle single-end read data correctly when setting cluster length instead of always assuming paired-end reads (#1697)
- Handle different R1 and R2 read-lengths correctly instead of assuming they are the same (#1774)
- Handle single-index paired-end data correctly
- Added a config option to enable the creation of barplots with undetermined barcodes (
create_unknown_barcode_barplotswithFalseas default) (#1709)
-
BUSCO
- Update BUSCO pass/warning/fail scheme to be more clear for users
-
Bustools
- Show median reads per barcode statistic
- Custom content
- fastp
-
FastQC
- Report median read-length for fastqc in addition to mean (#1745)
-
Kaiju
- Don't crash if we don't have any data for the top-5 barplot (#1540)
-
Kallisto
- Fix
ZeroDivisionErrorwhen a sample has zero reads (#1746)
- Fix
- Kraken
-
malt
- Fixed division by 0 in malt module (#1683)
-
miRTop
- Avoid
KeyError- don't assume all fields present in logs (#1778)
- Avoid
-
Mosdepth
- Don't pad the General Stats table with zeros for missing data (#1810)
-
Picard
- HsMetrics: Allow custom columns in General Stats too, with
HsMetrics_genstats_table_colsandHsMetrics_genstats_table_cols_hidden
- HsMetrics: Allow custom columns in General Stats too, with
- Qualimap
-
RSeQC
- Update
geneBody_coverageto plot normalized coverages using a similar formula to that used by RSeQC itself (#1792)
- Update
-
Sambamba Markdup
- Catch zero division in sambamba markdup (#1654)
-
Samtools
- Added additional column for
flagstatthat displays percentage of mapped reads in a bam (hidden by default) (#1733)
- Added additional column for
-
VEP
- Don't crash with
ValueErrorif there are zero variants (#1681)
- Don't crash with
v1.13
1 year agoMultiQC updates
- Major spruce of the command line help, using the new rich-click package
- Drop some of the Python 2k compatability code (eg. custom requirements)
- Improvements for running MultiQC in a Python environment, such as a Jupyter Notebook or script
- Fixed bug raised when removing logging file handlers between calls that arose when configuring the root logger with dictConfig (#1643)
- Added new config option
custom_table_header_configto override any config for any table header - Fixed edge-case bug in custom content where a
descriptionthat doesn't terminate in.gave duplicate section descriptions. - Tidied the verbose log to remove some very noisy statements and add summaries for skipped files in the search
- Add timezone to time in reports
- Add nix flake support
- Added automatic tweet about new releases
Module updates
-
AdapterRemoval
- Finally merge a fix for counts of reads that are discarded/collapsed (#1647)
-
VEP
- Fixed bug when
General Statisticshave a value of-(#1656)
- Fixed bug when
- Custom content
- Nanostat
-
Pangolin
- Updated module to handle outputs from Pangolin v4 (#1660)
-
Somalier
- Handle zero mean X depth in Sex plot (#1670)
-
Fastp
- Include low complexity and too long reads in filtering bar chart
- miRTop
-
FastQC
- Fixed error when parsing duplicate ratio when there is
nanvalues in the report. (#1725)
- Fixed error when parsing duplicate ratio when there is
v1.12
2 years agoVersion 1.12 of MultiQC brings with it a modest number of new modules, a few new core features and a swathe of bugfixes and general improvements. I hope that everyone continues to find it useful! You can see the full changes in this release here: https://github.com/ewels/MultiQC/compare/v1.11...v1.12
Special thanks to the 13 people who had their first MultiQC contributions in this release:
New Contributors
- @HofLucien made their first contribution in https://github.com/ewels/MultiQC/pull/1486
- @jchorl made their first contribution in https://github.com/ewels/MultiQC/pull/1578
- @bjohnnyd made their first contribution in https://github.com/ewels/MultiQC/pull/1489
- @schorlton made their first contribution in https://github.com/ewels/MultiQC/pull/1567
- @MatthiasZepper made their first contribution in https://github.com/ewels/MultiQC/pull/1584
- @g-pacheco made their first contribution in https://github.com/ewels/MultiQC/pull/1587
- @paulstretenowich made their first contribution in https://github.com/ewels/MultiQC/pull/1605
- @yanick made their first contribution in https://github.com/ewels/MultiQC/pull/1595
- @MillironX made their first contribution in https://github.com/ewels/MultiQC/pull/1594
- @sguizard made their first contribution in https://github.com/ewels/MultiQC/pull/1593
- @maleasy made their first contribution in https://github.com/ewels/MultiQC/pull/1552
- @TomaszSuchan made their first contribution in https://github.com/ewels/MultiQC/pull/1271
- @massiddamt made their first contribution in https://github.com/ewels/MultiQC/pull/1021
✨ MultiQC - new features
- Added option to customise default plot height in plot config (#1432)
- Added
--no-reportflag to skip report generation (#1462) - Added support for priting tool DOI in report sections (#1177)
- Added support for
--custom-css-file/config.custom_css_filesoption to include custom CSS in the final report (#1573) - New plot config option
labelSizeto customise font size for axis labels in flat MatPlotLib charts (#1576) - Added support for customising table column names (#1255)
🔨 MultiQC - updates
- MultiQC now skips modules for which no files were found - gives a small performance boost (#1463)
- Improvements for running MultiQC in a Python environment, such as a Jupyter Notebook or script
- Added commonly missing functions to several modules (#1468)
- Wrote new script to check for the above function calls that should be in every module (
.github/workflows/code_checks.py), runs on GitHub actions CI - Make table Conditional Formatting work at table level as well as column level. (#761)
- CSS Improvements to make printed reports more attractive / readable (#1579)
- Fixed a problem with numeric filenames (#1606)
- Fixed nasty bug where line charts with a categorical x-axis would take categories from the last sample only (#1568)
- Ignore any files called
multiqc_data.json(#1598) - Check that the config
path_filtersis a list, convert to list if a string is supplied (#1539)
🎁 New Modules
-
CheckQC
- A program designed to check a set of quality criteria against an Illumina runfolder
-
pbmarkdup
- Mark duplicate reads from PacBio sequencing of an amplified library
-
WhatsHap
- WhatsHap is a software for phasing genomic variants using DNA sequencing reads
🌟 Module feature additions
-
BBMap
- Added handling for
qchistoutput (#1021)
- Added handling for
-
bcftools
- Added a plot with samplewise number of sites, Ts/Tv, number of singletons and sequencing depth (#1087)
-
Mosdepth
- Added mean coverage #1566
-
NanoStat
- Recognize FASTA and FastQ report flavors (#1547)
🐛 Module updates
-
BBMap
- Correctly handle adapter stats files with additional columns (#1556)
-
bclconvert
- Handle change in output format in v3.9.3 with new
Quality_Metrics.csvfile (#1563)
- Handle change in output format in v3.9.3 with new
-
bowtie
- Minor update to handle new log wording in bowtie v1.3.0 (#1615)
- CCS
- Custom content
-
DRAGEN
- Fixed bug in sample name regular expression (#1537)
-
Fastp
- Fixed % pass filter statistics (#1574)
- FastQC
-
goleft/indexcov
- Fix
ZeroDivisionErrorif no bins are found (#1586)
- Fix
-
HiCPro
- Better handling of errors when expected data keys are not found (#1366)
-
Lima
- Move samples that have been renamed using
--replace-namesinto the General Statistics table (#1483)
- Move samples that have been renamed using
-
miRTrace
- Replace hardcoded RGB colours with Hex to avoid errors with newer versions of matplotlib (#1263)
-
Mosdepth
- Fixed issue #1568
- Fixed a bug when reporting per contig coverage
-
Picard
- Update
ExtractIlluminaBarcodesto recognise more log patterns in newer versions of Picard (#1611)
- Update
-
Qualimap
- Fix
ZeroDivisionErrorinQM_RNASeqand skip genomic origins plot if no aligned reads are found (#1492)
- Fix
-
QUAST
- Clarify general statistics table header for length
- RSeQC
-
Sambamba
- Fixed issue with a change in the format of output from
sambamba markdup0.8.1 (#1617)
- Fixed issue with a change in the format of output from
-
Skewer
- Fix
ZeroDivisionErrorif no available reads are found (#1622)
- Fix
-
Somalier
- Plot scaled X depth instead of mean for Sex plot (#1546)
-
VEP
- Handle table cells containing
-instead of numbers (#1597)
- Handle table cells containing