MoniQL Save
MoniQL is an open source monitoring and visualizing tool for PostgreSQL databases. MoniQL allows you to set timed queries that will return alerts to notify you of anomalous data--however you define it.
MoniQL: PostgreSQL Database Monitor and Visualiser
Table of Contents
- Introduction
- Getting Started
- Built With
- Interface & Features
- Stretch Features
- Contributing
- Contributors
- License
Introduction
MoniQL is a mighty PostgreSQL database monitor and visualiser. Designed to simplify and automate tasks involved in taking care of a relational database, MoniQL is here to keep your database safe and happy--MoniQL runs on queries only and does not set any constraints or triggers or anything else on your database!
Getting Started
To get started on monitoring your database with this Project:
- Clone this repo to your local machine.
- Run
npm installfor necessary dependencies. - Download and install PostgresQL to access MoniQL’s PostgresQL features.
- Create a new remote (cloud-hosted) db instance to hold MoniQL's auth, monitors, and alerts data. ElephantSQL offers free hosting.
- Make sure the
setup_db.shscript is executable by runningchmod +x setup_db.sh. - On the command line run
./setup_db.sh. - When prompted, provide the URI to your empty database where you want to store your MoniQL data.
- Create a
.envfile in your root and add the following line:-
PG_URI=<URI for your newly created DB>
-
- Create users with usernames, passwords, and URIs to the target cloud database to be monitored.
Built With


- JavaScript
- React
- Redux
- PostgreSQL
- Material-UI
- React-Flow
- Node-Cron
- Socket.io
- Express.js
- Webpack
- Love <3
Interface & Features
Login/ Signup
Upon application launch, you will be taken to the splash page with [currently dolphins]. Navigate to the login/sign up menu by clicking on the button on the top right. Login to your account associated with the database you want to monitor. Ensure that your account is registered correctly with a username, password, and URI.
Header and Sidebar
The bell icon in the header will display the number of unresolved alerts from the running monitors. Clicking on the bell icon will open a drawer on the right side where you have the option to click on an alert to see anomalous rows. You can also add a note, mark alerts as resolved, and clear resolved alerts by clicking on the x.
The user silhouette icon will open up an option for Sign out so you can end your session.
The sidebar has Dashboard, Focus Table ERD, Monitors, Alerts, and a settings icon for easy navigation.
Dashboard
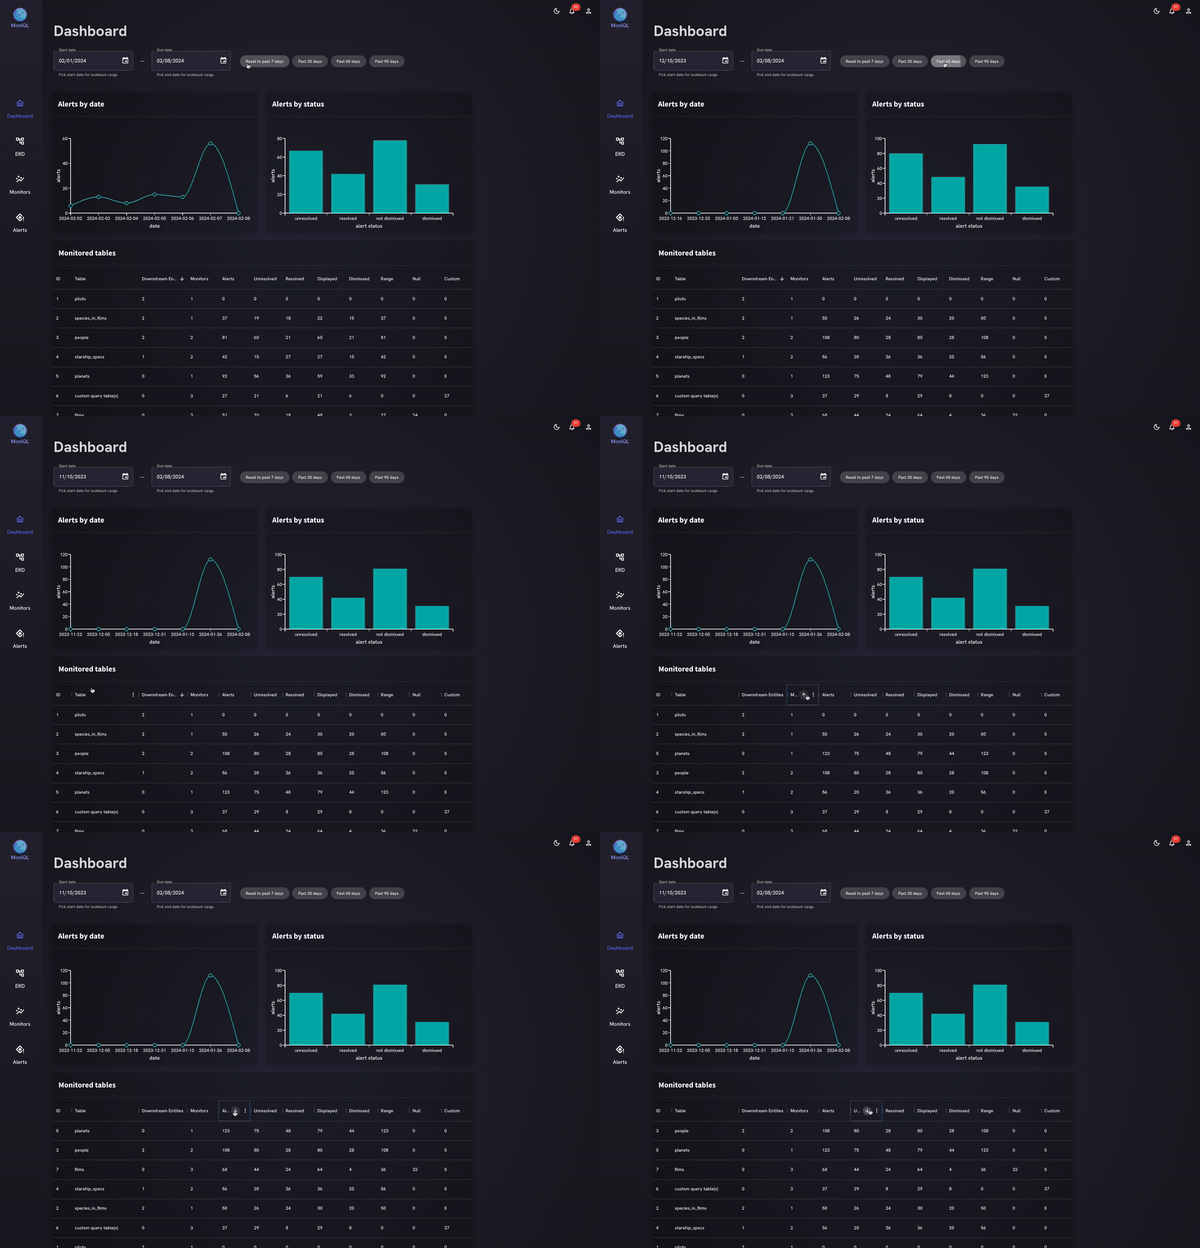
Upon signing in to your MoniQL account, you will be presented with our Dashboard containing dynamic charts of your alerts by the specified date range or by status and a table with information about all your monitored tables. The Dashboard’s line chart and bar chart are responsively synced up to the time range selector above them, where users can choose a specific range of dates or jump to showing all of the Alerts of the past 7, 30, 60, or 90 days. The table of tables below the charts, listing each table currently under watch from one or more MoniQL Monitors, is initially organized by the number of downstream entities that a table has. But the table of tables is interactive, too, and can be reordered by clicking on any column of the table, letting users get a quick grasp of their data’s overall health.

Entity Relationship Diagram
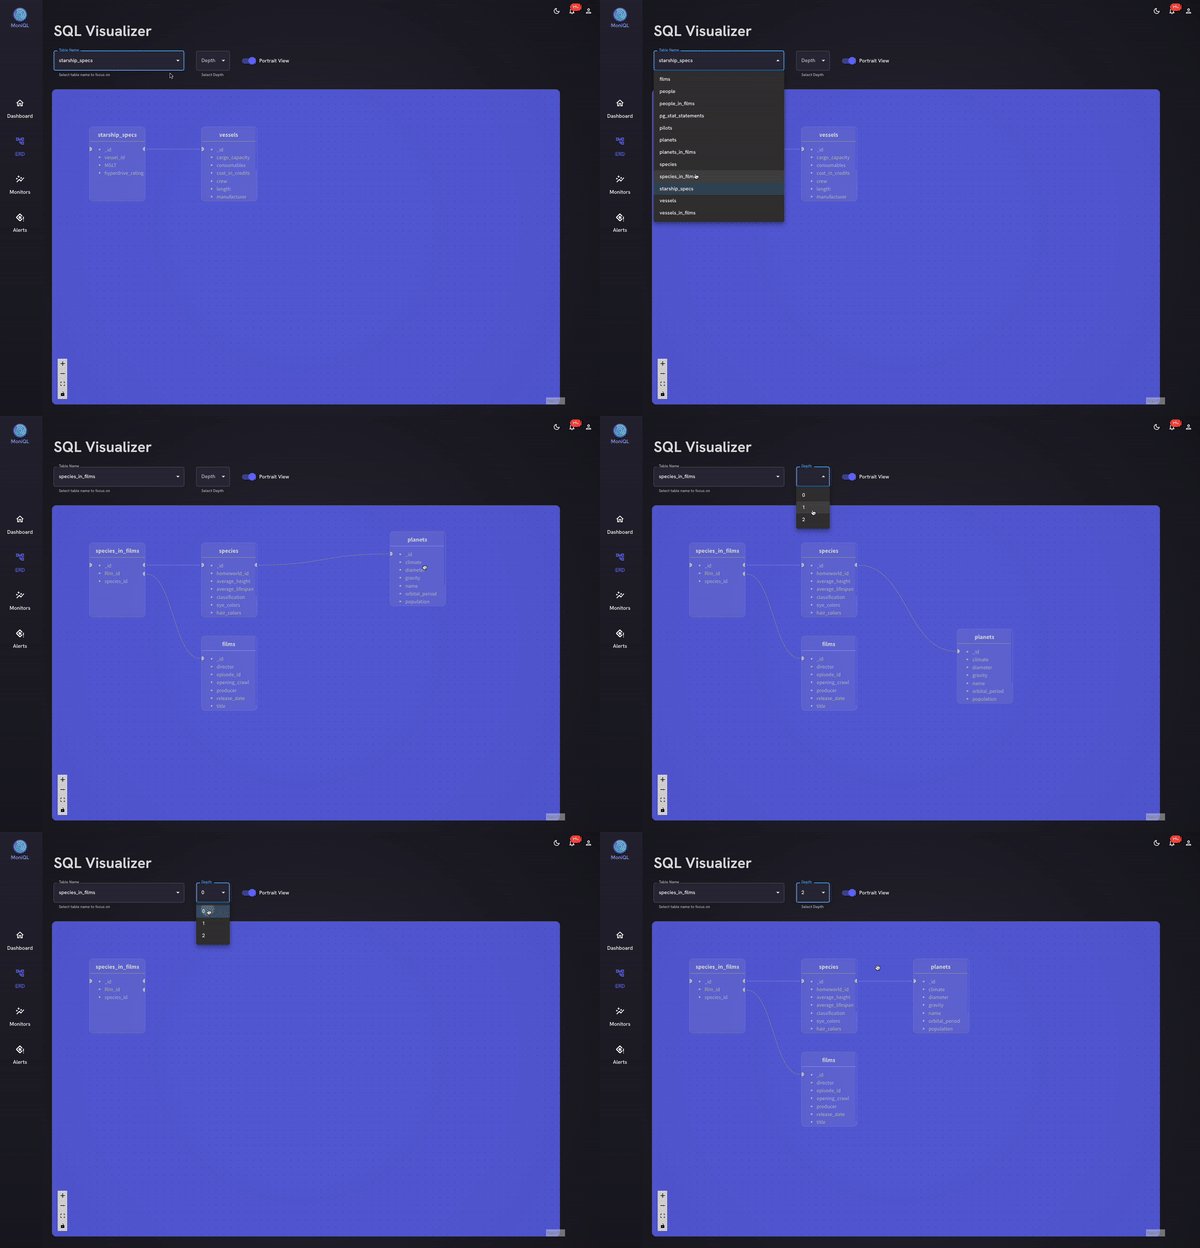
The ERD icon will take you to MoniQL’s organized, interactive, and pleasingly styled Focus Table ERD where you can choose a table to focus on, and the depth of downstream tables that you will like to have displayed. This allows the user to choose any table from their database and immediately display that table’s downstream entity relationships, up to the chosen depth.

Monitors
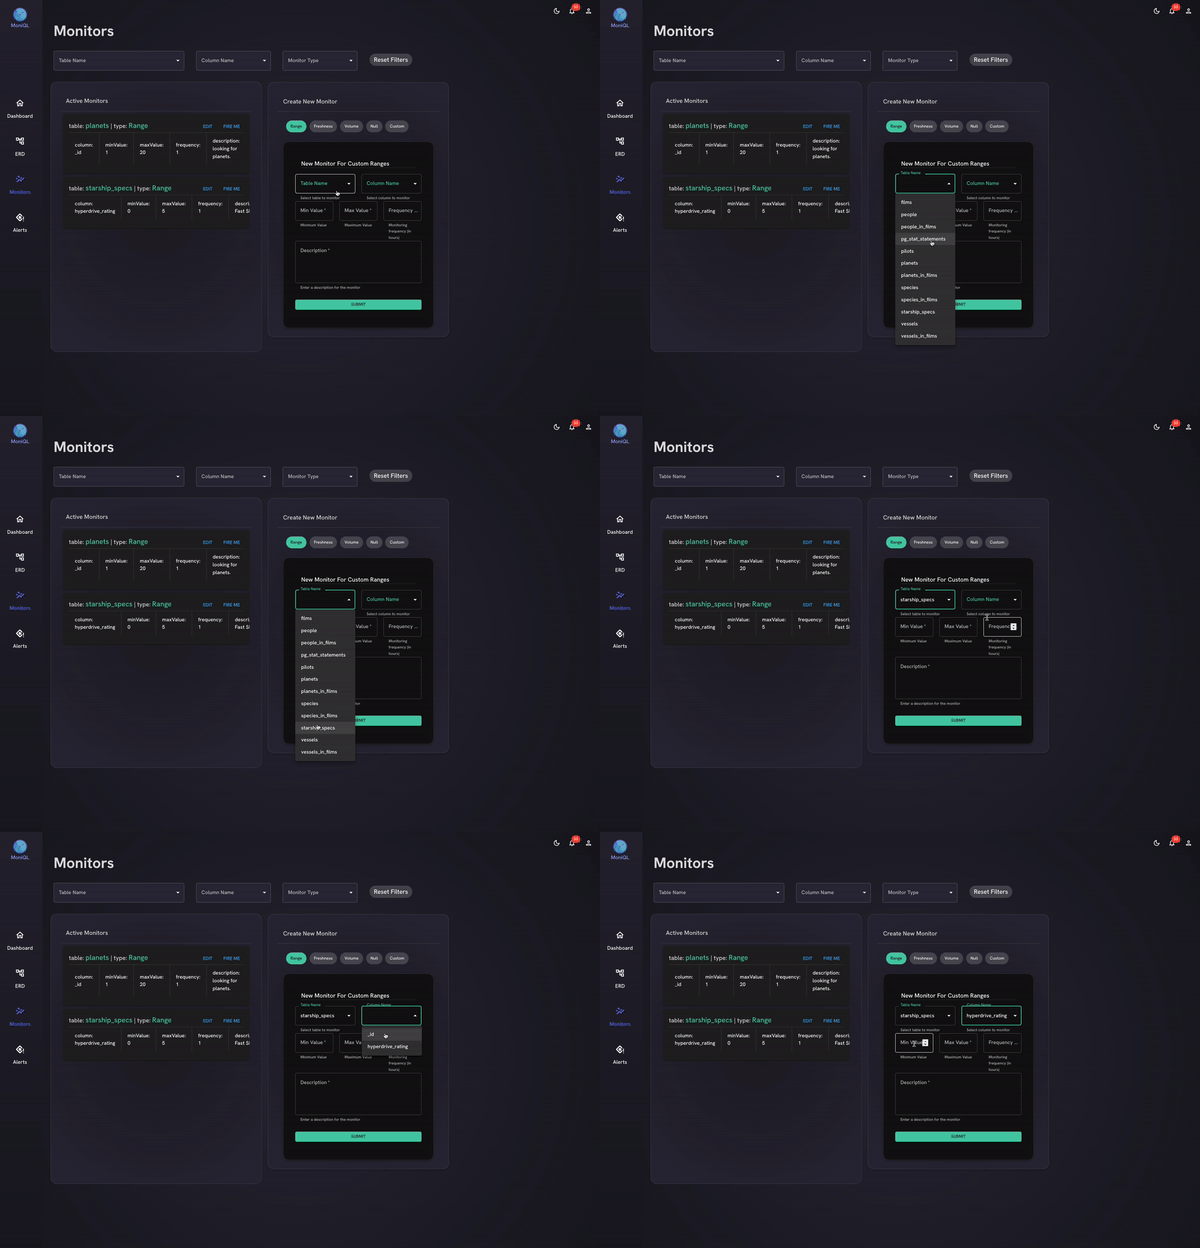
The monitors icon will take you to the engine of MoniQL’s core monitoring functionality where you can view and edit a list of your active monitors. You can also filter monitors by table name, column name, and monitor type. On the right side of the screen, you can choose a type of Monitor to create—-so far we have full stack functionality for Range Monitors, Null Monitors, and Custom Monitors, and for each you can decide how often you’d like them to fire automatically, or you can fire at will with a button click. Range Monitors allow you to pick a minimum or a maximum value, or both, for any column that contains numbers, and set off an alert whenever a number outside of your chosen range is found. Our default Null Monitors look for null values in any column on a given table. And perhaps most useful to devs like yourself, our Custom Monitors allow you to enter whatever SQL query you’d like, set up to return anomalous values, and automatically check your database for such values at time intervals of your choosing. When one of your Monitors finds anomalous values on a table of yours, MoniQL will create an Alert, and update the bell icon in the upper right corner of your window.

Alerts
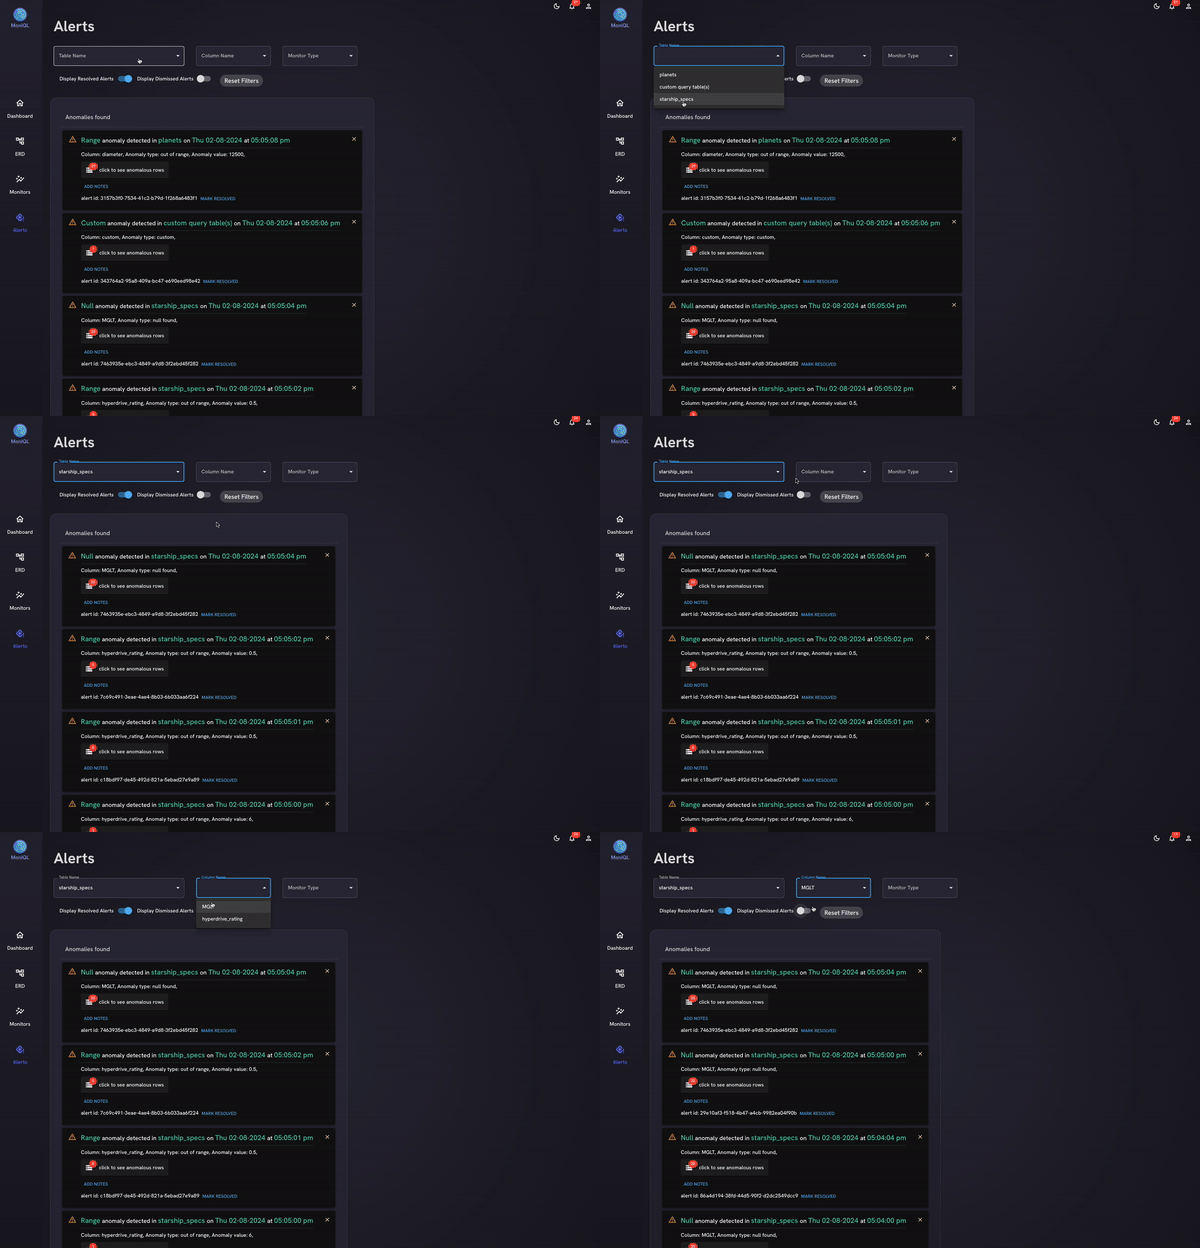
The alerts icon will lead you to a closer view of your Alerts allowing you to filter by table name, column name, monitor type, and status. This will be where you have the option to click to see anomalous rows. You can also add notes, mark alerts as resolved, and clear resolved alerts by clicking on the x at the top right of the Alert component. Once Alerts have been dismissed, they will no longer display by default, but you can click the toggle on this page to see those you have dismissed as well as those that you haven’t gotten to yet.

Stretch Features
- Support for other SQL databases: our current solution supports PostgreSQL databases with URIs, we would like to eventually support more database types.
- More monitors! We have queries set up on the backend to return statistical data on any column holding numbers, but haven't yet implemented that on the frontend.
- Query helper: we would like to incorporate a query helper that would assist in ensuring efficient and correct queries are being made.
- Dark mode: styling to accommodate other color schemes.
- Settings: additional settings for the app such as notification sounds.
- External alerts: sending alerts as emails or connecting to other messaging systems such as Slack.
Contributing
We’ve released MoniQL as a valuable tool to help visualize and monitor PostgreSQL databases. Expect ongoing enhancements, extensions, and added features to be introduced to further elevate its utility. We deeply appreciate any community contributions and we invite you to explore MoniQL and offer suggestions for improvements as you see fit! If you encounter any issues, please report them in the issues tab or submit a PR. Your interest and support are greatly appreciated.


