Micro Profiler Save
Cross-platform low-footprint realtime C/C++ Profiler
MicroProfiler 
Want to locate the bottlenecks of your app right when it suffers them?
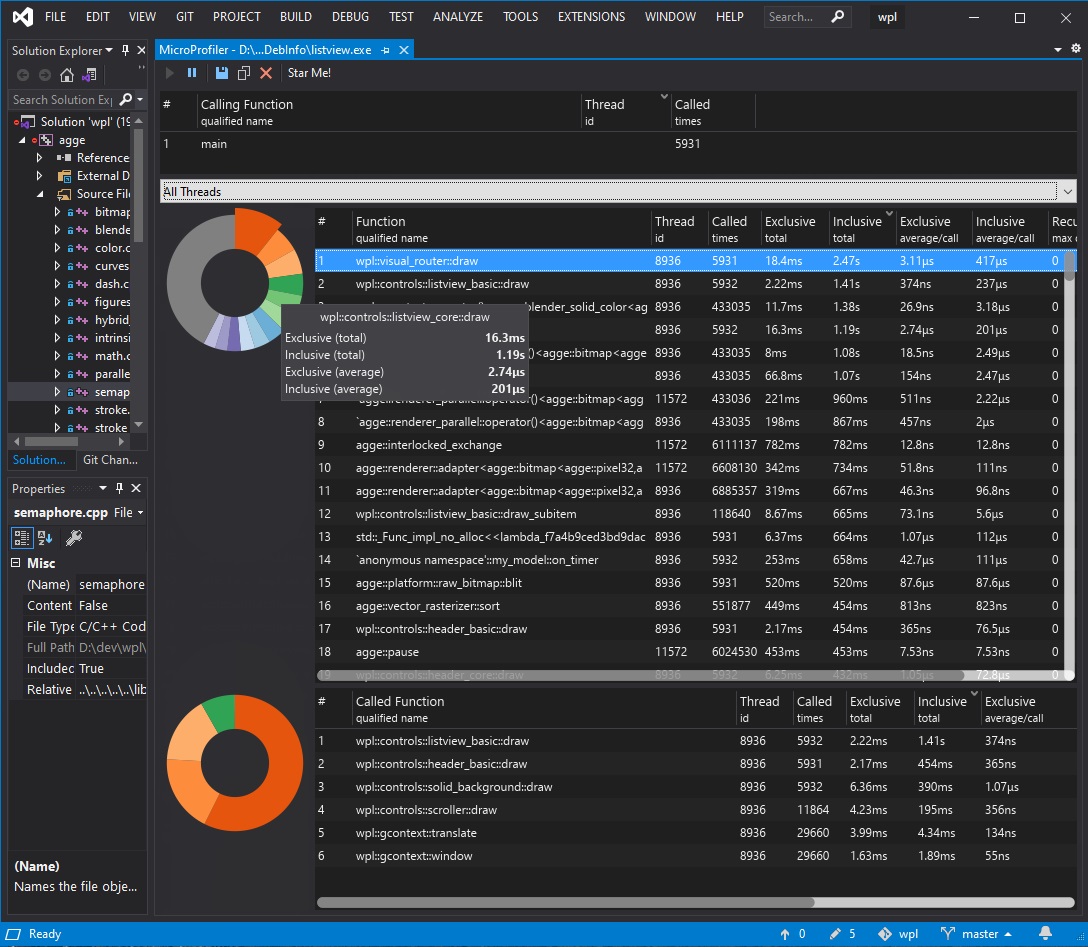
MicroProfiler offers unique ability to perform analysis and deliver it in real-time. You will not have to endlessly re-run your application to gather statistics for use cases your are interested in - you will simply see performance profile as you go. Like in the video below:
Wish to keep it useful while profiling?
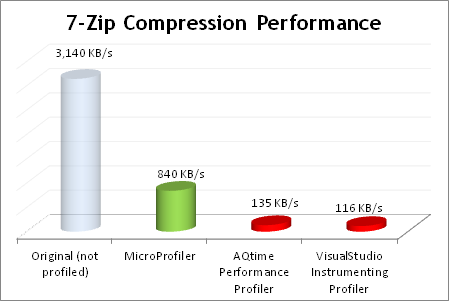
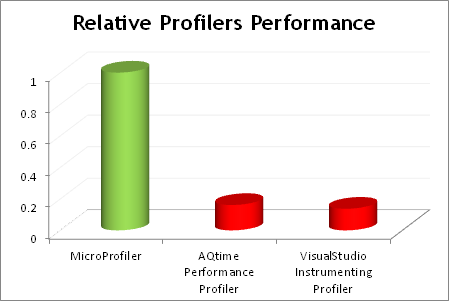
MicroProfiler grounds on the idea that the application being profiled must remain usable, that is its performance must not degrade much. Comparison is worth million words:
and
Prefer Swiss Army knives over machine guns?
MicroProfiler comes with installer that is smaller than 1MB, but is packed with tools you need to go:
- Call tracer/analyzer - attaches to the process being profiled;
- Frontend UI - displays overall function statistics with ability to sort and drill down to parent/children calls right in the runtime;
- VisualStudio extension that includes frontend UI and allows you to switch profiling support for a project in just a single click.
MicroProfiler will not clog your hard drive with unnecessary raw data, while other profilers may store tens of gigabytes of garbage.
It has no dependencies, therefore, you can profile on a clean machine - just the symbol files (.pdb) on Windows and symbol names debug-info on Linux for the binary images being profiled are required.
Good news for folks maintaining legacy software: MicroProfiler runs on Microsoft Windows XP!
Trust in OpenSource?
MicroProfiler comes with no spyware/malware. You are free to checkout the latest sources and build it yourself. You will only have to have MSVC 2010+ and Visual Studio SDK. The sourcecode can be found here: https://github.com/tyoma/micro-profiler
Usage Guidelines
VisualStudio integration makes it pretty simple to start using MicroProfiler. Just follow these steps:
- Right-click the project your want to profile in the solution tree and check 'Enable Profiling'. Please note, that this will force the environment to rebuild your project;
- Build the project;
- Run the project;
- Profiler frontend will show-up automatically inside the Visual Studio instance you used to run the project or in a standalone mode (if standalone version is installed).
You may want to set the scope you wish to profile. In order to do this uncheck the 'Enable Profiling' menu item and add manually a pair of command line options to C/C++ compiler /GH /Gh for .cpp files of interest.
To profile a static library you may follow the similar steps: enable and then disable profiling on the image (dll/exe) project containing the library and manually add /GH /Gh for the library of interest.
To remove the instrumentation and profiling support click 'Remove Profiling Support' in the context menu for the project.
Manual Configuration for a Profiled Build
- (Linux) Build the application with
-finstrument-functionsflag on. Link withmicro-profiler_<platform>. The shared objects are located in MicroProfiler's installation directory; - (Windows, MSVC) Build the application with
/GH /Ghflags on. Link withmicro-profiler_<platform>.lib;
Windows Services Profiling
In order to profile Windows Service or other application running with credentials different than interactive user you may need to manually setup MicroProfiler. Follow these steps to do so:
- Make sure you have profiler's directory in PATH environment variable for System;
- Add another system environment variable:
MICROPROFILERFRONTEND="sockets|127.0.0.1:6100". Port number (#6100 by default) is autoconfigured on Visual Studio startup with MicroProfiler extension enabled. If you're running standalone version - the first frontend application instance will have port configured to #6100, following runs will increment it; - Make sure you've compiled your program for profiling (see above);
- Run the application.
Remote/Linux Profiling
The steps are much like the ones above.
- Copy profiler's collector
[lib]micro-profiler_<platform>.{dll|so}to the directory next to the executable / dynamic library you're profiling. You may need to chmod the binaries so that they are executable; - (Linux) You'll may need to add current directory ('.') to the LD_LIBRARY_PATH using this command:
export LD_LIBRARY_PATH=.:${LD_LIBRARY_PATH}. Sometimes, the profiled application or a shared object may not link the profiler's hook functions resulting in a missing profiler statistics. To remedy this, please use 'preload trick' - run your executable with an LD_PRELOAD:LD_PRELOAD=<path_to_profiler.so> <your_app_executable>; - Set the frontend's host variable:
export MICROPROFILERFRONTEND="sockets|<frontend_machine_ip>:6100"; - Run the application.
Revision History
v2.0.651
- Callstack display is implemented in addition to the existing flat function list. The mode can be switched in the profiler's pane toolbar. The piechart for main list is a bit misleading as of now;
- The performance of the analyzing thread is greatly improved (about 2x), which the profiler more capable of profiling greater loaded applications;
- Issue #71 implemented - threads filter now allows for a cumulative view - with the times summed up from all threads.
- Issue #69 an attempt to fix has been made - building and running an application after upgrade fixes the environment variables, but that may not happen instantenously upon VS restart;
v2.0.638
- Issue #77 fixed - crash in applications with profiled DLL being loaded after more than 64 TLSes allocated.
v2.0.637
- Quickfix: functions names were empty on loading existed statistics.
v2.0.636
- Issue #59 fixed - profiled application keeps running until the last batch of updates and all the symbols are loaded into frontend;
- Issue #67 implemented - collector is now writing its logs;
- Issue #66 fixed - installer now contains dbghelp.dll redistributable to run on Windows 7+ w/o requiring Visual Studio to be installed.
v2.0.635
- First (very beta) version with working "Profile Process..." menu - requires binary to be compiled with
/hotpach(on x86, compiler settings) and/functionpadmin:XX(linker settings) on Windows (msvc) or-fpatchable-function-entry=N,Mon Linux (gcc, clang); - Versioned file format - serialization of every data unit is versioned, so that backward (and sometimes forward) compatibility is supported. Compatibility with .mpstat3/.mpstat4 is preserved;
- Multi-selection is now supported in main statistics list;
- Some of the selection-related defects fixed - selection in all lists is restored after the 'Clear' is clicked;
v1.9.634
- VisualStudio 2022 support - 64-bit version of VS extension added to the vsix;
- Values are now right-aligned;
- Frontend does not go behind on large updates - updates are now requested by the frontend explicitely, rather than sent by the collector on timer;
- Performance updates.
v1.9.632
- Issue #72 fixed - aux socket handshake is sent asnychronously only after the socket is synchronously connected;
- Issue/request #73 implemented - trace buffers are now allocated/freed in an adaptive manner - traces for threads that don't generate any traffic are trimmed, while others get expanded if necessary;
- A pesky bug of crashing on closing profiler's pane in Visual Studio from keyboard is fixed;
- Text rendition improved - strings abridged in the list views are now appended with ellipsis;
- 10-25% performance improvement in Windows x64 due to critical collection part reimplemented in optimized assembler code and better buffering.
v1.8.631
- Symbols produced by Visual Studio 2019 are now correctly read by using redistributable dbghelp.dll.
v1.8.629
- Major UI rework: statistic lists are now entirely custom, performance (although not measured precisely) significantly improved (meaning, less CPU is busy displaying stats - more available to the profiled app);
- Mouse hovering the piechart now displays a hint with a function name and times;
- Parent/main/children statistic panes are now resizable;
- Cross-platformness improved: frontend can now be built on macos;
- VisualStudio themes are supported in dynamics.
v1.7.624
- Significant performance improvement due to changes in the collector's queue. Under a constant high load (lots of small un-inlined functions): up to 35% (x86) and 42% (x64) less of profiler's overhead. Up to 50% less overhead in a short bursts of small functions;
- Issue #57 fixed: due to different queueing implemented in collector (~250 times less of atomic bus-locking), the profiler's overhead is now less subjected to intermittent hikes, therefore, the chances of negative times for extrasmall functions are lower as well.
v1.6.622
- Issue #58 fixed: saving and loading of statistics is restored, older .mpstat3 reading is supported as well.
v1.6.620
- Multithreading information: new column added to display native thread id (LWP on Linux) the statistics is collected from;
- Multithreaded support: ability to filter the statistics view by the thread id or display statistics for every thread. The filtering combobx is as well a source of information - it displays native thread id, thread name (if supported and set) and thread times (including completion time for ended threads). These two features closed Issue #48;
- Issue #56 fixed: columns widthds and sorting is now restored next time the profiler pane is opened.
v1.6.616
- Last-minute fixes of the new/changed functionality: invalid characters in 'Additional Dependencies' settings, non-Unicode paths of the profiled modules, extended logging, etc.;
v1.6.615
- Issue #55 implemented: it is now possible to enable/disable profiling on multiple projects at the same time;
- It is now possible to enable profiling on a static library project without adding it to the containing EXE/DLL;
- Issue #4 implemented: Pause/Resume functionality added;
- Issues #50, #51 fixed: required environment variables are always updated on Visual Studio start;
- Child overhead is now correctly calculated. Inclusive times are now correct and do not include profiler's overhead from child calls;
- Necessity in inclusion of
micro-profiler.initializer.cppeliminated - profiled modules are automatically picked up; - Profiler import-library is now added to the project via additional dependencies instead of including it into project hierarchy;
- Logging is now implemented for the Visual Studio package - on Windows the log files are placed in
%LOCALAPPDATA%\.MicroProfiler; - Non-ANSI symbols in micro-profiler installation directory supported;
v1.5.611
- Cross-platformness supported - the collector's binaries for Linux are supplied along with the extension/application;
- Issue #44 fixed: when running profiled application from Visual Studio the profiling results are shown in that instance;
- Issue #45 fixed: changed project files are completely rolled back when removing profiler support;
- Issue #8 fixed: the debug info is loaded completely asynchronously from within the profiled application. Once it's loaded, the symbols are released;
v1.4.606
- Visual Studio 2019 supported. New (asynchronous) extension initialization supported. Change is backward compatible, so that profiler keeps working with all previous versions starting with Visual Studio 2005;
v1.4.605
- Visual Studio 2019 Preview supported;
- Sporadic crashes on an attempt to load missing symbols fixed;
- Symbols are loaded on application exit and pdb(s) are released. This may lead to temporary Visual Studio irresponsiveness - be aware. This will be fixed, once asynchronous symbol loading is implemented.
v1.4.603
- It is now possible to navigate to the function directly from the main statistics list - just double click on a function!
- x64 profiling crash fixed - in some cases penter/pexit are inserted at improper location by the MSVC compiler - this is now mitigated by preserving processor flags. A corresponding ticket was opened with Microsoft;
- A bug related to frontend not appearing when profiling an application with manifest redirecting COM/OLE fixed;
- (standalone versions) Frontend is now intelligently created - first the collector tries to bring up VS integration frontend, then, if failed, standalone one;
- Integration files (micro-profiler.initializer.cpp/micro-profiler_*.lib) are added using environment variable, thus eliminating necessity of removing old integration files on vsix package update.
v1.4.601
- In order to visualize the proportion of time/calls of the functions profiled piecharts were added;
- Some minor changes include infrastructure rework to become less platform-dependent to clear way for Linux/GCC porting;
- An error fixed caused MicroProfiler not being included into search paths.
v1.3.600
- MicroProfiler statistics is now displayed in a standard Visual Studio tool window (displayed as tabbed document);
- Icons added to buttons/menus (appear only in MSVC 2012+);
- Some performance improvement in statistics display.
v1.2.599
- You now can easily Open/Save statistics gathered via MicroProfiler -> Open/Save menu integrated into Visual Studio!
- It became possible to switch between windows and close all of them with that new menu.
v1.2.597
- VS 2017 (15.6+) integration fixed.
v1.2.596
- Integration with Visual Studio improved significantly: problems with Enable/Disable profiling context menu and many others - fixed;
- Solved problems with "iterator debugging" (if an application changed it in precompiled header).
v1.2.595
- MicroProfiler is now compatible with Visual Studio versions 2012 to 2017 and is available for download and install directly from Extensions and Updates dialog.
v1.1.591
- Profiler UI may now be closed at any time, even if the profiled application is hung.
v1.1.590
- Visual Studio 2015 integration fixed.
v1.1.581
- VisualStudio Integration redone: MicroProfiler is now a VSPackage. This made it possible to integrate with VisualStudio 2013 and 2014;
- Menu items visibility changed: now there is only 'Enable Profiling' menu item is visible for a non-profiled project;
- The bug that prevented MicroProfiler window from popping up (after closing it, while minimized) is now fixed;
- One may want to remove ghost menu items from previous versions. This can be done by issuing a command for a corresponding development environment: devenv /ResetAddin MicroProfiler.Addin.MicroProfiler
v1.1.567
- VisualStudio Integration is now working for all versions, except for the VS 12.0+ (2013+).
v1.1.565
- The installer is no longer silent, it displays License Agreement and allows a user to choose the install location.
