Lets Plot Kotlin Save
Grammar of Graphics for Kotlin
Lets-Plot Kotlin API
A Grammar of Graphics for Kotlin.

![]()

Lets-Plot Kotlin API is a Kotlin API for Lets-Plot Multiplatform
plotting library,
which is built on the principles of layered graphics first described in the
Leland Wilkinson work The Grammar of Graphics.
|
Lets-Plot Kotlin API is largely based on the API To learn more about the Grammar of Graphics, This will be a good prerequisite for further exploration of the Lets-Plot library. |
Quickstart
Inside Kotlin Notebook, Datalore or Jupyter with Kotlin Kernel:
%use lets-plot
val rand = java.util.Random()
val data = mapOf(
    "rating" to List(200) { rand.nextGaussian() } + List(200) { rand.nextGaussian() * 1.5 + 1.5 },
    "cond" to List(200) { "A" } + List(200) { "B" }
)

var p = letsPlot(data)
p += geomDensity(color = "dark_green", alpha = .3) { x = "rating"; fill = "cond" }
p + ggsize(700, 350)
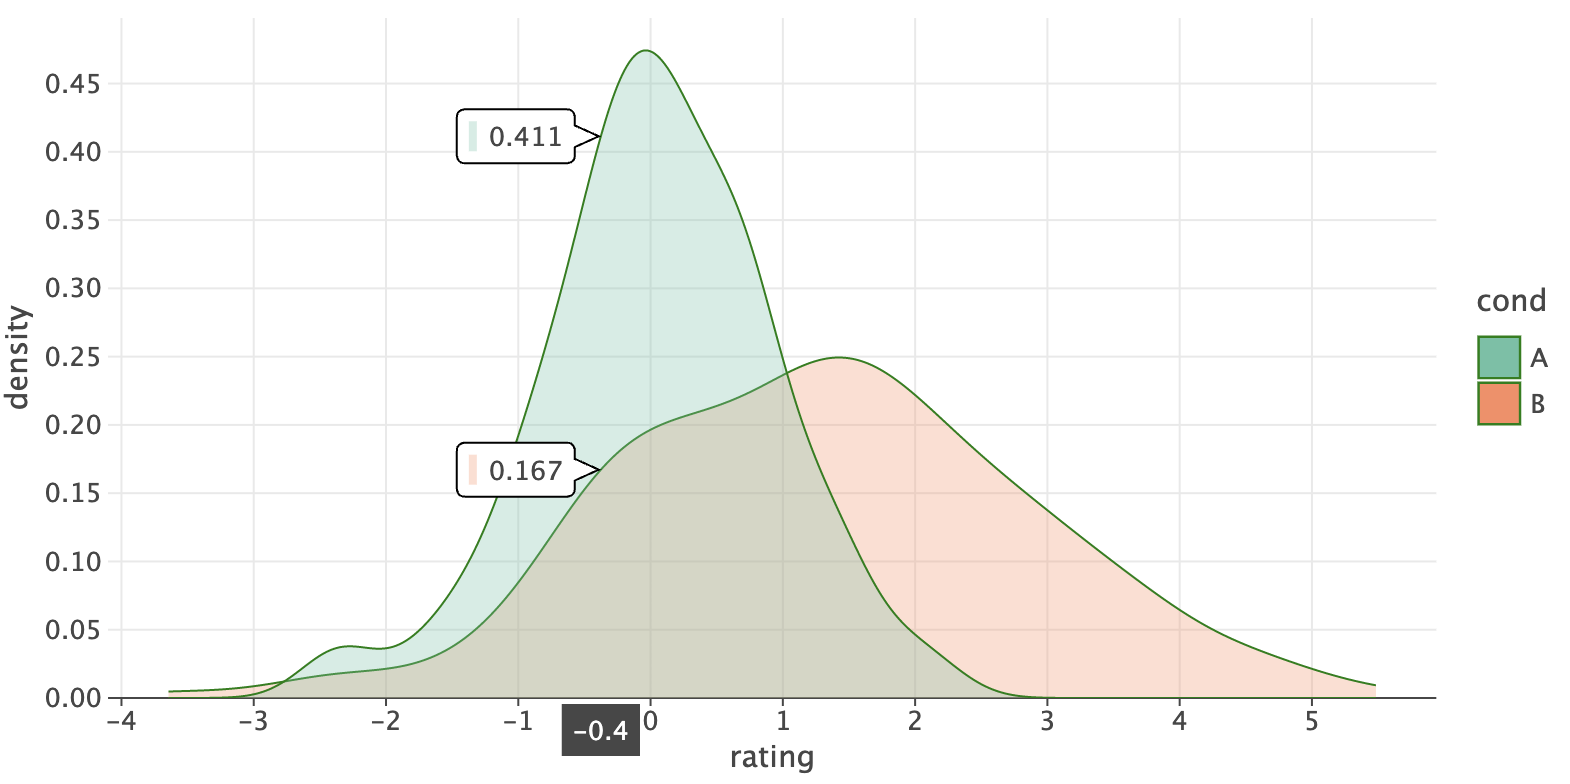
See the "Quickstart" notebook in Datalore or Jupyter nbviewer.
Table of Contents
- Usage
- Documentation
- What is new in 4.7.0
- Recent Updates in the Gallery
- Change Log
- Code of Conduct
- License
Usage
Notebooks
With the help of Lets-Plot Kotlin API you can easily create plots in Kotlin Notebook,
Datalore, Jupyter with Kotlin Kernel
or any other notebook that supports Kotlin Kernel.
"Line Magics"
%use lets-plot
This "line magic" will apply Lets-Plot library descriptor which adds to your notebook all the boilerplate code necessary to create plots.
By default, library descriptor is bundled with the Kotlin Jupyter Kernel installed in your environment.
However, you can override the default settings using:
%useLatestDescriptors
In this case the latest library descriptor will be pulled from the Kotlin Jupyter Libraries repository.
Library Descriptor Parameters
%use lets-plot(api=4.7.2, lib=4.3.2, js=4.3.2, isolatedFrame=false)
-
api- version of the Lets-Plot Kotlin API. -
lib- version of the Lets-Plot Multiplatform (JARs). -
js- version of the Lets-PLot Multiplatform JavaScript bundle. -
isolatedFrame- Iffalse: load JS just once per notebook (default in Jupyter). Iftrue: include Lets-Plot JS in each output (default in Datalore notebooks).
Compose Multiplatform
To learn how to embed Lets-Plot charts in Compose Multiplatform applications, please check out the Lets-Plot Skia Frontend project.
JVM and Kotlin/JS
To learn more about creating plots in JVM or Kotlin/JS environment please read USAGE_SWING_JFX_JS.md.
Examples
Examples of using of the Lets-Plot Kotlin API in JVM and Kotlin/JS applications are available in the Lets-Plot Kotlin Mini Apps (Demos) GitHub repository.
Documentation
-
A quick introduction to the Grammar of Graphics and Lets-Plot Kotlin API: Lets-Plot Usage Guide
-
Lets-Plot Kotlin API docs: docs/README.md
-
Lets-Plot Kotlin API reference: https://lets-plot.org/kotlin
-
The "Example Notebooks" reference: examples.md
-
Example notebooks in the Binder: mybinder.org
What is new in 4.7.0
-
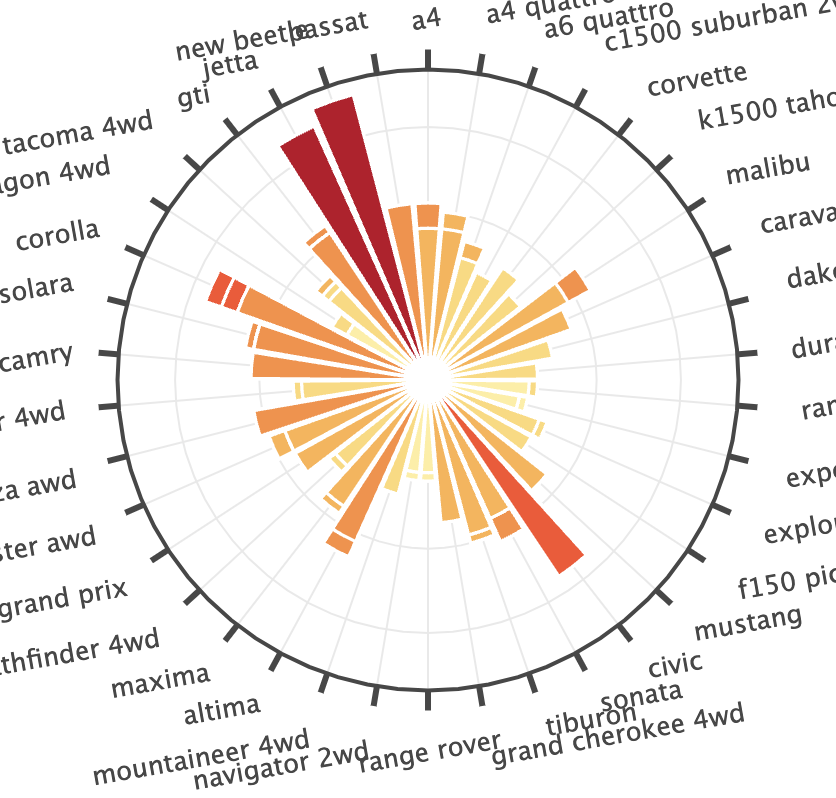
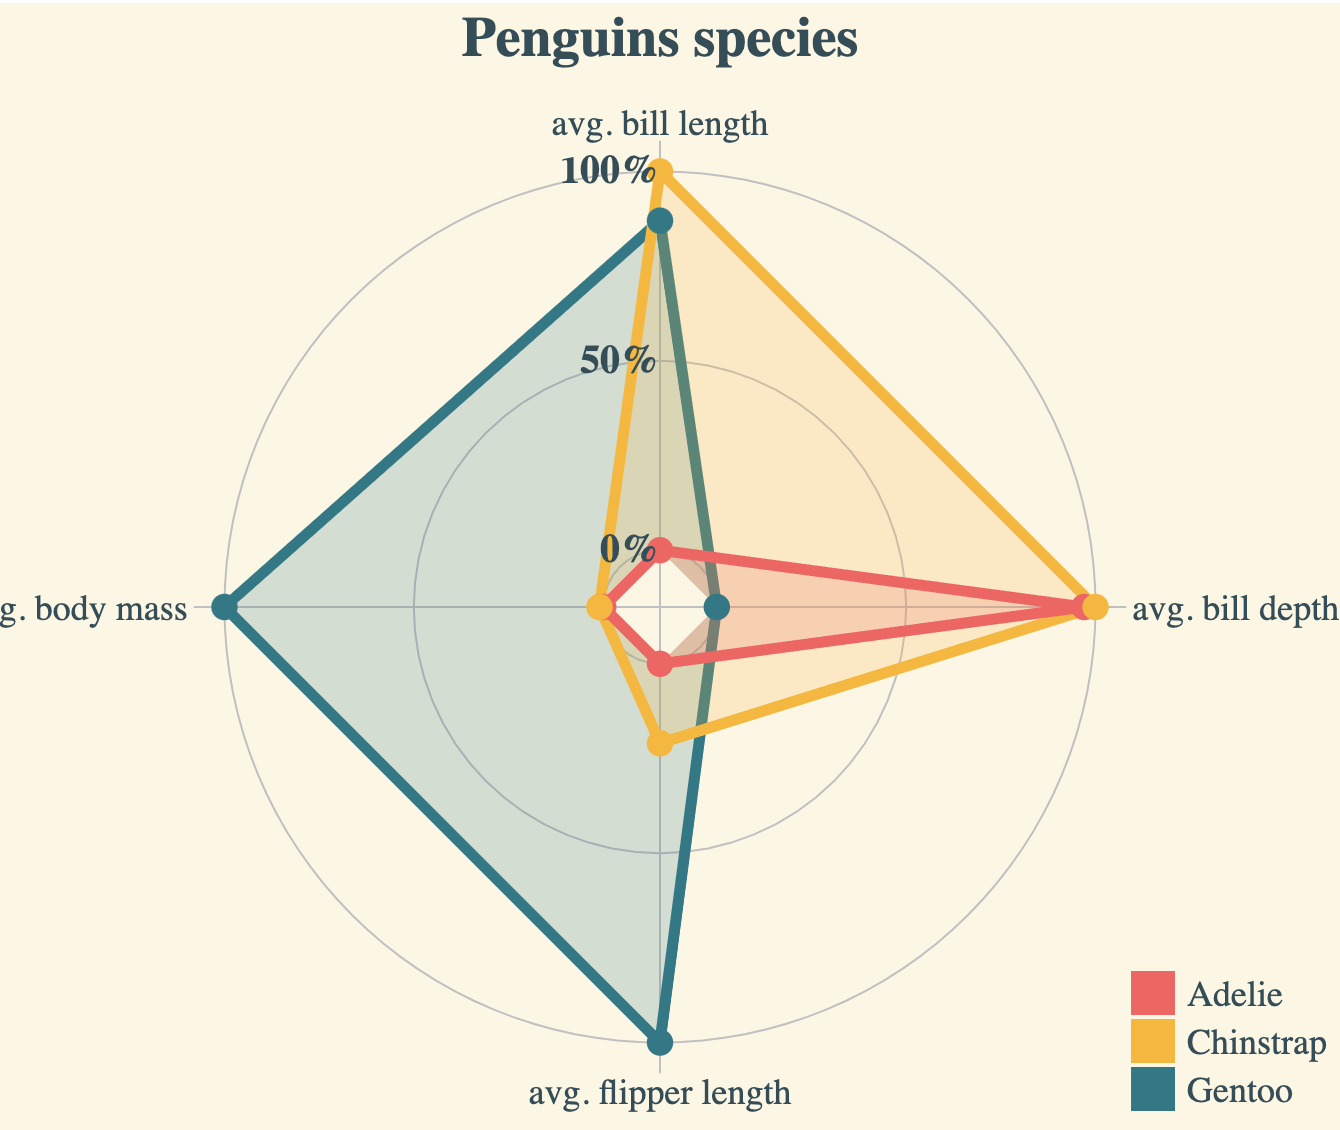
coordPolar()The polar coordinate system is most commonly used for pie charts, but it can also be used for constructing Spider or Radar charts using the
flatoption.
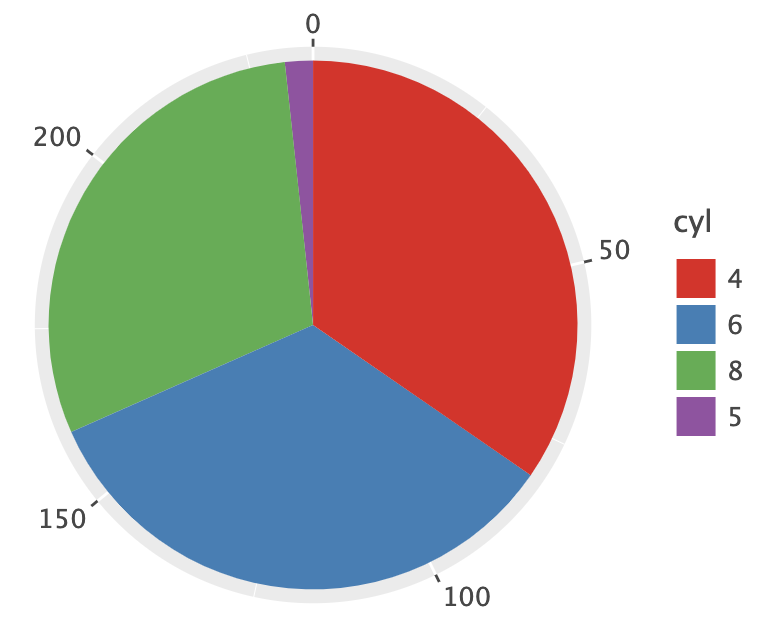
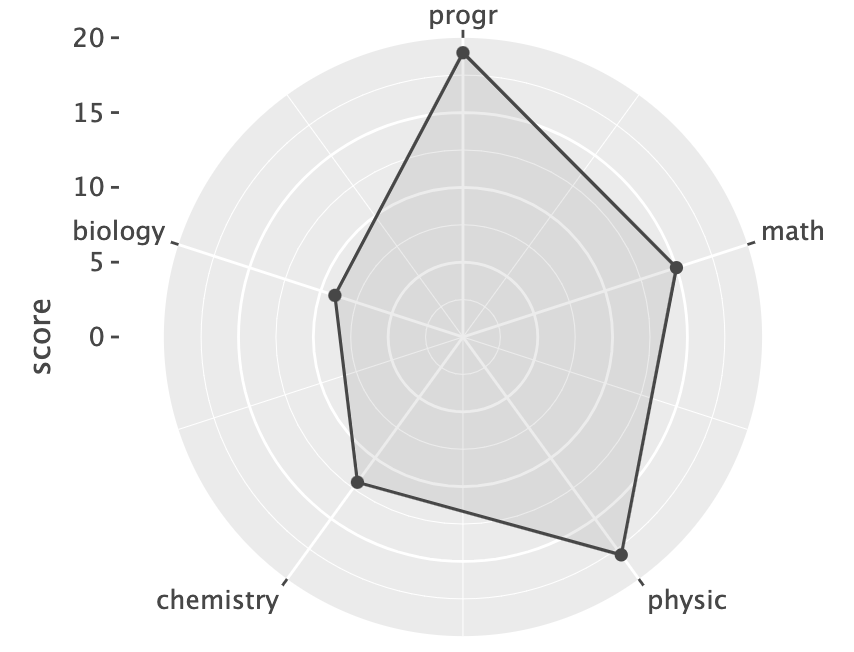
See: example notebook.
-
In the
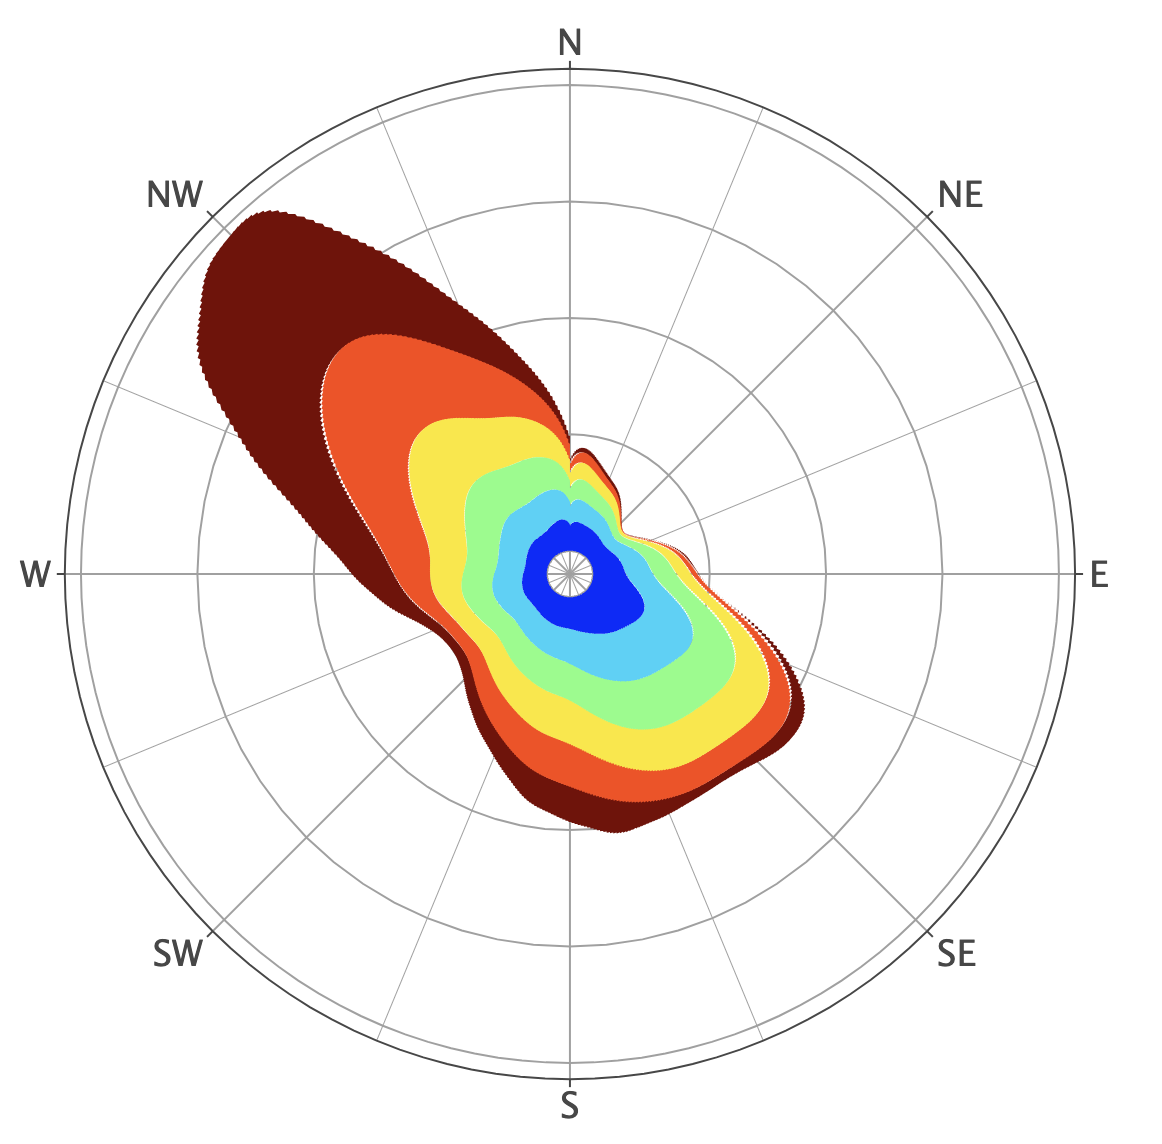
theme():-
panelInsetparameter - primarily used for plots with polar coordinates. See: example notebook. -
panelBorderOntopparameter - enables the drawing of panel border on top of the plot geoms. -
panelGridOntop, panelGridOntopX, panelGridOntopYparameters - enable the drawing of grid lines on top of the plot geoms.
-
-
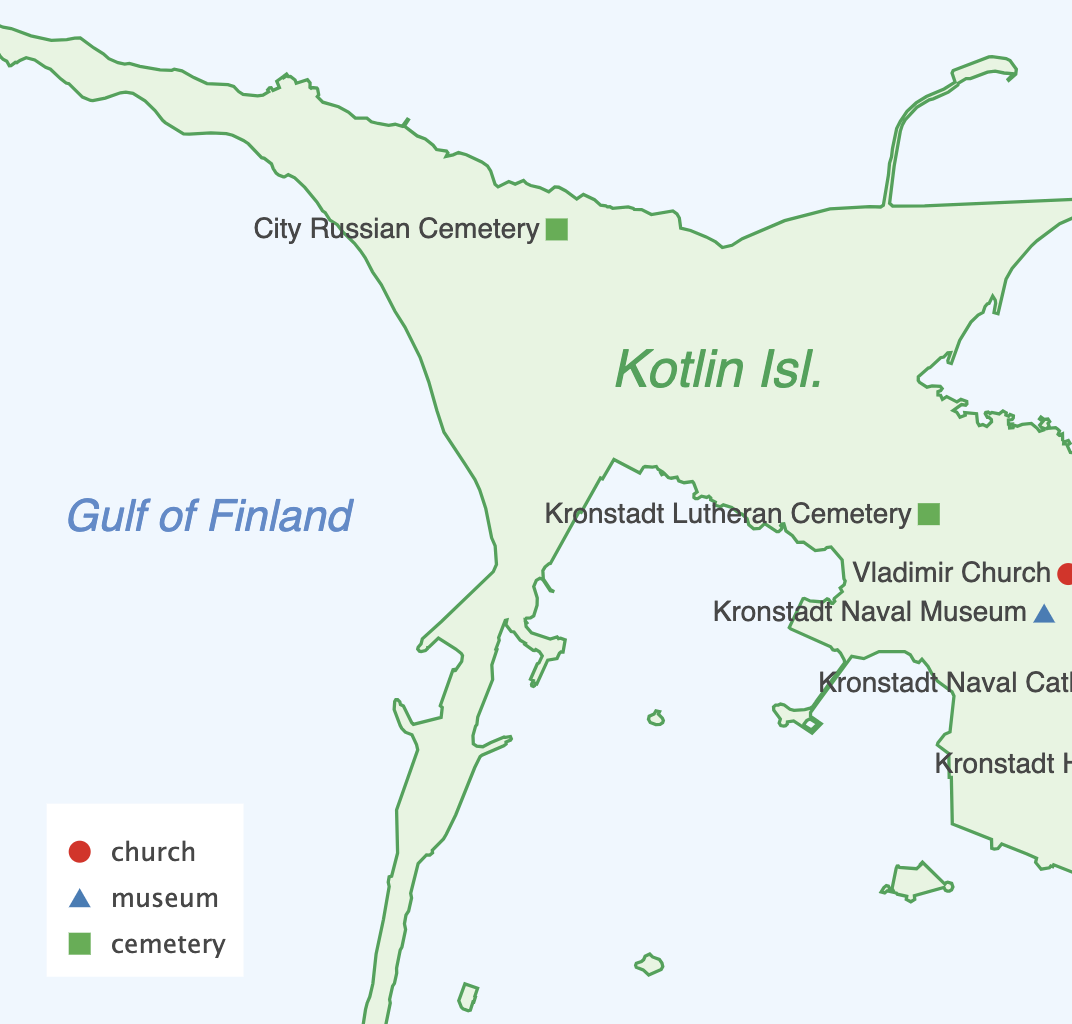
geomCurve()
See: example notebook.
-
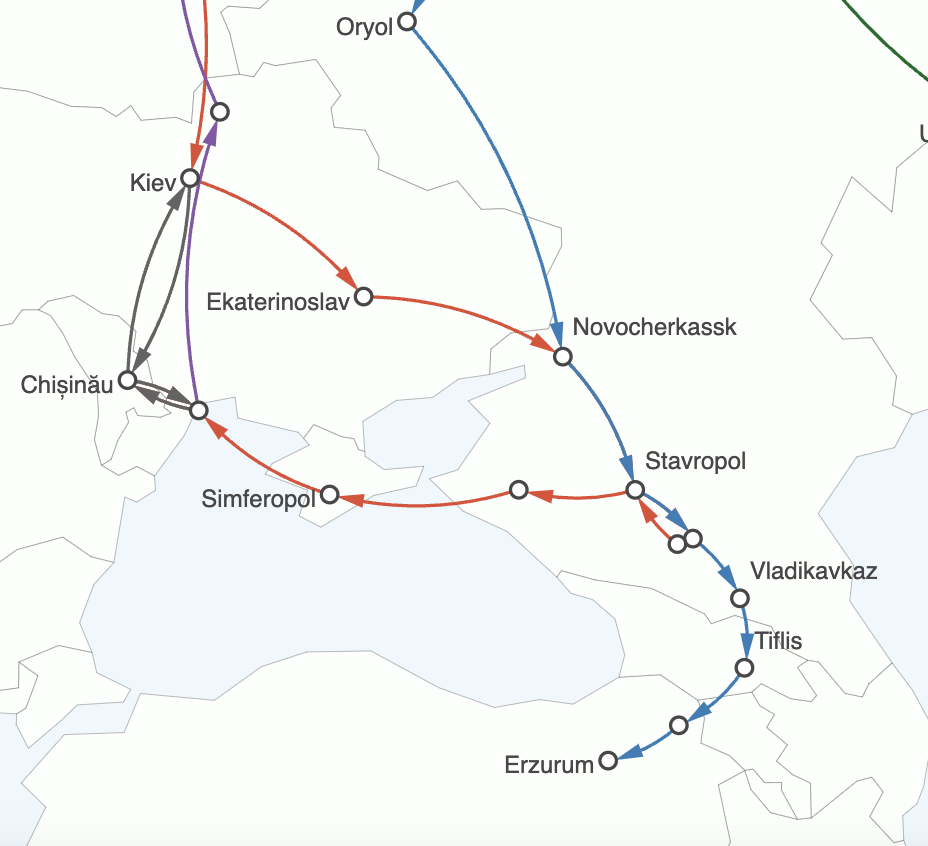
[UNIQUE] Visualizing Graph-like Data with
geomSegment()andgeomCurve()-
Aesthetics
sizeStart, sizeEnd, strokeStartandstrokeEndenable better alignment of segments/curves with nodes of the graph by considering the size of the nodes. -
The
spacerparameter allows for additional manual fine-tuning.
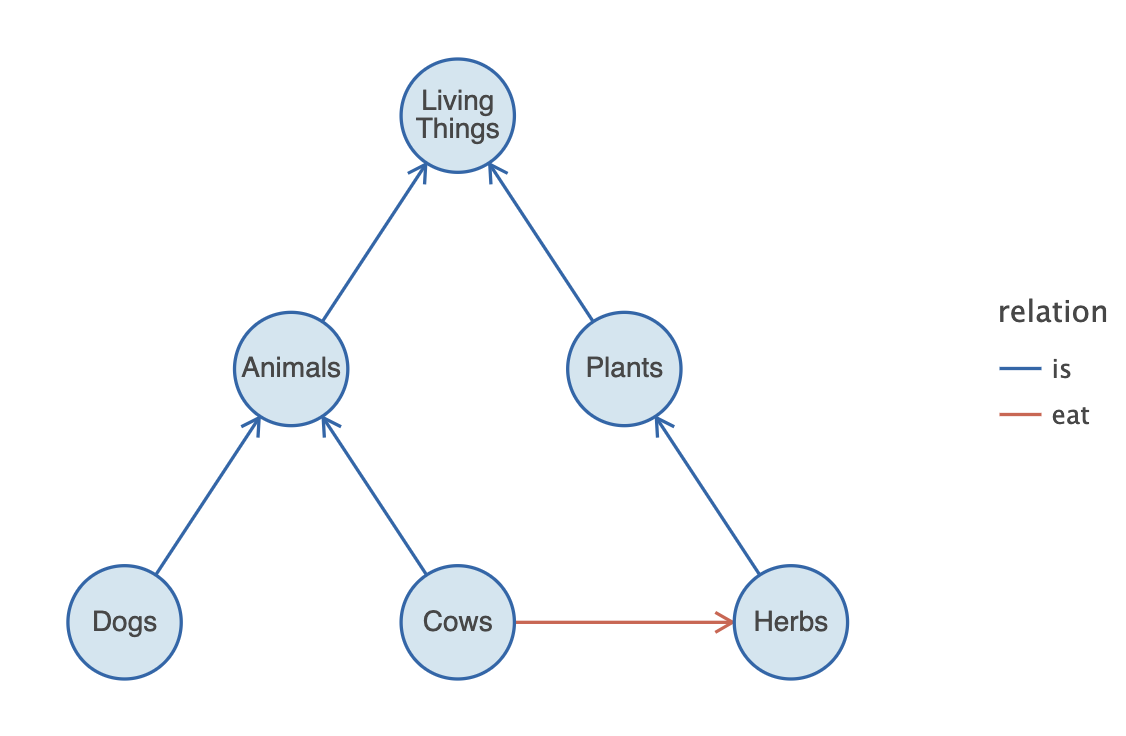
See: example notebook.
-
-
The
alphaStrokeParameter ingeomLabel()Use the
alphaStrokeparameter to applyalphato entirelabel. By default,alphais only applied to the label background.See: example notebook.
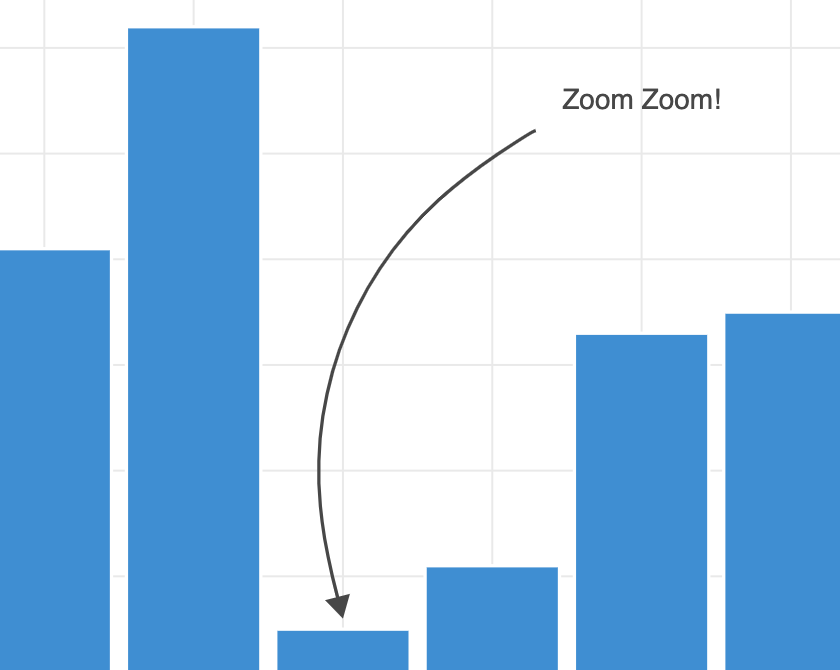
Recent Updates in the Gallery
Change Log
See CHANGELOG.md.
Code of Conduct
This project and the corresponding community are governed by the JetBrains Open Source and Community Code of Conduct. Please make sure you read it.
License
Code and documentation released under the MIT license. Copyright © 2019-2024, JetBrains s.r.o.
