Kunalb Panopticon Save
Python tracing module to visualize code execution.
Panopticon

![]()

![]()
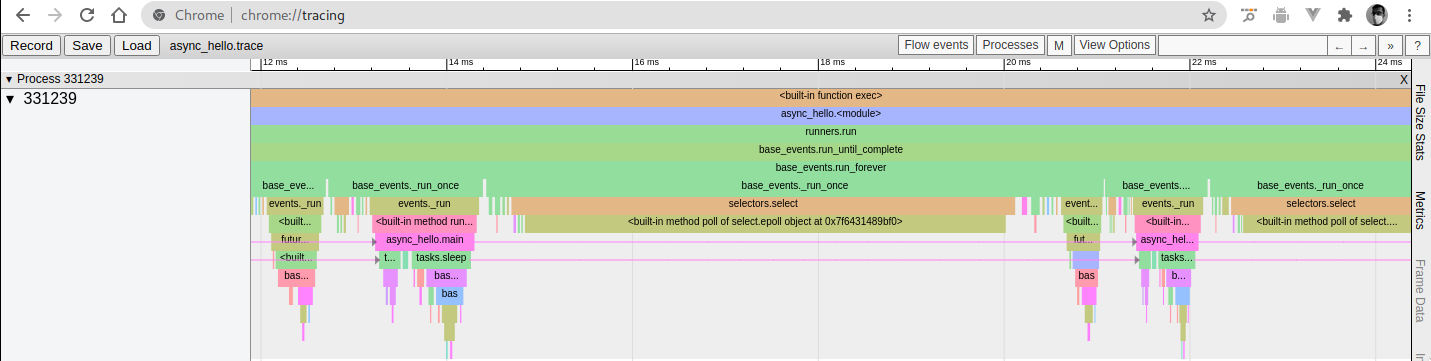
Panopticon is a debugger-powered tracer for Python code to quickly visualize and explore code execution. Traces generated are Catapult compatible — available at `chrome://tracing` if you're using Chrome.
Alpha: I'm still working on adding tests, polishing the api, and cleaning up the code in general. Expect the API to change drastically as it meanders towards v1. It should still be immediately useful as a debugging tool. Please report issues if you come across bugs!
Usage
You can read a more detailed guide with several examples of simple Python programs, different interfaces to visualize them and the corresponding traces at explog.in/notes/panopticon.html.
Run a command directly
python3 -m panopticon -c "print('hello')" -o print_hello.trace
Run a file
python3 -m panopticon -o file.trace file.py
In code
from panopticon import record_trace

with record_trace("print_hello.trace"):
    print("Hello")
Probe a specific function
It can be tricky to control how a program is executed: using the probe decorator allows instrumenting a specific function instead.
from panopticon.probe import probe
from panopticon.trace import StreamingTrace

@probe(trace=StreamingTrace(open("probe.trace", "w")))
def myfunction():
    ...
Asynchronous Functions
Python supports suspending and continuing execution of a frame through generators, coroutines and asynchronous generators. Panopticon creates "flow" events to connect a single frame executing through time, making it easier to visualize what's actually happening.
You can enable/disable connections for different types of functions by choosing to enable/disable flow events in Catapult (top-right).
Changelog
0.0.4
- Reimplement probes to be more robust and avoid capturing all contents
- Support for probing functions, coroutines, generators and async generators
- Probes can now write to multiple traces
0.0.3
- Added basic support for capturing arguments in traces
- New utility to "flatten" complex or sparse traces for readability
- Improved naming behavior when
selfis modified - Extremely basic support for async probes
0.0.2
- Added a simplified record_trace API
- Added support for @probe to instrument functions and classes
0.0.1
- Initial version of Panopticon
- CLI supports running commands and files for tracing
