Kis Chartify Save
📊 📈 📉 React.js plugin for building charts using CSS
Chartify
React.js plugin for building charts using CSS.


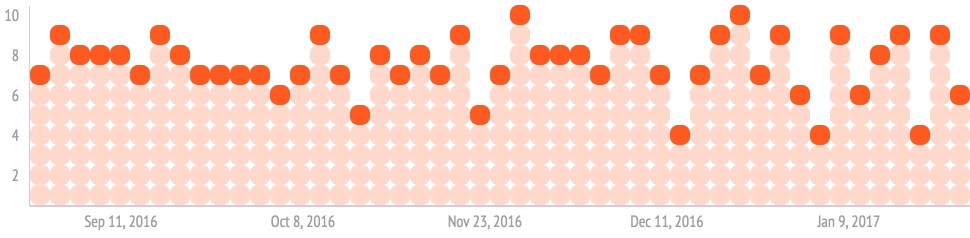
![]()
The source for this module is in the main repo.
Example app is here.
Backend service for the example app is here.
npm package is here.
Install

npm install chartify --save-dev
Getting started
import Chartify from 'chartify';

const data = [{
    xValue: '20.11.2016',
    yValue: 5,
    title: '007 Spectre'
}];

const config = {
    theme: 'blue',
    width: 50,
    height: 10,
    boxSize: 20,
    isLineChart: false,
    bordered: false
};

<Chartify
    data={data}
    container="films-container"
    config={config}
/>
Passing props
Data prop is a dataset that should be an array of objects:
[{ xValue: '12.03.2019', yValue: 8, title: 'men in black' }]
Keys are required and types are:
{ xValue: string, yValue: number, title: string }
Container prop is a class that will be added to the chart container element. This is important in case you have more than one chart on your page.
Config prop is an object with properties:
theme:string - is color scheme of the chart, "default", "blue", "grey", "white" etc.
width:number - is the length of the data array by X-axis.
height:number - is the length of the data by Y-axis.
boxSize:number - is size of each box in pixels.
isLineChart:boolean - is param that determines if this is a line-chart.
bordered:boolean - is param that determines if each box has white borders.
License
The MIT License (MIT) Copyright (c) 2020
