JHChart Save Abandoned
JHChart(最新版本1.2.3)(cocopods 拉取资源包异常已经处理。最近实在太忙,没有及时回复大家的邮件,望见谅见谅!有任何需求添加至Issues即可,谢谢!)


Well, I admit that there are a lot of other graphics libraries on the GitHub. But, because of my project needs, most of the library can not fully meet my needs. So I took out a little free time, I wrote a chart library. Initial plan to write only a few lines (my project needs), did not expect the release to GitHub after a number of friends told me that they need more styles.I don't want to tell them I just intend to do it here, so it's a bit of a development to the present 0.1.1 version, basically meet the needs of users before. Of course, the follow-up will continue to update, add more features.
List of new features for the 1.2.0 version
- The X axis scale of the line chart is displayed vertically, and the overlap of the X axis scales is solved after the data is too long.
- Histogram add click function.
- The table view adds custom background and text attribute functions.
Introduction
A simple, feature rich and customizable iOS development chart library. Click here if you want to see the usage of the Chinese description.
Requirement
- Xcode 7.0+
- iOS 7.0+
Import library
There are two ways to use the JHChart library. * Download the current Demo directly, and then add the JHChart folder to your project * Use CocoaPod import, only need to add the following statement in your Podfile: pod 'JHChart','~>1.2.3'
(If you don't know about cocoapods, click here to go to the official website.)
Detailed usage
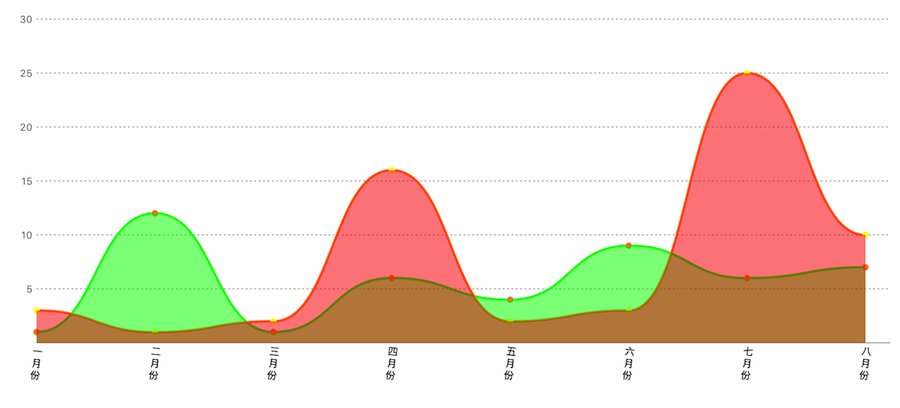
JHLineChart
Description: JHLineChart can create a variety of data sources linear charts, including broken lines and curves, can be based on the data source to determine whether the multiple linear table. And, according to the needs of the interval fill color. At the same time the table supports the different needs of different quadrant, here is just set the first quadrant of the sample, the other quadrant of the use of the same method.
- first quardrant.
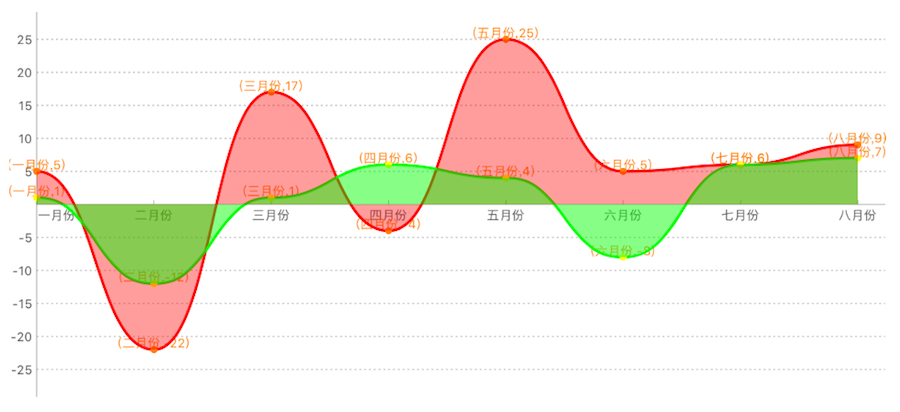
- first and second quardrant.
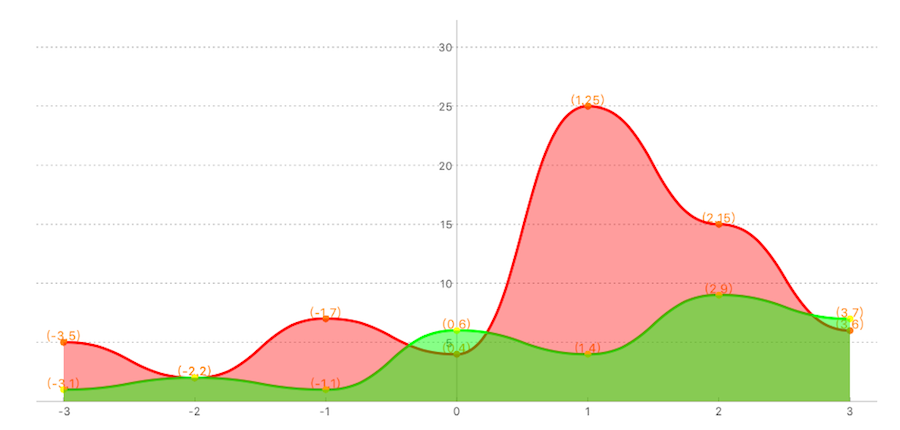
- first and fouth quardrant.
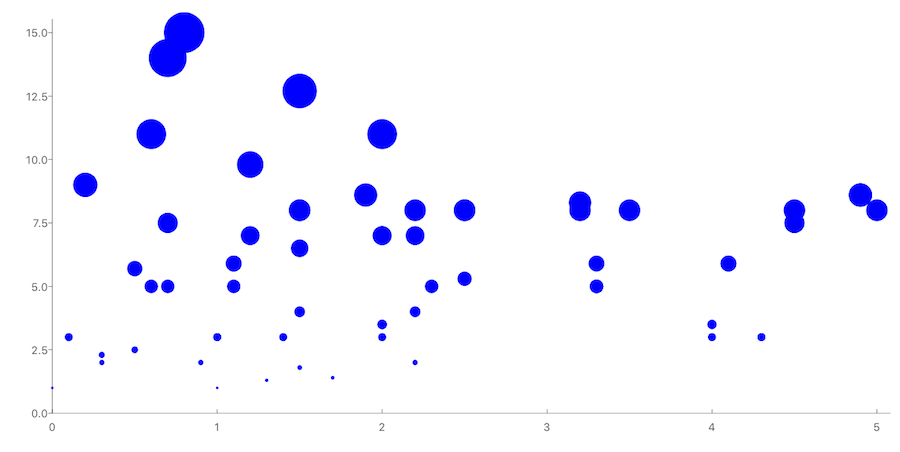
JHScatterChart
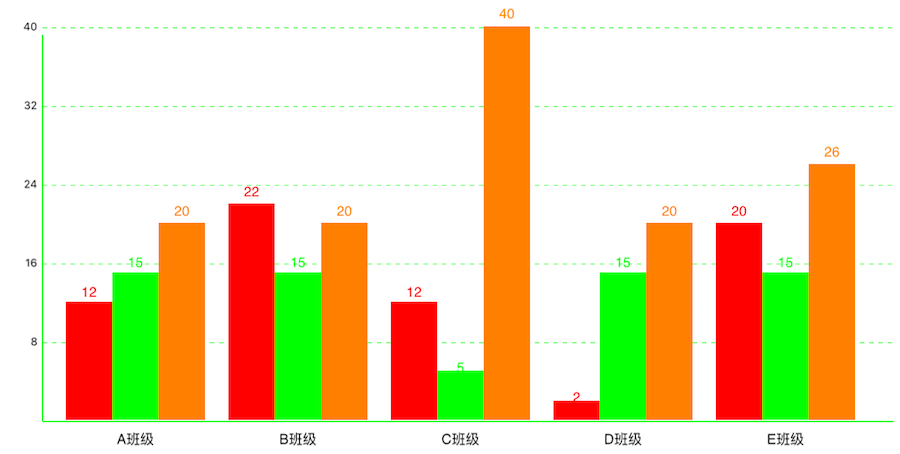
JHColumnChart
Description: JHColumnChart is a rolling column, you can set the data source you need to draw an array of flexible style, it not only set the column of different color, can also provide you a number of descriptive attributes used to mark different styles
- ColumnChart for group
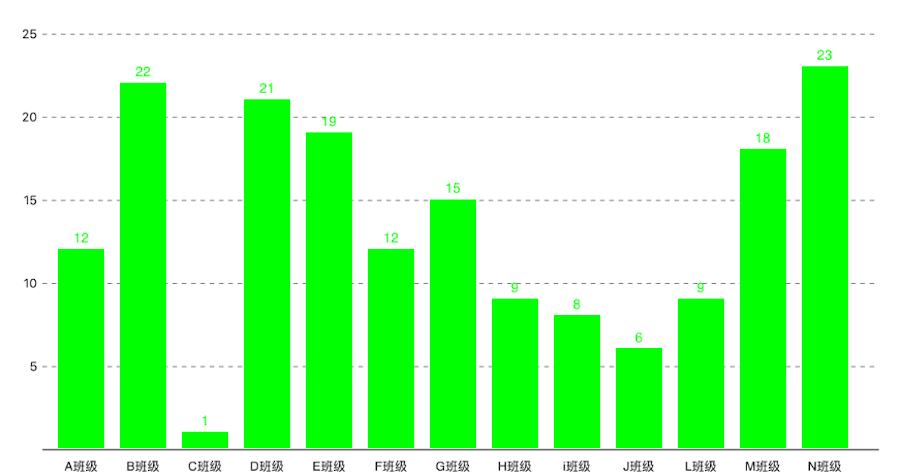
- Nomal ColumnChart
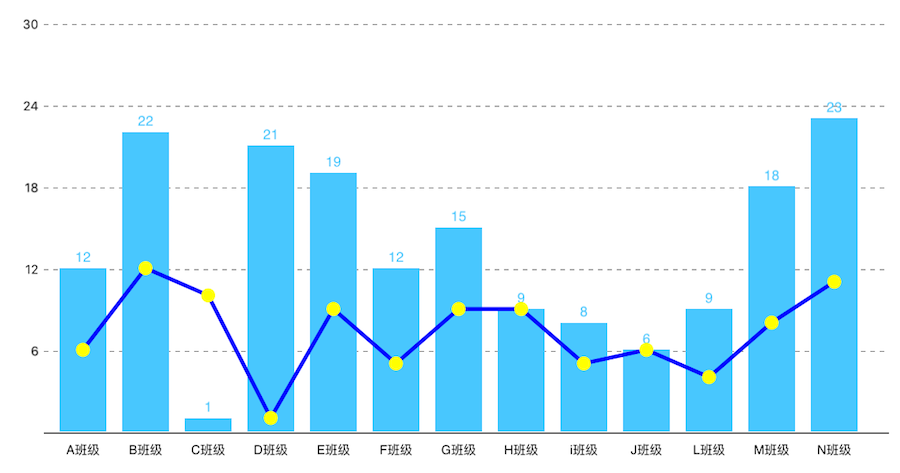
- ColumnChart with lineChart
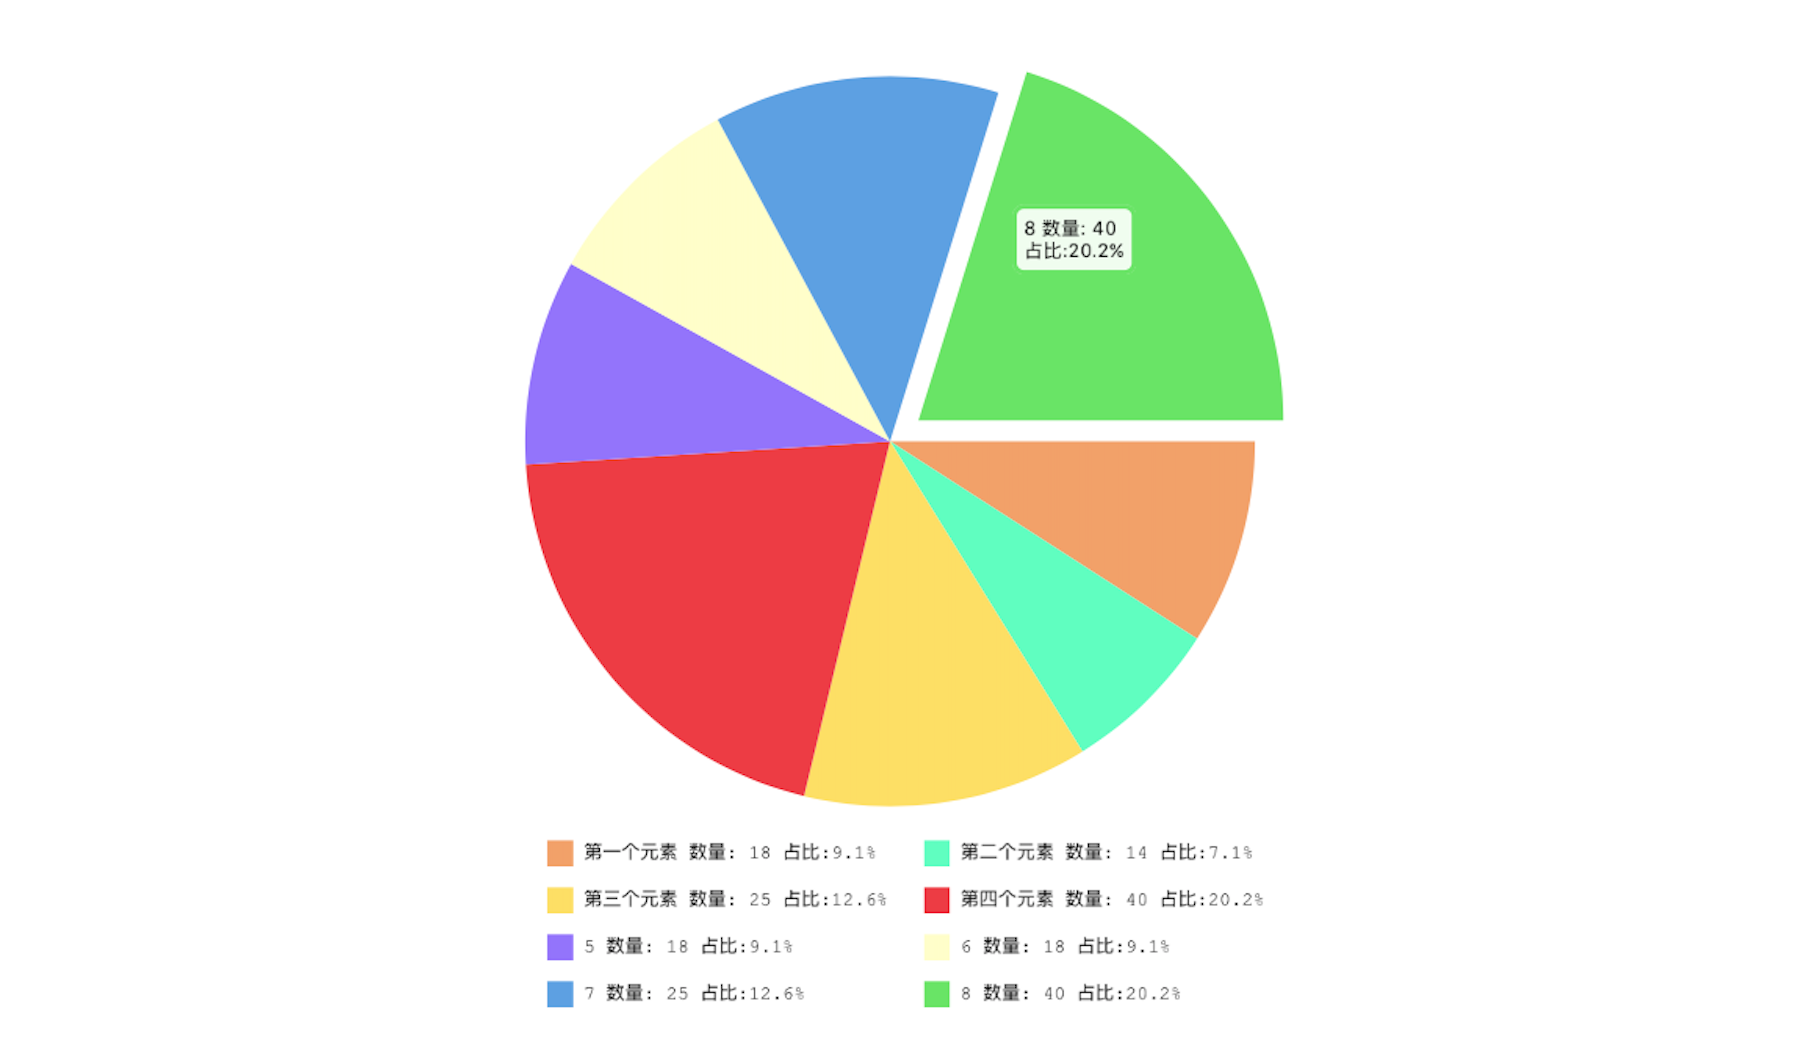
JHPieChart
Description: JHPieChart can be based on your data source and view size settings, automatically generate the appropriate size, and there is a hint of animation pie chart. When you click on a piece of pie chart, the animation shows the current cake block information.
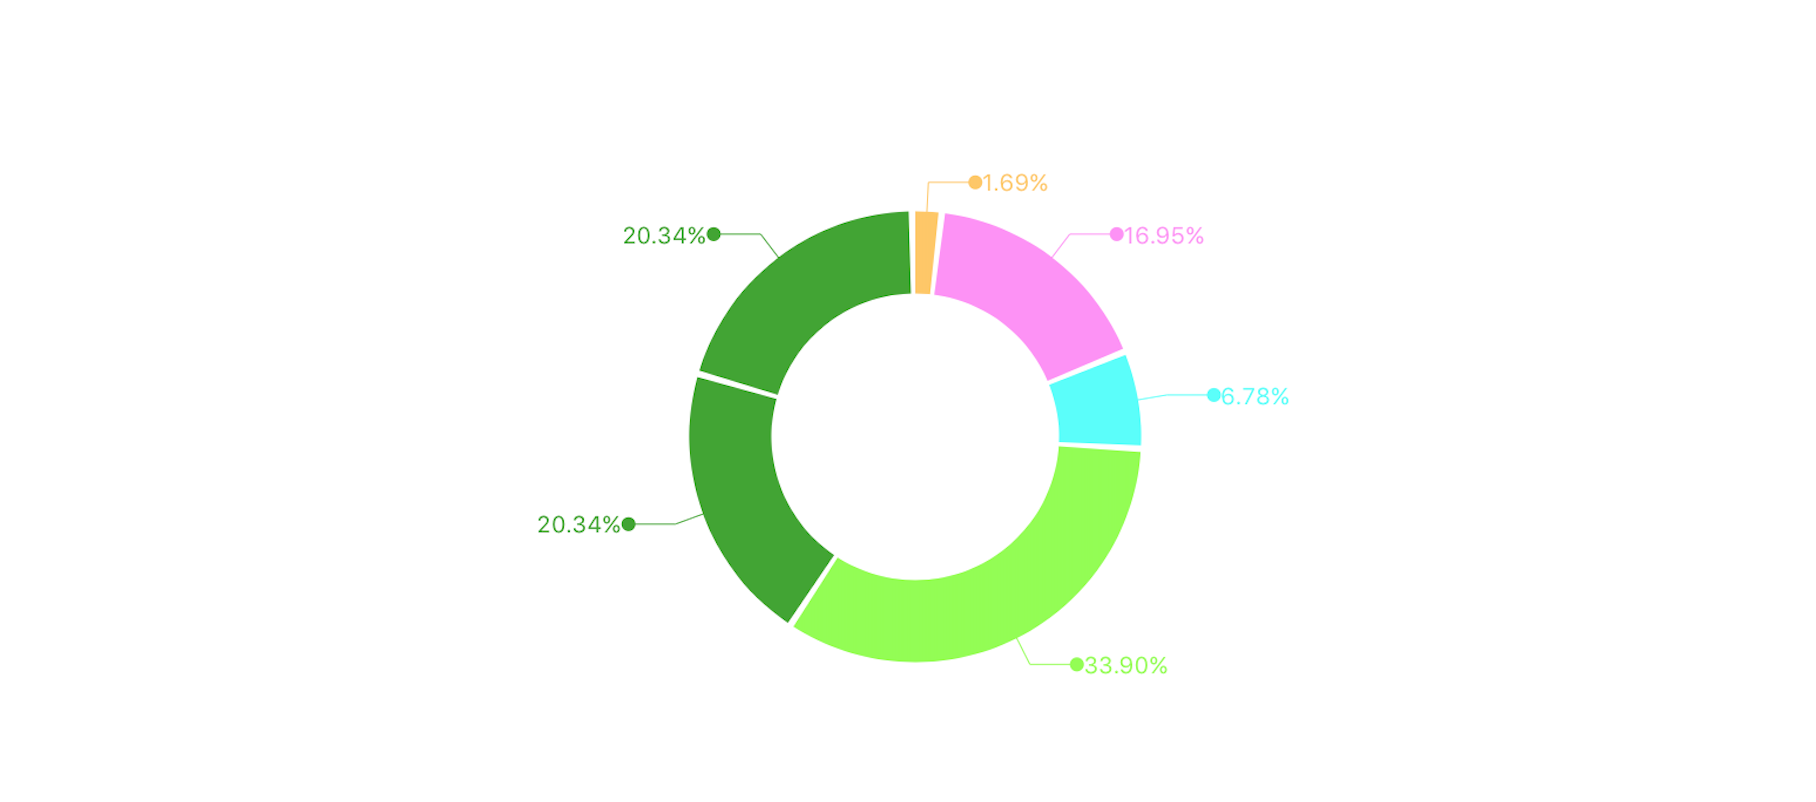
JHRingChart
Description: JHRingChart according to your data source, automatically calculate the proportion of relevant data, the animation shows a ring graph, and from each loop to elicit relevant information tips
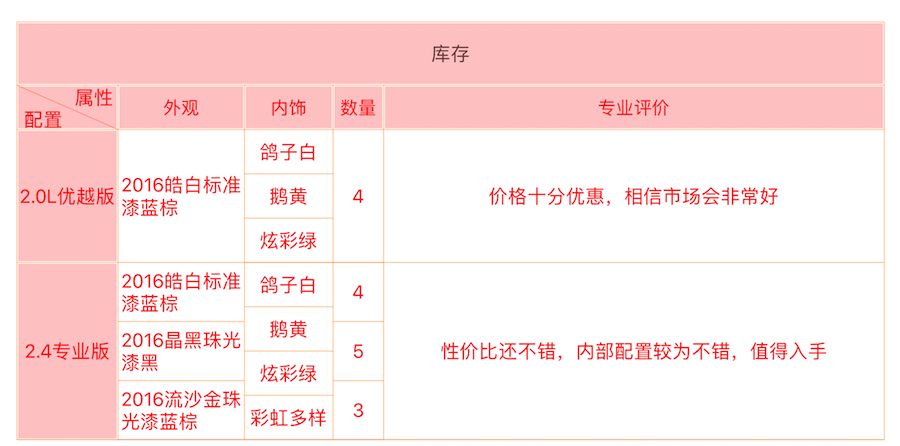
JHTableChart
Description: JHTableChart for static drawing style changing table view, all the cell display style depends on the data source, do not need a special treatment of a cell, is very flexible and easy to use
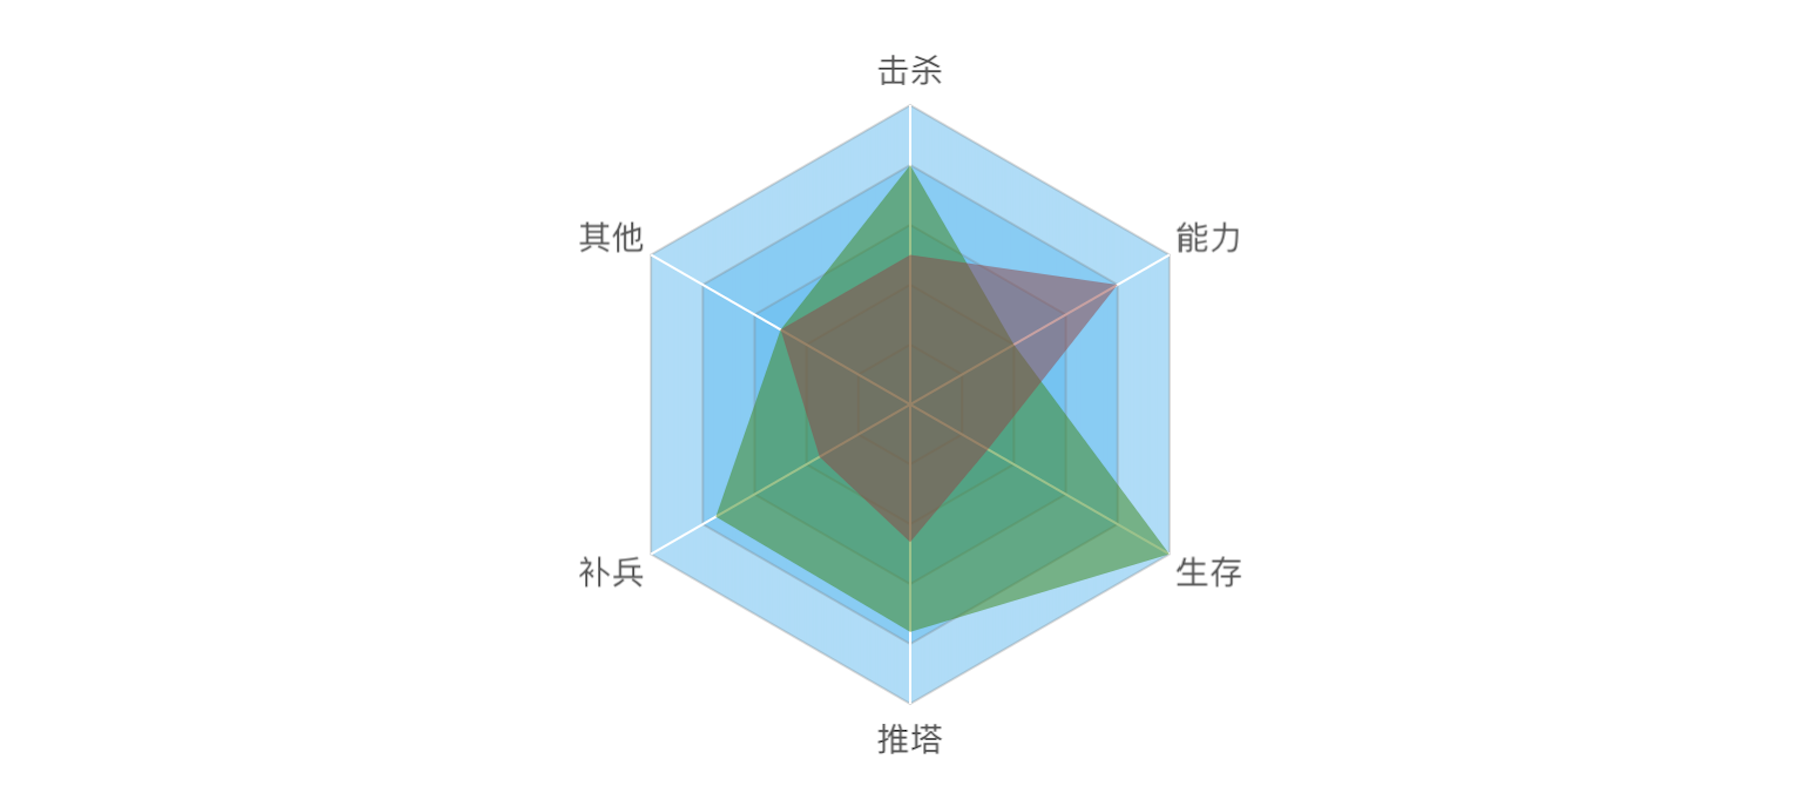
JHRadarChart
Description: JHRadarChart can according to your incoming data description and calculation of drawing data, and pruning, the advantages and disadvantages of each attribute can reflect the image of the
联系方式
- 邮箱:[email protected]
- 简书:不睡觉的鸟
- 博客:Silktree
