Histocartography Save
A standardized Python API with necessary preprocessing, machine learning and explainability tools to facilitate graph-analytics in computational pathology.
![]()

![]()
![]()

Welcome to the histocartography repository! histocartography is a python-based library designed to facilitate the development of graph-based computational pathology pipelines. The library includes plug-and-play modules to perform,
- standard histology image pre-processing (e.g., stain normalization, nuclei detection, tissue detection)
- entity-graph representation building (e.g. cell graph, tissue graph, hierarchical graph)
- modeling Graph Neural Networks (e.g. GIN, PNA)
- feature attribution based graph interpretability techniques (e.g. GraphGradCAM, GraphGradCAM++, GNNExplainer)
- visualization tools
All the functionalities are grouped under a user-friendly API.
If you encounter any issue or have questions regarding the library, feel free to open a GitHub issue. We'll do our best to address it.
Installation
PyPI installer (recommended)
pip install histocartography
Development setup
- Clone the repo:
git clone https://github.com/histocartography/histocartography.git && cd histocartography
- Create a conda environment:
conda env create -f environment.yml
NOTE: To use GPUs, install GPU compatible Pytorch, Torchvision and DGL packages according to your OS, package manager, and CUDA.
- Activate it:
conda activate histocartography
- Add
histocartographyto your python path:
export PYTHONPATH="<PATH>/histocartography:$PYTHONPATH"
Tests
To ensure proper installation, run unit tests as:
python -m unittest discover -s test -p "test_*" -v
Running tests on cpu can take up to 20mn.
Using histocartography
The histocartography library provides a set of helpers grouped in different modules, namely preprocessing, ml, visualization and interpretability.
For instance, in histocartography.preprocessing, building a cell-graph from an H&E image is as simple as:
>> from histocartography.preprocessing import NucleiExtractor, DeepFeatureExtractor, KNNGraphBuilder
>>
>> nuclei_detector = NucleiExtractor()
>> feature_extractor = DeepFeatureExtractor(architecture='resnet34', patch_size=72)
>> knn_graph_builder = KNNGraphBuilder(k=5, thresh=50, add_loc_feats=True)
>>
>> image = np.array(Image.open('docs/_static/283_dcis_4.png'))
>> nuclei_map, _ = nuclei_detector.process(image)
>> features = feature_extractor.process(image, nuclei_map)
>> cell_graph = knn_graph_builder.process(nuclei_map, features)
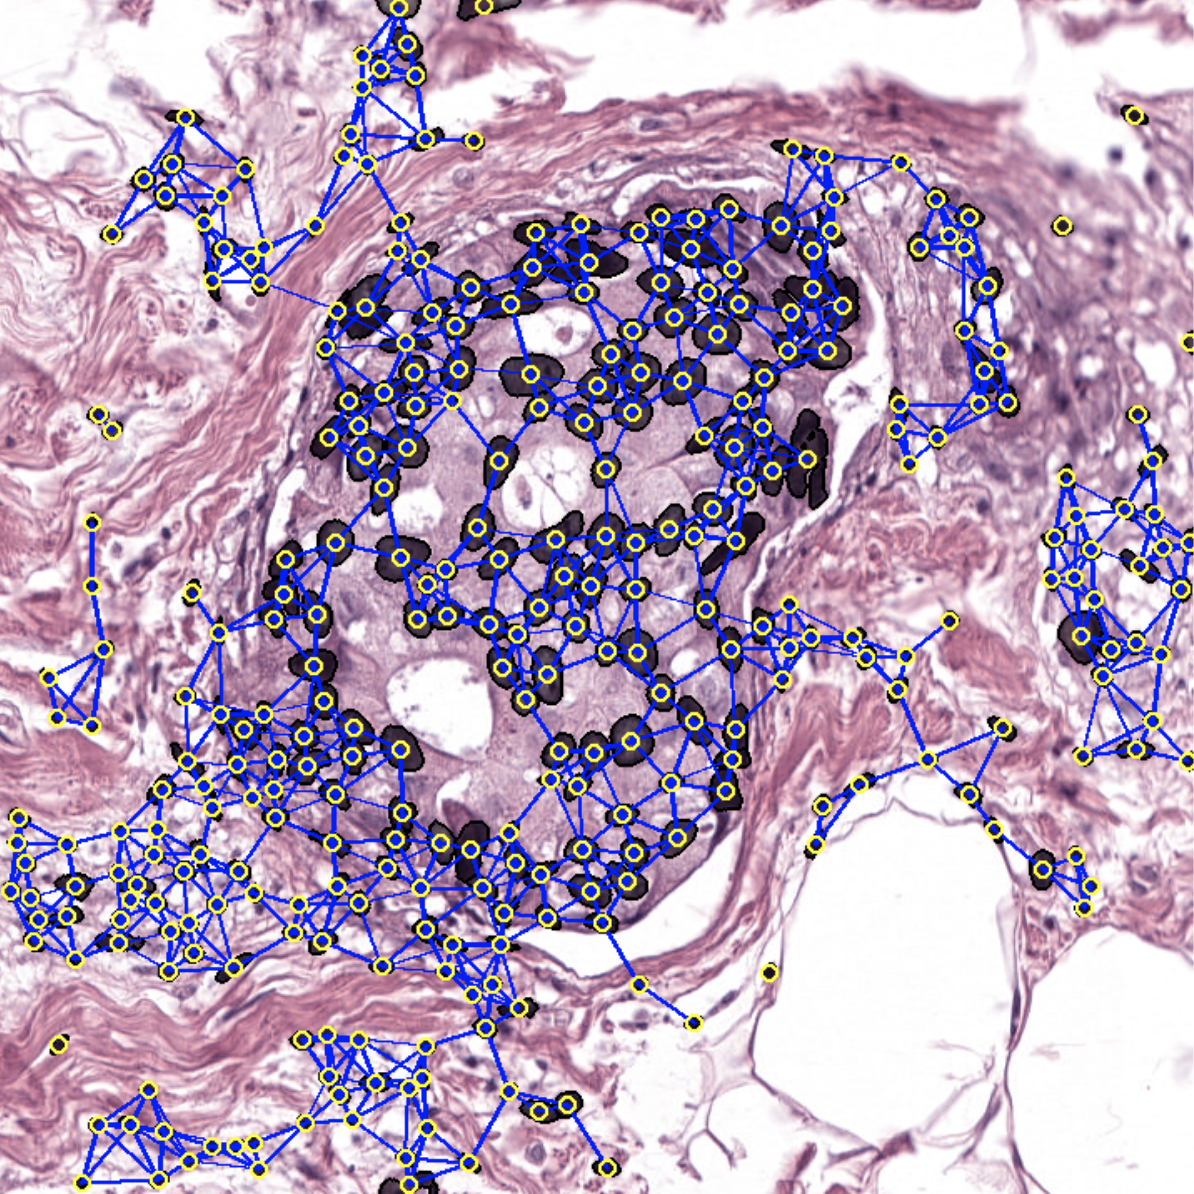
The output can be then visualized with:
>> from histocartography.visualization import OverlayGraphVisualization, InstanceImageVisualization

>> visualizer = OverlayGraphVisualization(
...     instance_visualizer=InstanceImageVisualization(
...         instance_style="filled+outline"
...     )
... )
>> viz_cg = visualizer.process(
...     canvas=image,
...     graph=cell_graph,
...     instance_map=nuclei_map
... )
>> viz_cg.show()
A list of examples to discover the capabilities of the histocartography library is provided in examples. The examples will show you how to perform:
- stain normalization with Vahadane or Macenko algorithm
- cell graph generation to transform an H&E image into a graph-based representation where nodes encode nuclei and edges nuclei-nuclei interactions. It includes: nuclei detection based on HoverNet pretrained on PanNuke dataset, deep feature extraction and kNN graph building.
- tissue graph generation to transform an H&E image into a graph-based representation where nodes encode tissue regions and edges tissue-to-tissue interactions. It includes: tissue detection based on superpixels, deep feature extraction and RAG graph building.
- feature cube extraction to extract deep representations of individual patches depicting the image
- cell graph explainer to generate an explanation to highlight salient nodes. It includes inference on a pretrained CG-GNN model followed by GraphGradCAM explainer.
A tutorial with detailed descriptions and visualizations of some of the main functionalities is provided here as a notebook.
External Ressources
Learn more about GNNs
- We have prepared a gentle introduction to Graph Neural Networks. In this tutorial, you can find slides, notebooks and a set of reference papers.
- For those of you interested in exploring Graph Neural Networks in depth, please refer to this content or this one.
Papers already using this library
- Hierarchical Graph Representations for Digital Pathology, Pati et al., Medical Image Analysis, 2021. [pdf] [code]
- Quantifying Explainers of Graph Neural Networks in Computational Pathology, Jaume et al., CVPR, 2021. [pdf] [code]
- Learning Whole-Slide Segmentation from Inexact and Incomplete Labels using Tissue Graphs, Anklin et al., MICCAI, 2021. [pdf] [code]
If you use this library, please consider citing:
@inproceedings{jaume2021,
    title = {HistoCartography: A Toolkit for Graph Analytics in Digital Pathology},
    author = {Guillaume Jaume, Pushpak Pati, Valentin Anklin, Antonio Foncubierta, Maria Gabrani},
    booktitle={MICCAI Workshop on Computational Pathology},
    pages={117--128},
    year = {2021}
}

@inproceedings{pati2021,
    title = {Hierarchical Graph Representations for Digital Pathology},
    author = {Pushpak Pati, Guillaume Jaume, Antonio Foncubierta, Florinda Feroce, Anna Maria Anniciello, Giosuè Scognamiglio, Nadia Brancati, Maryse Fiche, Estelle Dubruc, Daniel Riccio, Maurizio Di Bonito, Giuseppe De Pietro, Gerardo Botti, Jean-Philippe Thiran, Maria Frucci, Orcun Goksel, Maria Gabrani},
    booktitle = {Medical Image Analysis (MedIA)},
    volume={75},
    pages={102264},
    year = {2021}
}
