Eurybia Save
⚓ Eurybia monitors model drift over time and securizes model deployment with data validation
![]()


🔍 Overview
Eurybia is a Python library which aims to help in :
- Detecting data drift and model drift
- Validate data before putting a model in production.
Eurybia addresses challenges of industrialisation and maintainability of machine learning models over time. Thus, it contributes for better model monitoring, model auditing and more generally AI governance.
To do so, Eurybia generates an HTML report:

🕐 Quickstart
The 3 steps to display results:
- Step 1: Declare SmartDrift Object
you need to pass at least 2 pandas DataFrames in order to instantiate the SmartDrift class (Current or production dataset, baseline or training dataset)
from eurybia import SmartDrift

sd = SmartDrift(
    df_current=df_current,
    df_baseline=df_baseline,
    deployed_model=my_model,  # Optional: put in perspective result with importance on deployed model
    encoding=my_encoder,  # Optional: if deployed_model and encoder to use this model
    dataset_names={
        "df_current": "Current dataset Name",
        "df_baseline": "Baseline dataset Name",
    },  # Optional: Names for outputs
)
- Step 2: Compile Model
There are different ways to compile the SmartDrift object
sd.compile(
    full_validation=True,  # Optional: to save time, leave the default False value. If True, analyze consistency on modalities between columns.
    date_compile_auc="01/01/2022",  # Optional: useful when computing the drift for a time that is not now
    datadrift_file="datadrift_auc.csv",  # Optional: name of the csv file that contains the performance history of data drift
)
- Step 3: Generate report
The report's content will be enriched if you provided the datascience model (deployed) and its encoder. Note that providing the deployed_model and encoding will only produce useful results if the datasets are both usable by the model (i.e. all features are present, dtypes are correct, etc).
sd.generate_report(
    output_file="output/my_report_name.html",
    title_story="my_report_title",
    title_description="my_report_subtitle",  # Optional: add a subtitle to describe report
    project_info_file="project_info.yml",  # Optional: add information on report
)
🛠 Installation
Eurybia is intended to work with Python versions 3.8 to 3.10. Installation can be done with pip:
pip install eurybia
If you encounter compatibility issues you may check the corresponding section in the Eurybia documentation here.
🔥 Features
- Display clear and understandable insightful report :


- Allow Data Scientists to quickly explore drift thanks to dynamic reports to easily navigate between drift detection and datasets features.
In a nutshell :
-
Monitoring drift using a scheduler (like Airflow)
-
Evaluate level of data drift
-
Facilitate collaboration between data analysts and data scientists, and easily share and discuss results with non-Data users
More precisely :
-
Render data drift and model drift over time through :
- Feature importance: features that discriminate the most the two datasets
- Scatter plot: Feature importance relatively to the drift importance
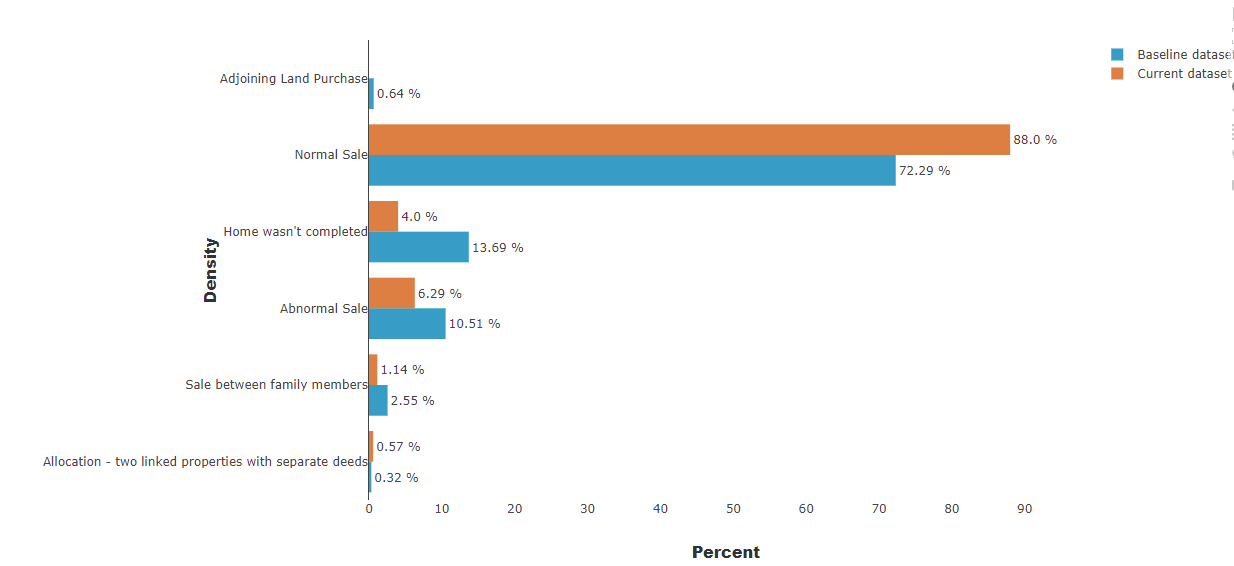
- Dataset analysis: distribution comparison between variable from the baseline dataset and the newest one
- Predicted values analysis: distribution comparison between targets from the baseline dataset and the newest one
- Performance of the data drift classifier
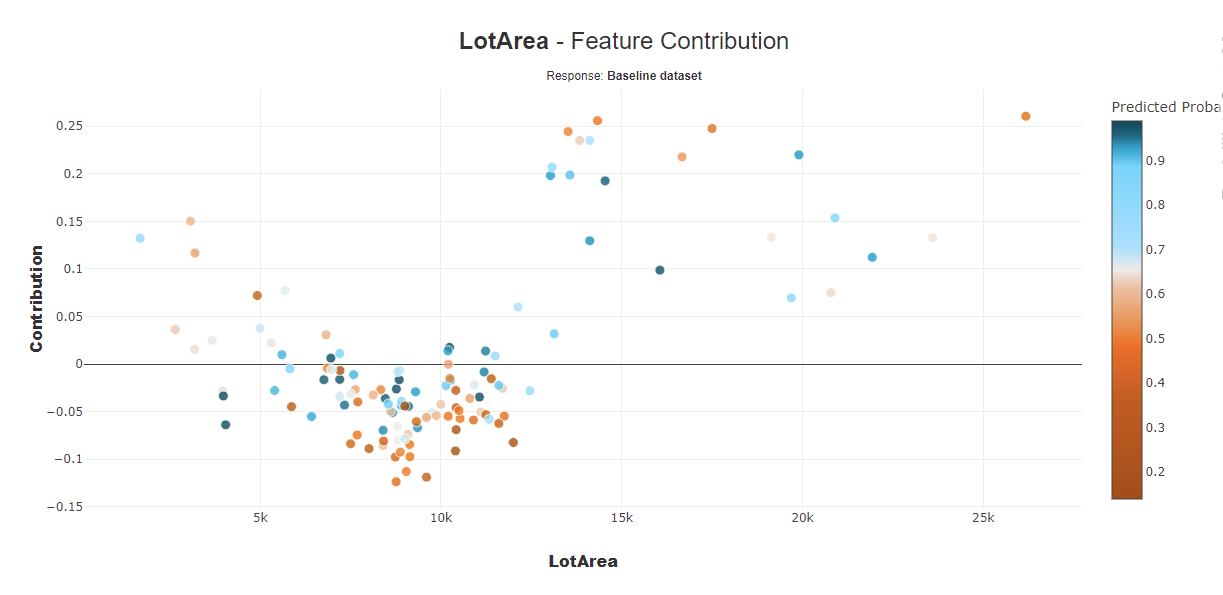
- Features contribution for the data drift classifier
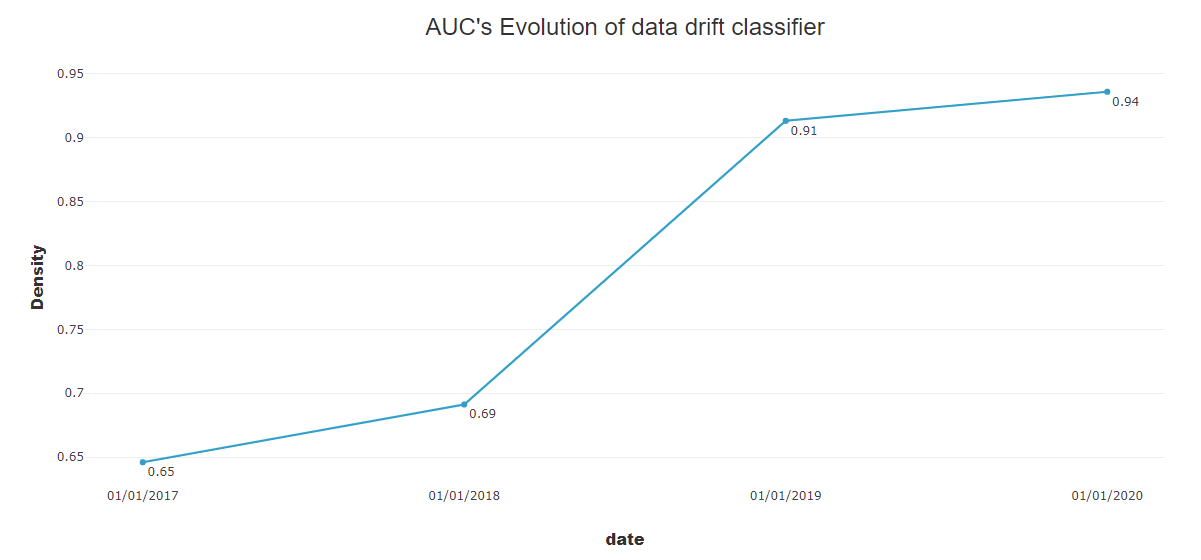
- AUC evolution: comparison of data drift classifier at different period.
- Model performance evolution: your model performances over time
📢 Why we made Eurybia
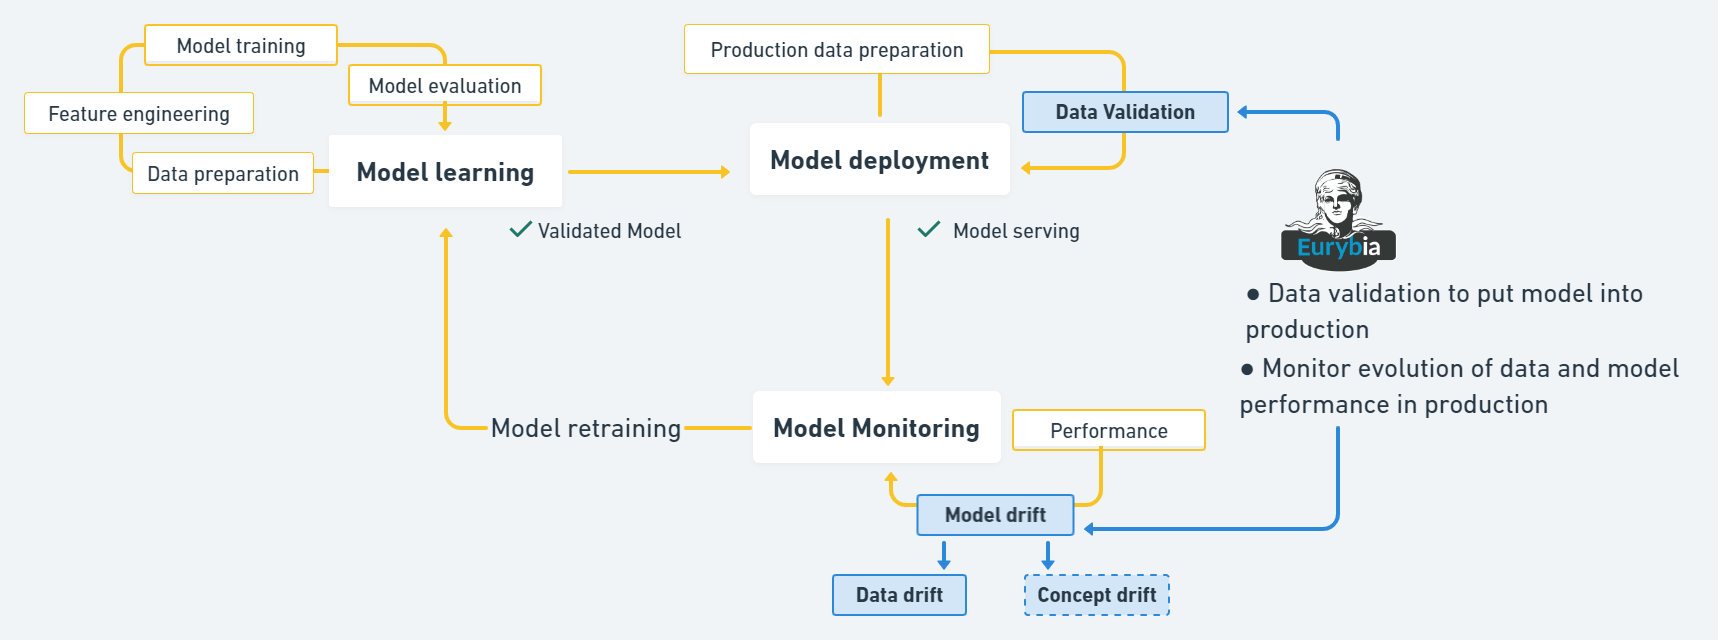
The visualization of the life cycle of a machine learning model can ease the understanding of Eurybia importance. During their life, ML models go through the following phases: Model learning, Model deployment, Model monitoring.
Let's respectively name features, target and prediction of a model X, Y and P(X, Y). P(X, Y) can be decompose as : P(X, Y) = P(Y|X)P(X), with P(Y|X), the conditional probability of ouput given the model features, and P(X) the probability density of the model features.
Data Validation : Validate that data used for production prediction are similar to training data or test data before deployment. With formulas, P(Xtraining) similar to P(XtoDeploy)
Data drift : Evolution of the production data over time compared to training or test data before deployment. With formulas, compare P(Xtraining) to P(XProduction)
Model drift : Model performances' evolution over time due to change in the target feature statistical properties (Concept drift), or due to change in data (Data drift). With formulas, when change in P(Y|XProduction) compared to P(Y|Xtraining) is concept drift. And change in P(Y,XProduction) compared to P(Y,Xtraining) is model drift
Eurybia helps data analysts and data scientists to collaborate through a report that allows them to exchange on drift monitoring and data validation before deploying model into production.
Eurybia also contributes to data science auditing by displaying usefull information about any model and data in a unique report.
⚙️ How Eurybia detect data drift
Eurybia works mainly with a binary classification model (named datadrift classifier) that tries to predict whether a sample belongs to the training dataset (or baseline dataset) or to the production dataset (or current dataset).

As shown below on the diagram, there are 2 datasets, the baseline and the current one. Those datasets are those we wish to compare in order to assess if data drift occurred. On the first one we create a column named “target”, it will be filled only with 0, on the other hand on the second dataset we also add this column, but this time it will be filled only with 1 values.
Our goal is to build a binary classification model on top of those 2 datasets (concatenated). Once trained, this model will be helpful to tell if there is any data drift. To do so we are looking at the model performance through AUC metric. The greater the AUC the greater the drift is. (AUC = 0.5 means no data drift and AUC close to 1 means data drift is occuring)
The explainability of this datadrift classifier allows to prioritise features that are important for drift and to focus on those that have the most impact on the model in production.
To use Eurybia to monitor drift over time, you can use a scheduler to make computations automatically and periodically.
One of the schedulers you can use is Apache Airflow. To use it, you can read the official documentation and read blogs like this one: Getting started with Apache Airflow
🔬 Built With
This section list libraries used in Eurybia.
📖 Tutorials
This github repository offers a lot of tutorials to let you to quickly start using Eurybia.
Overview
Validate Data before model deployment
Measure and analyze Data drift
Measure and analyze Model drift
More details about report and plots
🔭 Roadmap
- Concept Drift
Detecting drift concept and get analyses and explainability of this drift. An issue is open: Add Concept Drift
- API mode
Adapting Eurybia for models consumed in API mode. An issue is open: Adapt Eurybia to API mode
If you want to contribute, you can contact us in the discussion tab
