DDSpiderChart Save
Easy to use Spider (Radar) Chart library for iOS written in Swift.
DDSpiderChart


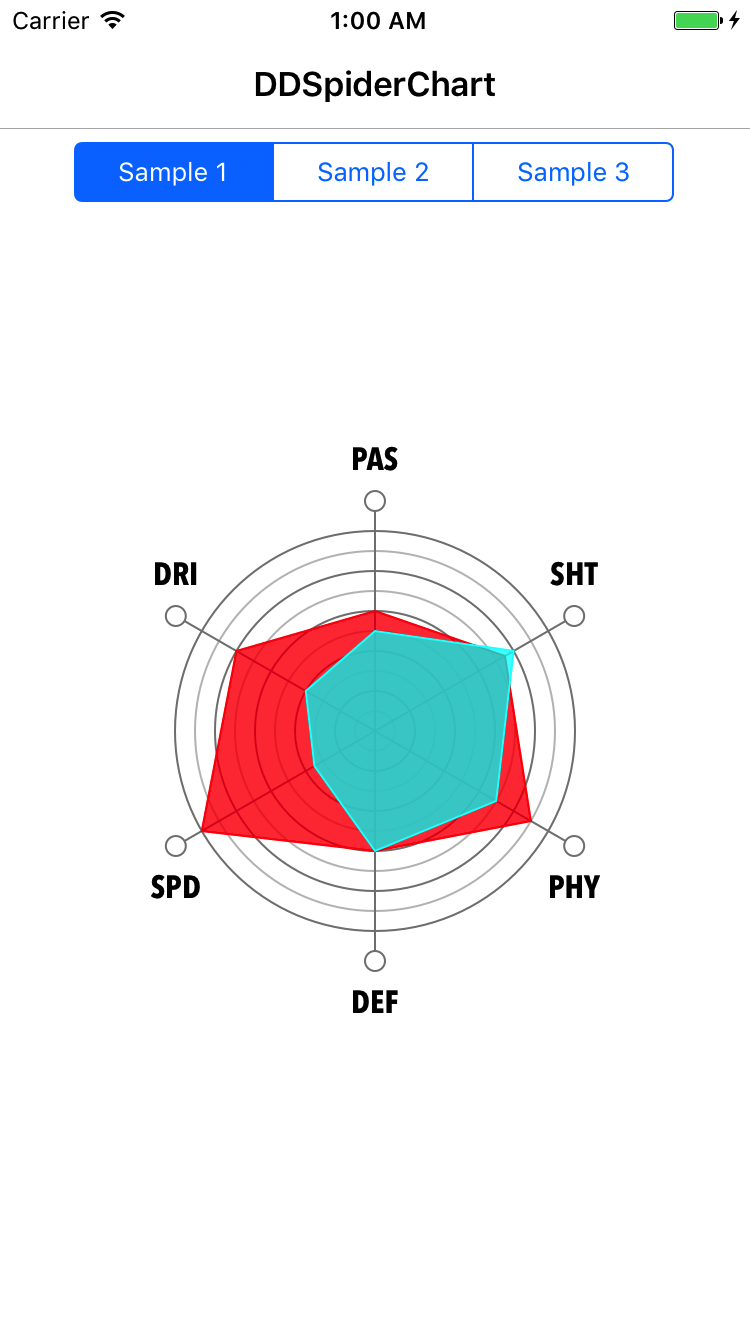
Easy to use Spider (Radar) Chart library for iOS written in Swift.

Requirements
- iOS 11.0+ / macOS 11.10+ / tvOS 11.0+ / watchOS 9.0+
- Xcode 12.0+
- Swift 3.0+
- SwiftUI 14+
Installation
CocoaPods
DDSpiderChart is available through CocoaPods. To install it, simply add the following line to your Podfile:
pod "DDSpiderChart"
Swift Package Manager
The Swift Package Manager is a tool for automating the distribution of Swift code and is integrated into the swift compiler.
Once you have your Swift package set up, adding TKRadarChart as a dependency is as easy as adding it to the dependencies value of your `Package.swift.
dependencies: [
    .package(url: "https://github.com/dadalar/DDSpiderChart", .upToNextMajor(from: "0.6"))
]
Usage
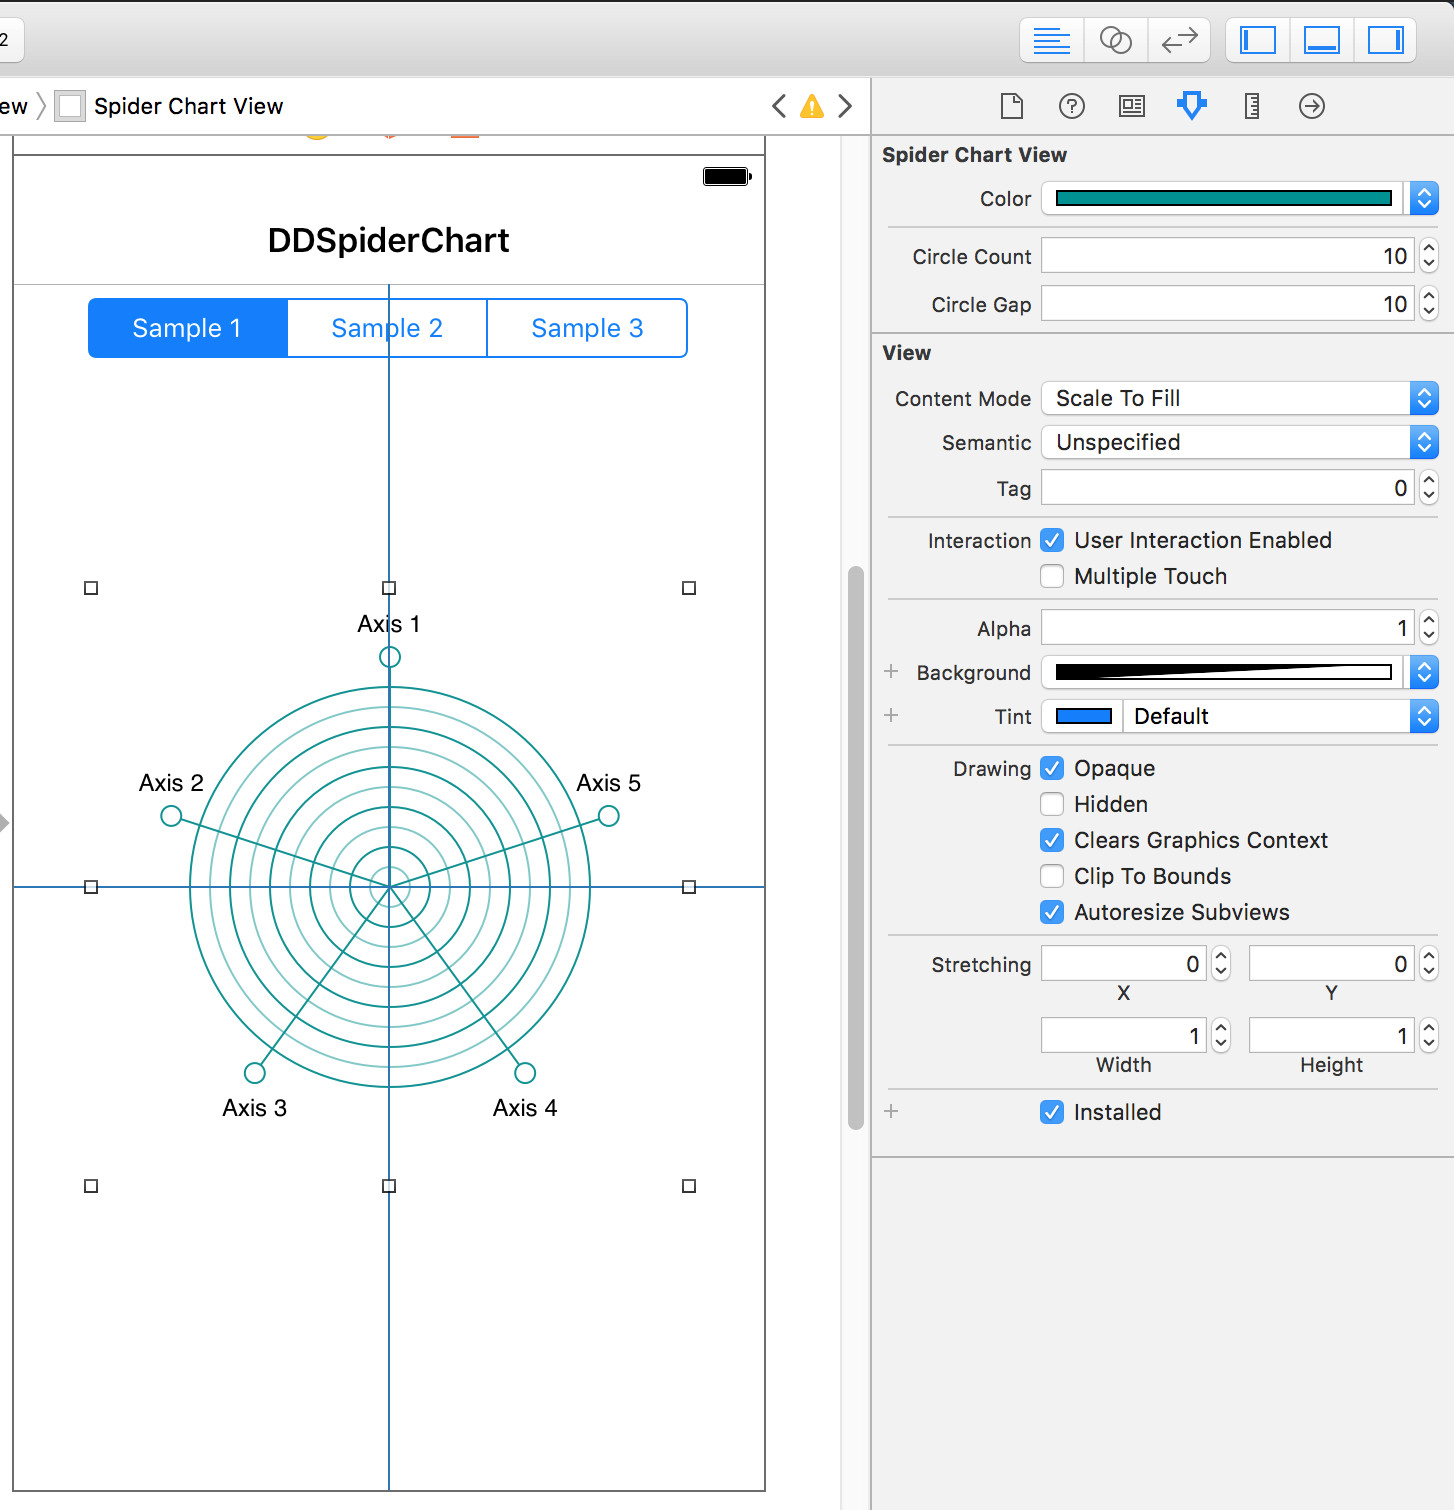
Styling in Interface Builder
You can use DDSpiderChartView within Interface Builder. Just drag & drop a UIView and set its class to DDSpiderChartView. The library supports IBDesignable protocol, so you will see your customized chart in Xcode.
Programmatically
To create a new instance of the chart:
let spiderChartView = DDSpiderChartView(frame: .zero) // Replace with some frame or add constraints
spiderChartView.axes = ["Axis 1", "Axis 2", "Axis 3", "Axis 4"] // Set axes by giving their labels
spiderChartView.addDataSet(values: [1.0, 0.5, 0.75, 0.6], color: .red) // Add first data set
spiderChartView.addDataSet(values: [0.9, 0.7, 0.75, 0.7], color: .blue) // Add second data set
To create a new instance of the chart in SwiftUI:
DDSpiderChart(
    axes: ["Axis 1", "Axis 2", "Axis 3", "Axis 4"],
    values: [
        DDSpiderChartEntries(values: [1.0, 0.5, 0.75, 0.6], color: .red),
        DDSpiderChartEntries(values: [0.9, 0.7, 0.75, 0.7], color: .blue),
    ],
    fontTitle: .boldSystemFont(ofSize: 16),
    textColor: .black
).frame(width: 300, height: 300)
To remove a data set from chart:
let dataSet1 = spiderChartView.addDataSet(values: [0.9, 0.7, 0.75, 0.7], color: .blue) // Add second data set
// Later
spiderChartView.removeDataSetView(dataSet!)
Customization:
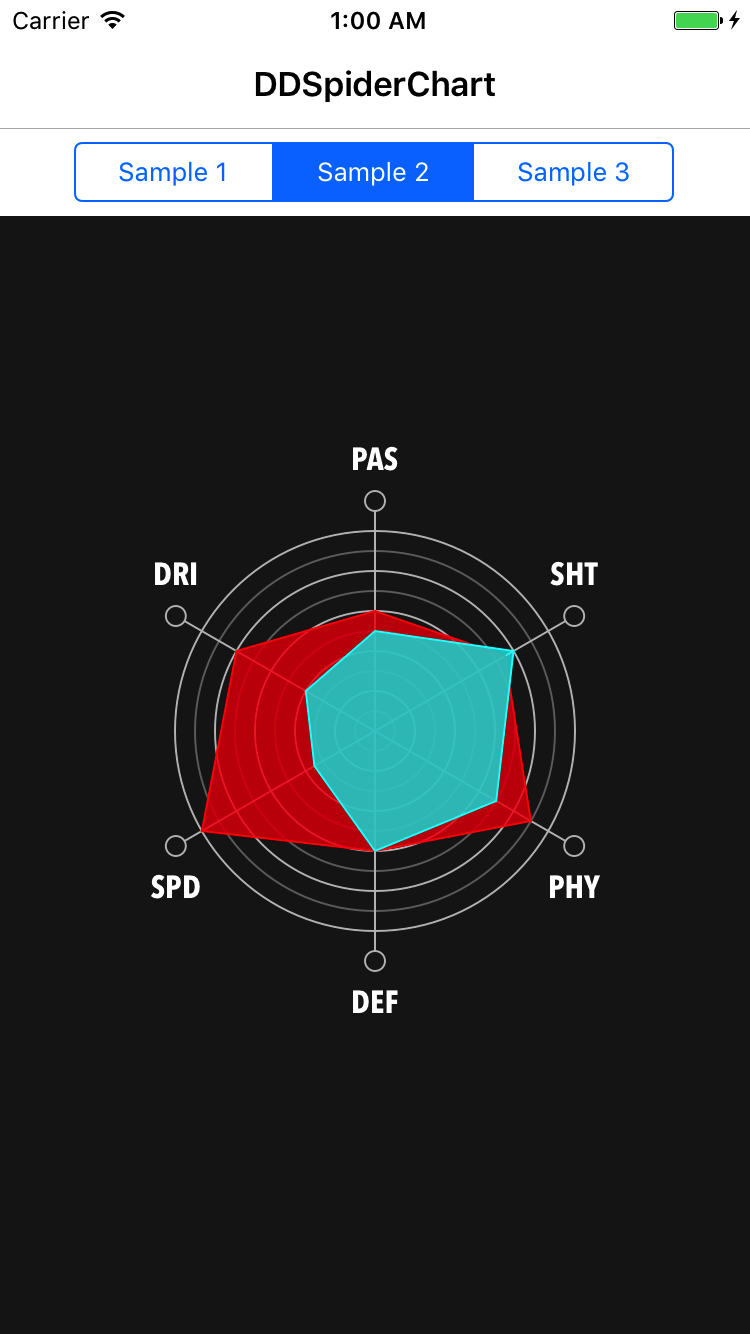
spiderChartView.color = .white // This will change the color of the circles
spiderChartView.circleCount = 20 // How many circles there will be
spiderChartView.circleGap = 5 // The distance between circles
// circleCount * circleGap would be the radius of the chart itself
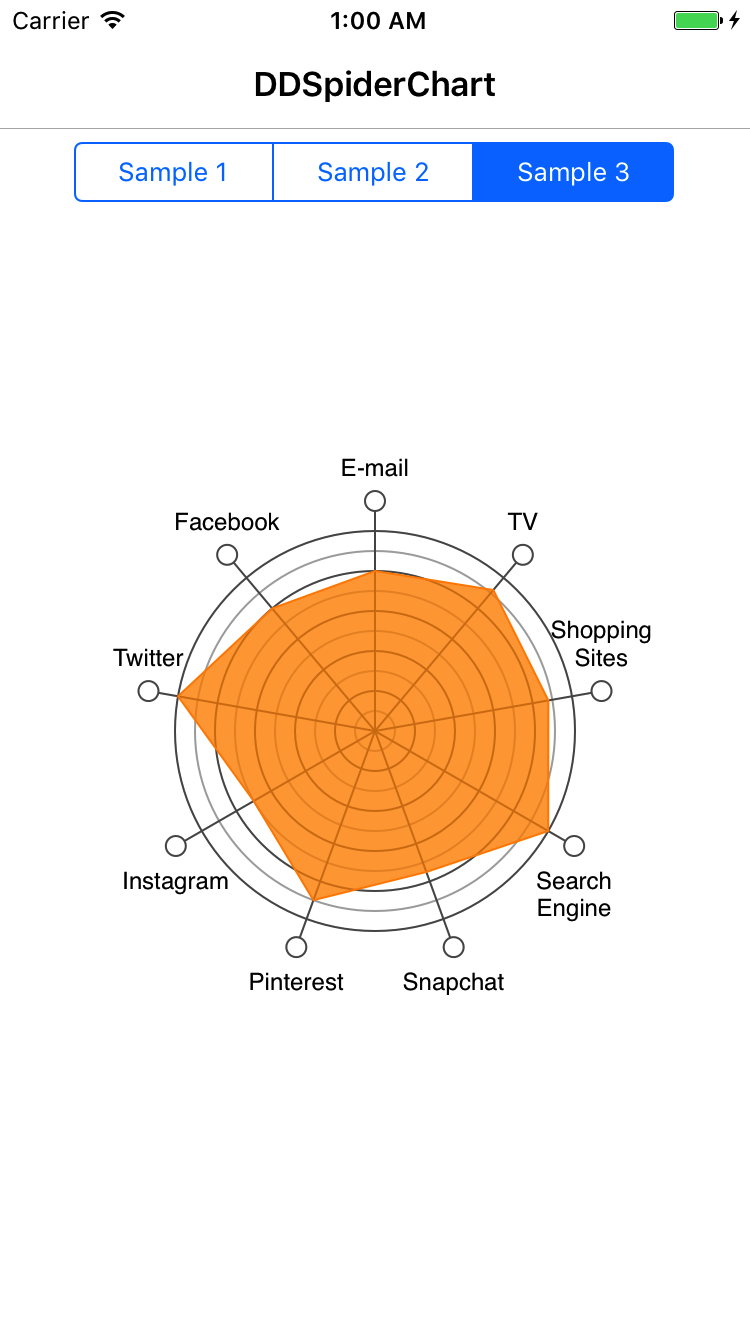
Text Styling: (It just works by passing an array of NSAttributedString's as axes. You have a lot flexibility this way.)
// Custom font with custom size & color example
func attributedAxisLabel(_ label: String) -> NSAttributedString {
  let attributedString = NSMutableAttributedString()
  attributedString.append(NSAttributedString(string: label, attributes: [NSAttributedStringKey.foregroundColor: UIColor.black, NSAttributedStringKey.font: UIFont(name: "AvenirNextCondensed-Bold", size: 16)!]))
  return attributedString
}

override func viewDidLoad() {
  super.viewDidLoad()
  spiderChartView.axes = ["PAS", "DRI", "SPD", "DEF", "PHY", "SHT"].map { attributedAxisLabel($0) }
}
Author
Deniz Adalar, [email protected]
Contributors
Pablo Ruan, [email protected] (SwiftUI, SPM)
License
DDSpiderChart is available under the MIT license. See the LICENSE file for more info.
