Data Science Popular Algorithms Save
Data Science algorithms and topics that you must know. (Newly Designed) Recommender Systems, Decision Trees, K-Means, LDA, RFM-Segmentation, XGBoost in Python, R, and Scala.
TopN Movie Recommender Case Study
View Paper here
View: Python Code here
The MovieLens dataset consisting of 20M ratings and 466K tag applications across 27K movies spanning a period of 20 years, from January 1995 to March 2015, is used to constract simple Top N Movie Recommender that generates N recommendations for a user using Item based Nearest-Neighbor Collaborative Filtering. In case of Item-based CF, the system finds similar items and assuming that similar items will be rated in a similar way by the same person, it predicts the rating corresponding to a user assigned to that item. Usually, the Item-based CF is preferred over the User-based CF because users can change their preferences and choices (aging, change of environment) whereas items (relatively) does not change over time.
Files consists of the following parts:
- Introduction to recommender systems
- Description and Descriptive Statistics for MovieLens data
- MovieLens data visualization
- Methodology: description of Collaborative Filtering (CF) and KNN algorithmms
- Top-N Movie Recommender System Algorithm step-by-step
- Evaluation of the results
Publications:
- Aggarwal, C. (2016). Recommender Systems. Thomas J. Watson Research Center.
- Billsus, D. and Pazzani, M. J. (1998). Learning collaborative information filters. In Proceedings of the Fifteenth International Conference on Machine Learning, pages 46–54. Morgan Kaufmann Publishers Inc.
Linear Discriminant Analysis (LDA) Algorithm
View: R Code here
Note: the code contains LDA and robust LDA mannually written functions (checked with the library function's output)
Linear discriminant analysis (LDA) (don't confuss this with Latent Dirichlit Allocation which is Topic Modelling technique) is a generalization of Fisher's linear discriminant, which is a statistical method to find a linear combination of features that characterizes/separates two or more classes of objects. The resulting combination may be used as a linear classifier. LDA is closely related to analysis of variance (ANOVA) and regression analysis, which also attempt to express one (dependent) variable as a linear combination of other (independent) variables. However, ANOVA uses a continuous dependent variable and categorical independent variables, whereas LDA uses a categorical dependent variable (classes of LDA) and continuous independent variables. Logistic regression and Probit regression are more similar to LDA than ANOVA is, as they also explain a categorical (dependent) variable by the values of continuous (independent) variables. The key difference between Logistic Regression/Probit regression and LDA is the assumption about the probability distribution about the explanatory (independent) variables. In case of LDA , fundamental assumtion is that the independent variables are normally distributed. This can be checked by looking at the probability distribution of the variables.
Publications:
- Nasar, S., Aldian, A., Nuredin, J., and Abusaeeda, I. (2016). Classification depend on linear discriminant analysis using desired outputs. 1109(10)
- Zhao, H., Wang, Z., and Nie, F. (2019) A New Formulation of Linear Discriminant Analysis for Robust Dimensionality Reduction. 31(4):629-640
K-Means Algorithm
View Paper here
View R Code here
K-means clustering is a method of vector quantization with a goal to partition n observations into k clusters in which each observation belongs to the cluster with the nearest mean (cluster centers or cluster centroid), serving as a prototype of the cluster. k-means clustering minimizes within-cluster variances (squared Euclidean distances). This algorithm is also referred to as Lloyd's algorithm, particularly in the computer science community. It is sometimes also referred to as "naïve k-means", because there exist much faster alternatives. Target number k needs to be pre-determined, it refers to the number of centroids you need in the dataset. A centroid is the imaginary or real location representing the center of the cluster. Every data point is allocated to each of the clusters through reducing the in-cluster sum of squares. In other words, the K-means algorithm identifies k number of centroids, and then allocates every data point to the nearest cluster, while keeping the centroids as small as possible. The ‘means’ in the K-means refers to averaging of the data; that is, finding the centroid.
Publications:
- Forgy, E. W. (1965). Cluster analysis of multivariate data: efficiency versus interpretability ofclassifications.biometrics, 21:768–769.
- Na, S., Xumin, L. and Yong, G. (2010), Research on k-means Clustering Algorithm: An Improved k-means Clustering Algorithm, 2010, pp. 63-67.
Descision Tree Algorithm
View Paper here
View R Code here
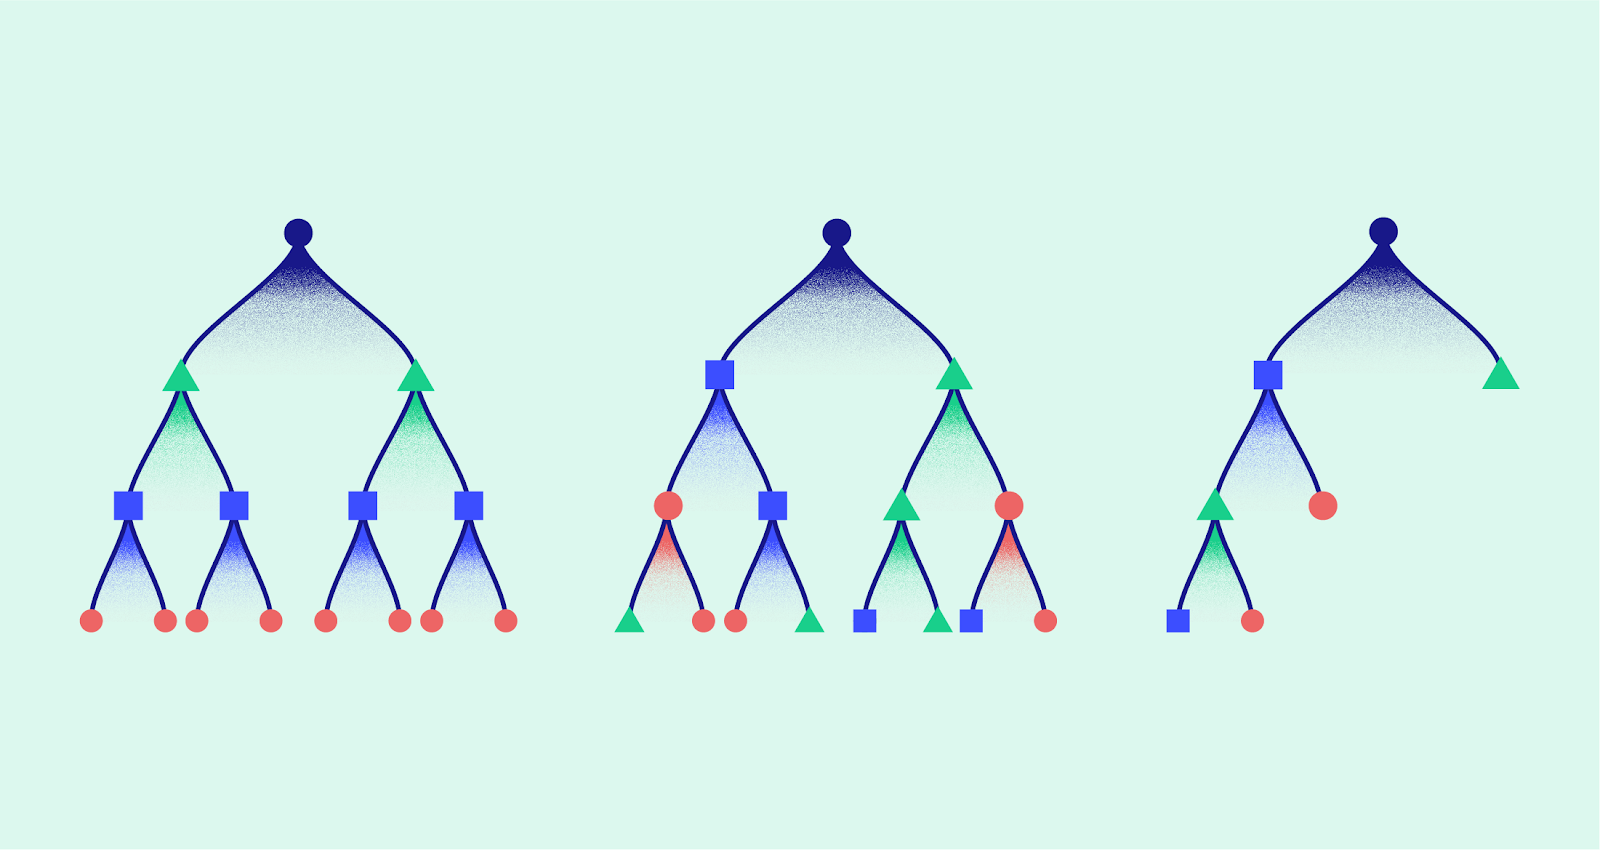
Decision tree is a decision support tool that uses a tree-like model of decisions and their possible consequences, including event probabilities. In Machine Learning, this algorithm is often referred as "Decision Tree Learning". Decision Tree Learning is one of the predictive modelling approaches used in statistics, data mining and machine learning. It uses a Decision Tree (as a predictive model) to cluster the entire sample of observations into clsuters (represented by the leaves of the table). There are two type of Decision Trees: Classification and Regression Trees. Tree models where the target variable can take a discrete set of values are called classification trees; in this type of tree structures, leaves represent class labels and branches represent conjunctions of features that lead to those class labels. Decision Trees where the target variable can take continuous values (usually real numbers) are called regression trees. Because of its intelligibility and simplicity, Decision Tree Algorithms are considered one of most popular ML algorithms.
Publications:
- Haughton, D. and Oulabi, S. (1993). Direct marketing modeling with cart and chaid. Journal of direct marketing, 7(3):16–26
- Duchessi, P. and Lauria, E. (2013). Decision tree models for profiling ski resorts’ promotional and advertising strategies and the impact on sales. 40(15):5822–5829.
Cluster Dyamics Algorithm
View R Code here
Once you have determined the customers are clustered to certain class, for example Good, Better, and Best then it can also be very helpful to predict the likelihood of each custoomer to move the another cluster. If you have computed the likelihood of a customer belonging to each of these three classes, for instance by using Decision Trees, then the only thing yoou have to do to perform comparison between user's current class and the class this customer is most likely to go.
If the two are the same then the customer is likely to stay in the same class whereas, for example, if the user belongs to class Better and has the following likelihood distribution: Good 0.8, Better 0.1, and Best 0.1, then the client is most likely to move from the Better class to the Good class. This is what this algorthm is designed to do for a set of customers and given their clss distributions.
XGBoost Algorithm
View Scala Code here
XGBoost is a decision-tree-based ensemble Machine Learning algorithm that uses a gradient boosting framework. In prediction problems involving unstructured data (images, text, etc.) artificial neural networks tend to outperform all other algorithms or frameworks. However, when it comes to small-to-medium structured/tabular data, decision tree based algorithms are considered best-in-class right now. XGBoost and Gradient Boosting Machines (GBMs) are both ensemble tree methods that apply the principle of boosting weak learners (CARTs generally) using the gradient descent architecture. However, XGBoost improves upon the base GBM framework through systems optimization and algorithmic enhancements.
Publications:
- Chen T., and Guestrin C. E. (2016), XGBoost: A Scalable Tree Boosting System. KDD '16: Proceedings of the 22nd ACM SIGKDD International Conference on Knowledge Discovery and Data MiningAugust :785–794
RFM Customer Segmentation Algorithm
View Paper here
View R Code here
RFM stands for recency, frequency and monetary. RFM segmentation is a great method to identify groups of customers for special treatment. RFM segmentation allows marketers to target specific clusters of customers with communications that are much more relevant for their particular behavior – and thus generate much higher rates of response, plus increased loyalty and customer lifetime value. Data such as purchase history, browsing history, prior campaign response patterns and demographics can all be used to identify specific groups of customers that can be addressed with offers very relevant to each.
- Recency: How much time has elapsed since a customer’s last activity or transaction with the brand?
- Frequency: How often has a customer transacted or interacted with the brand during a particular period of time?
- Monetary: Also referred to as “monetary value,” this factor reflects how much a customer has spent with the brand during a particular period of time.
