D3 Country Bubble Chart Save
Demonstrate positioning elements with D3 forces and animating axes on and off screen.
D3 Country Bubble Chart
This project demonstrates various ways in which D3's forces simulation can lay out elements. Each element is a circle that represents a country. The area of each circle is proportional to the UN's 2015 population estimate of the country. Each circle is filled with a color or the flag of the country.
Watch the D3 Country Bubble Chart video on YouTube. Try the live demo.
Data
The population and country center longitude and latitude data for each country is stored in countries.csv. The continent names used to create the continent color key are stored in continent-names.json. Both files are loaded asynchronously by d3-queue, which initiates the visualization after both files have loaded.
Colors and Flags
One set of radio buttons control whether each circle is filled with a color or the flag of the country. The color represents the continent of the country and is chosen from the schemeCategory10 palette using an ordinal scale.
Each flag is rendered as an SVG image and is stored in the flags folder. The flags are from the googlei18n/region-flags package (see COPYING).
Forces
Another set of radio buttons controls the forces that determine the location of the circles.
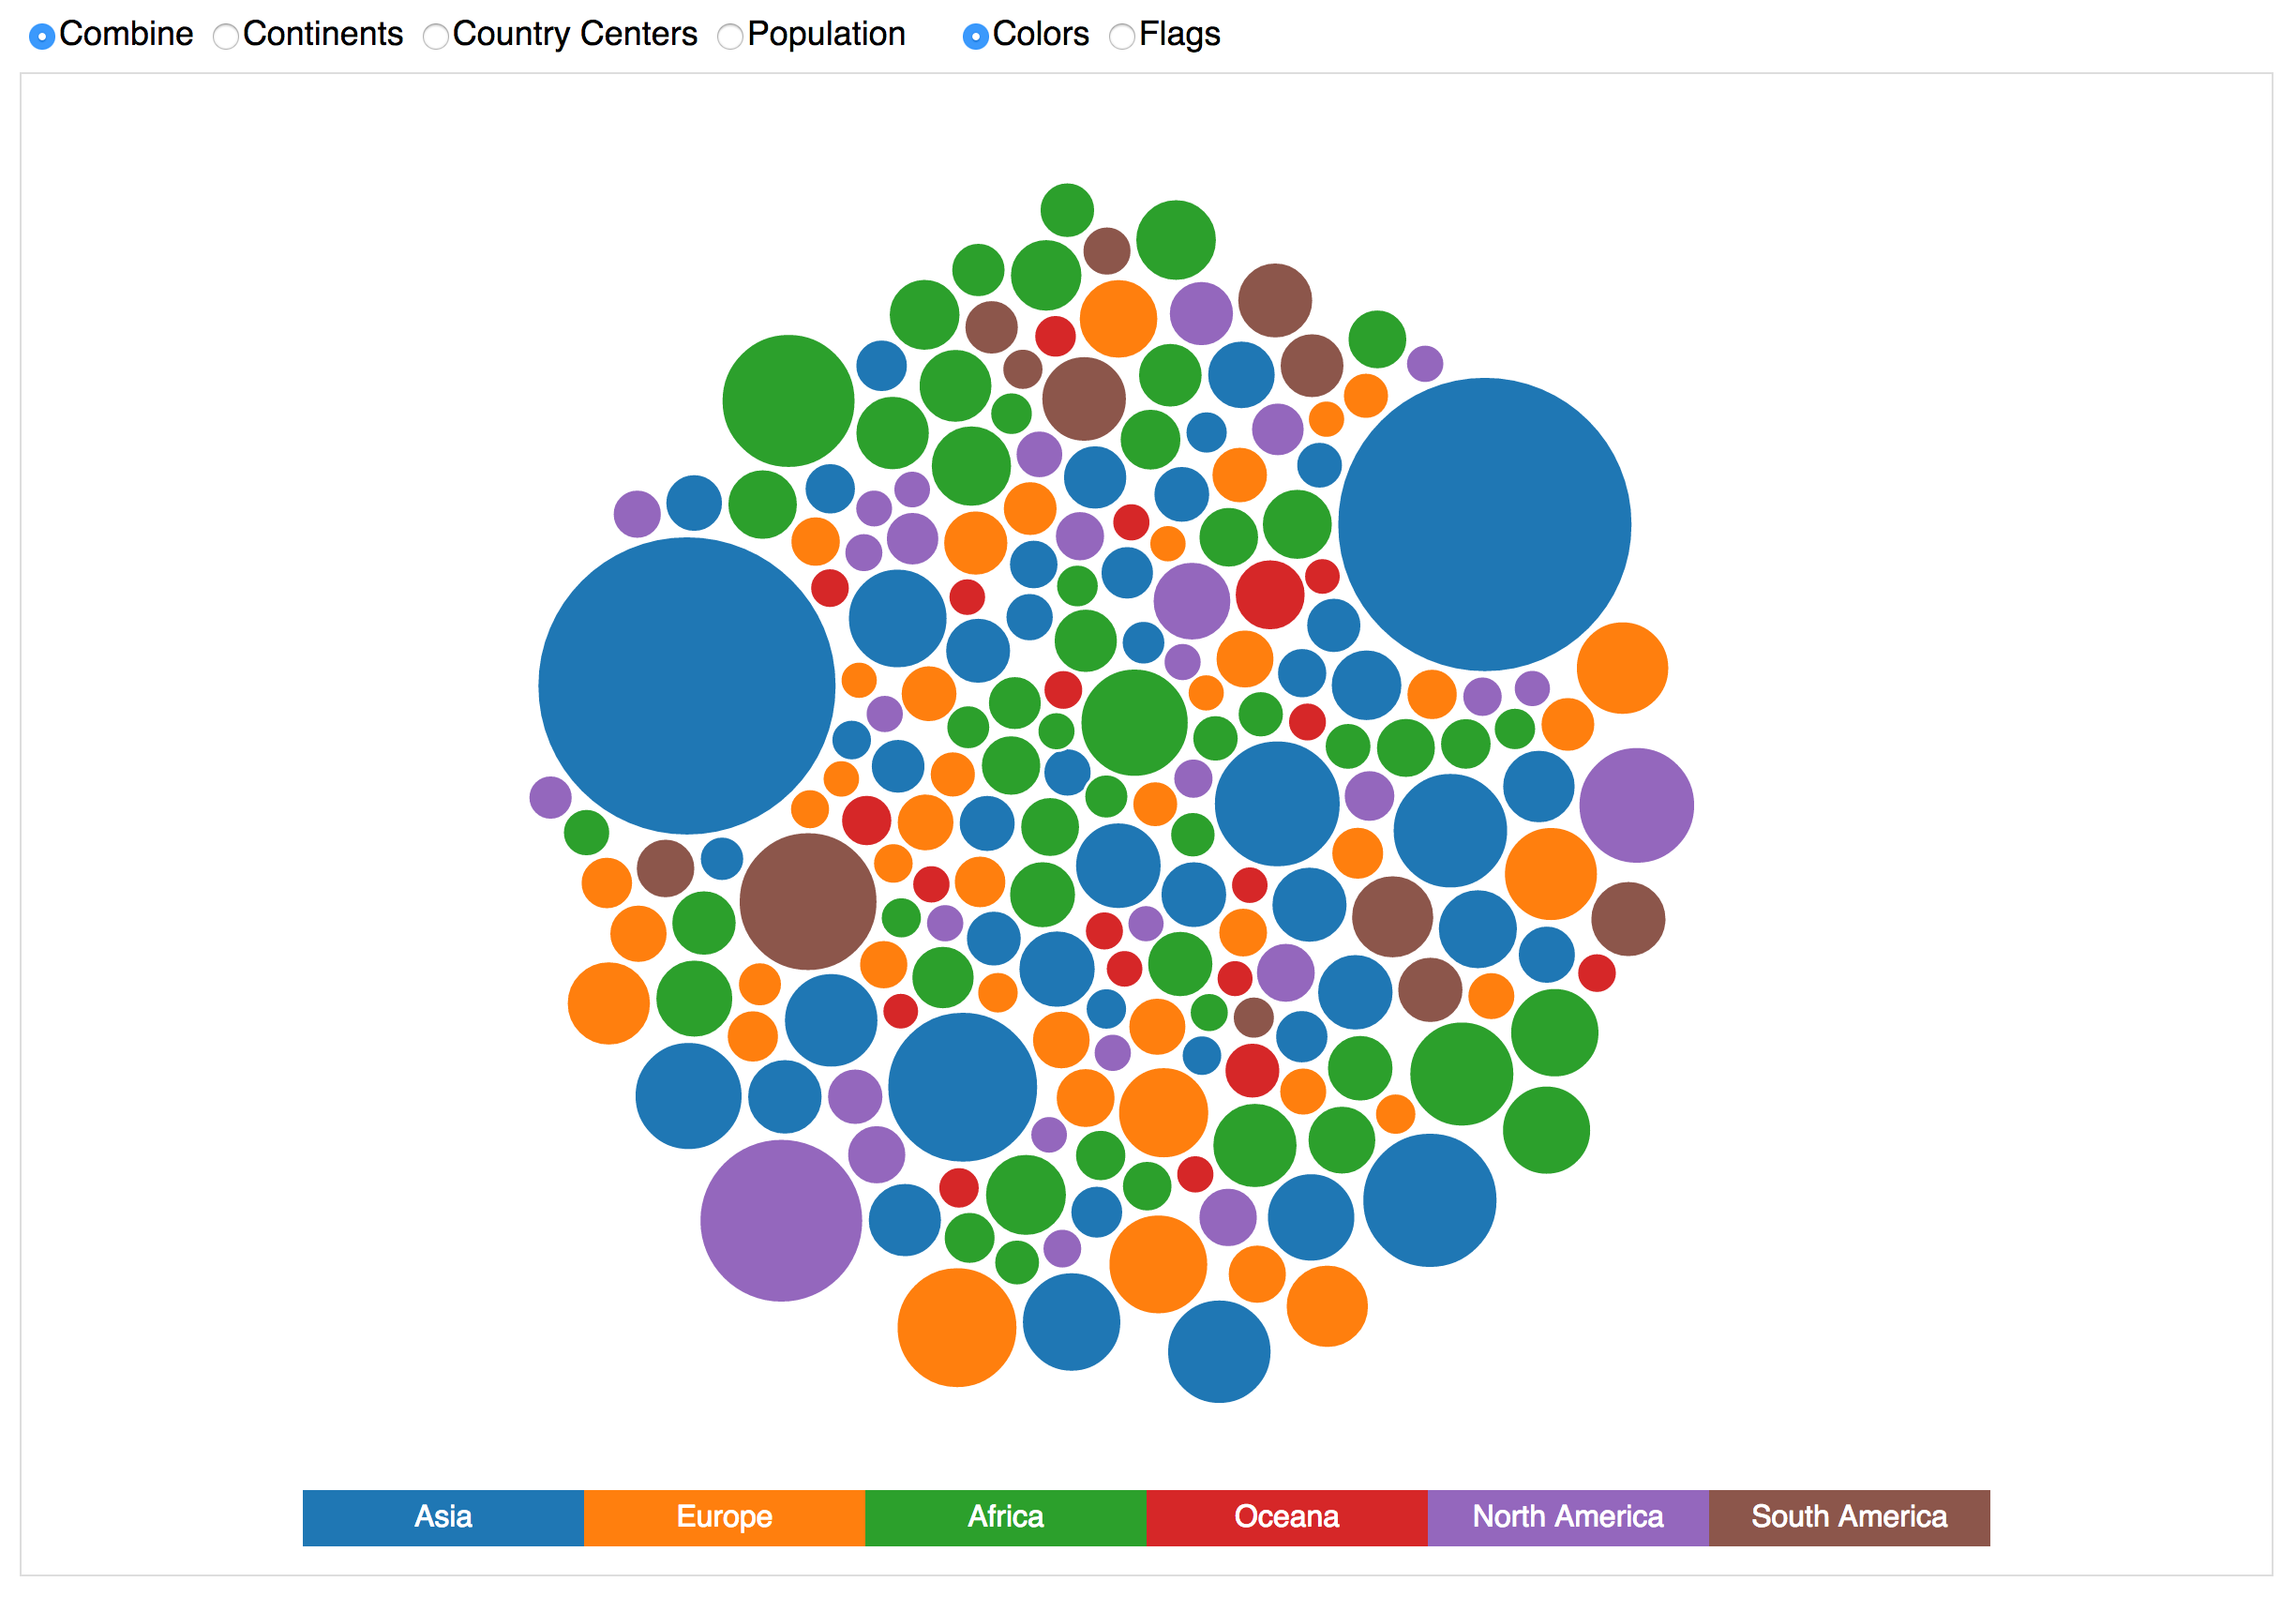
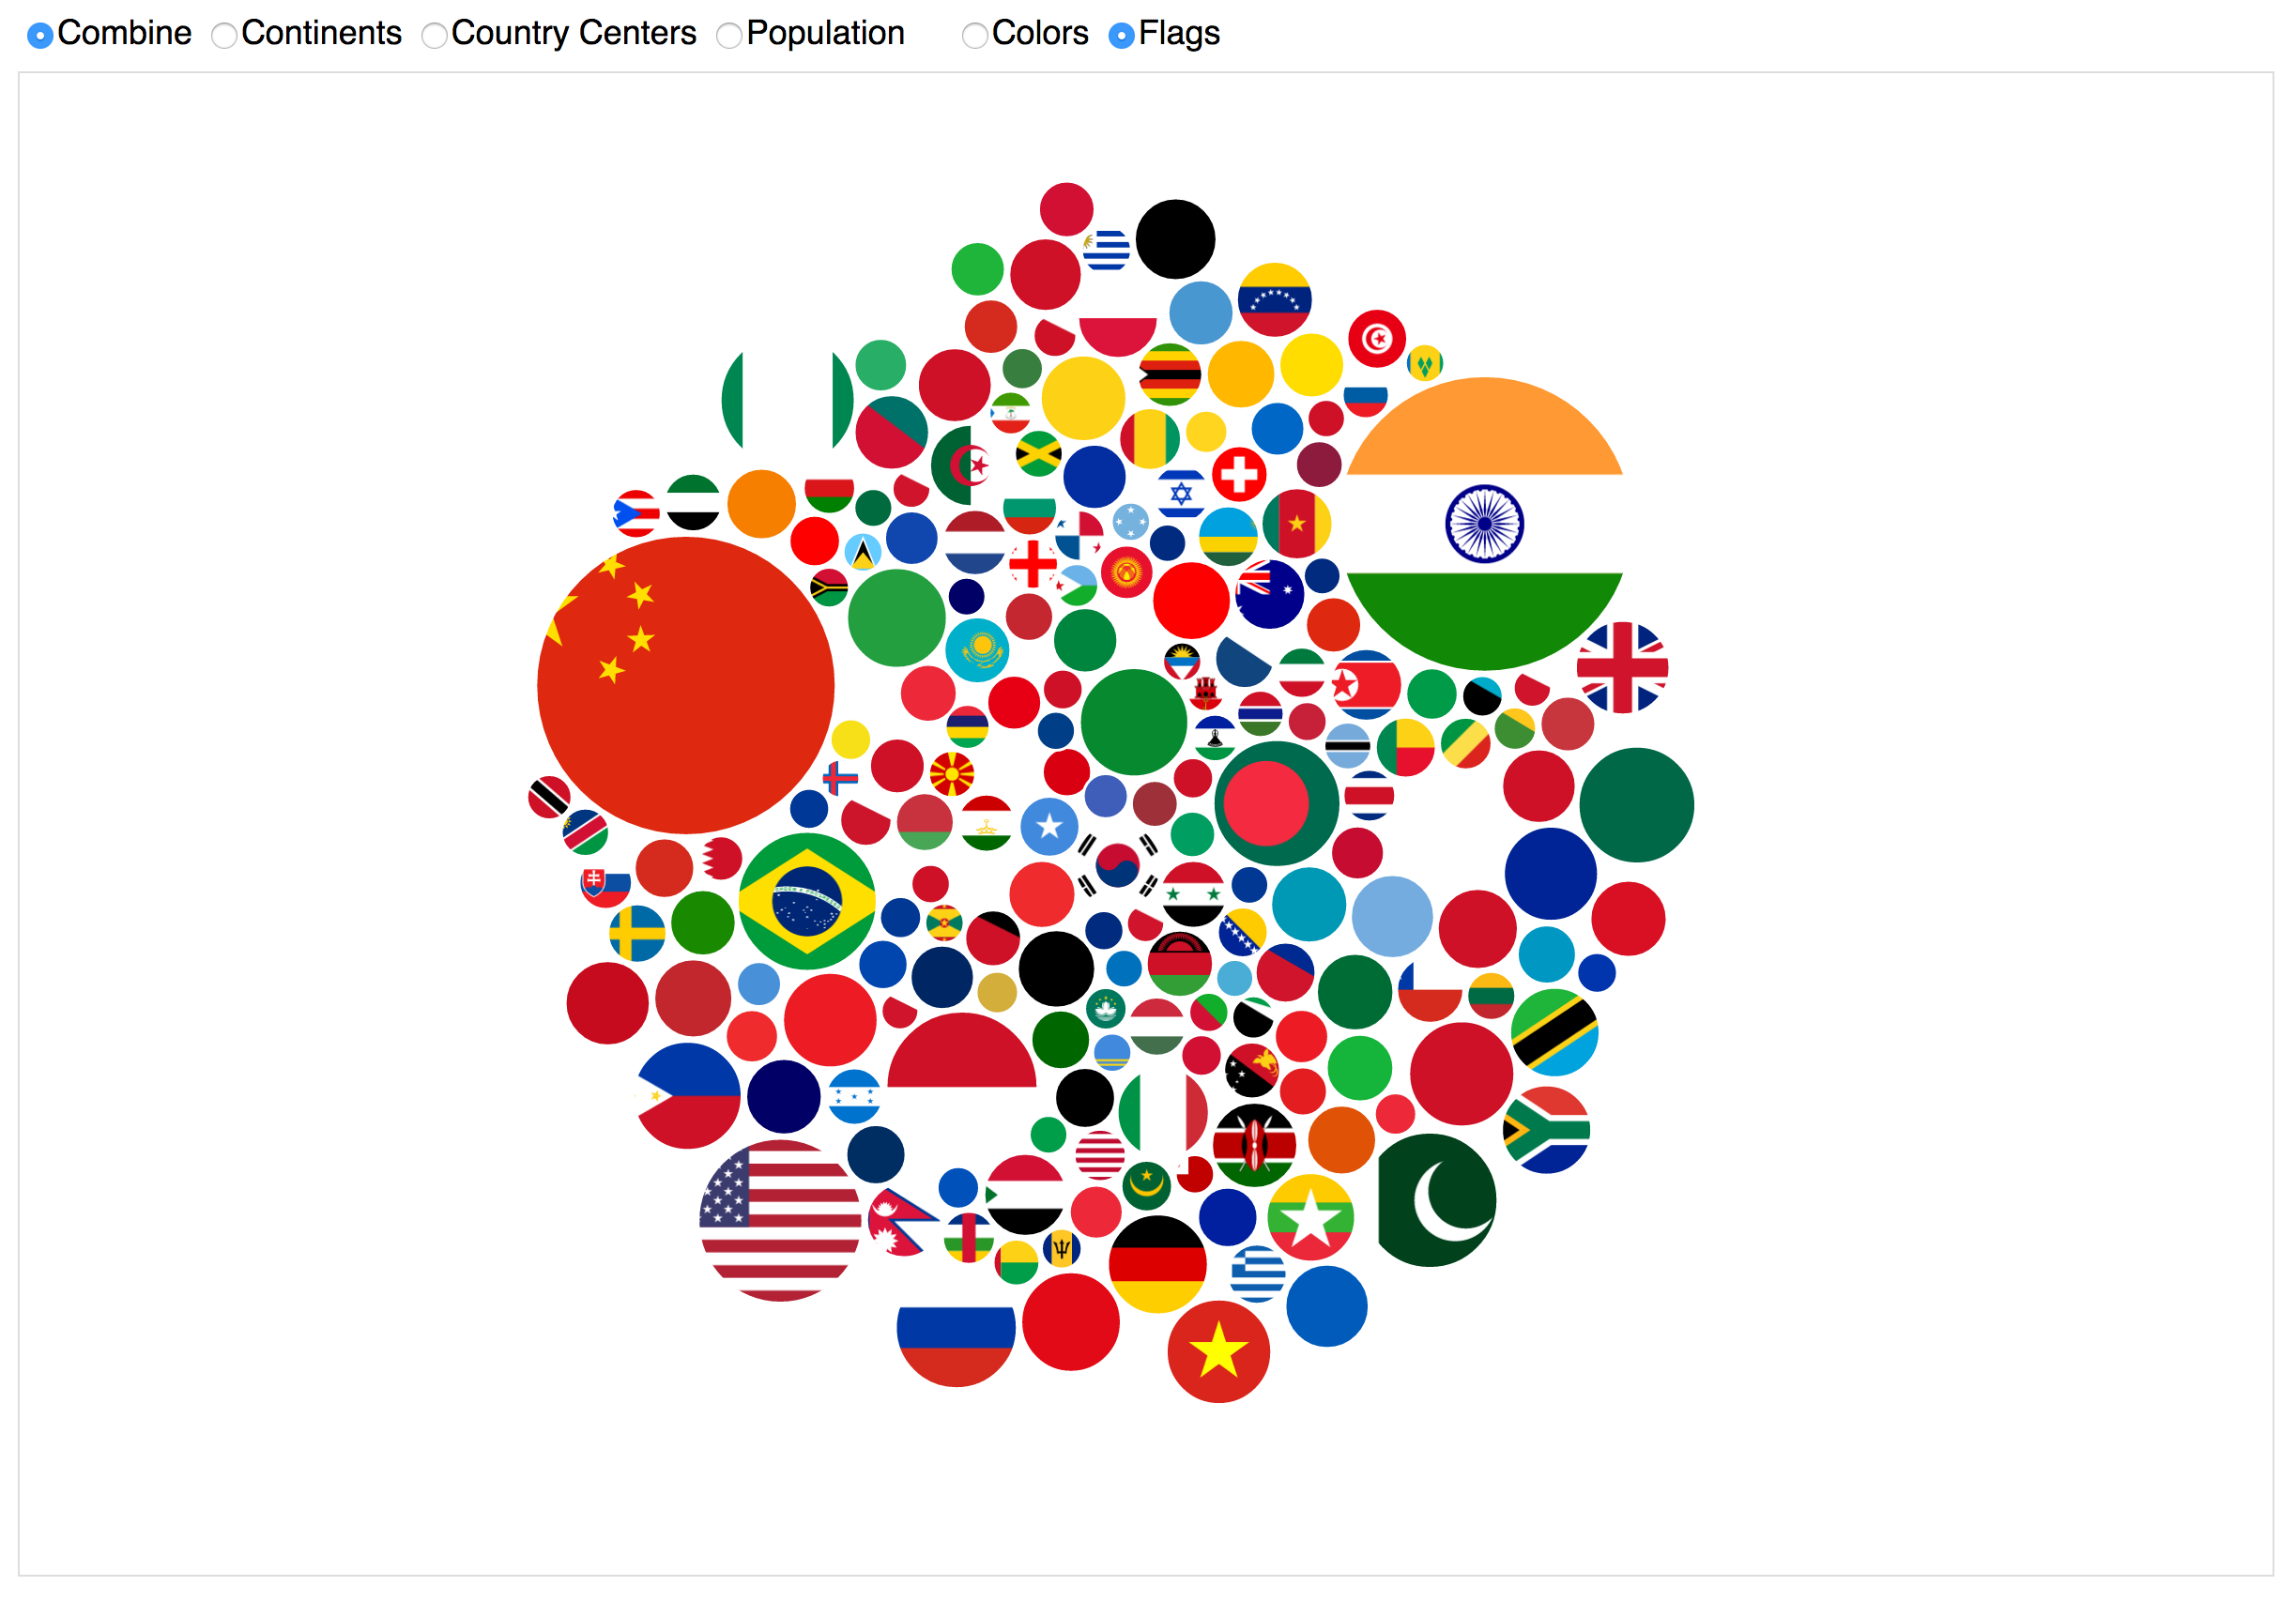
- Combine
- Pushes the circles into a single group at the center.
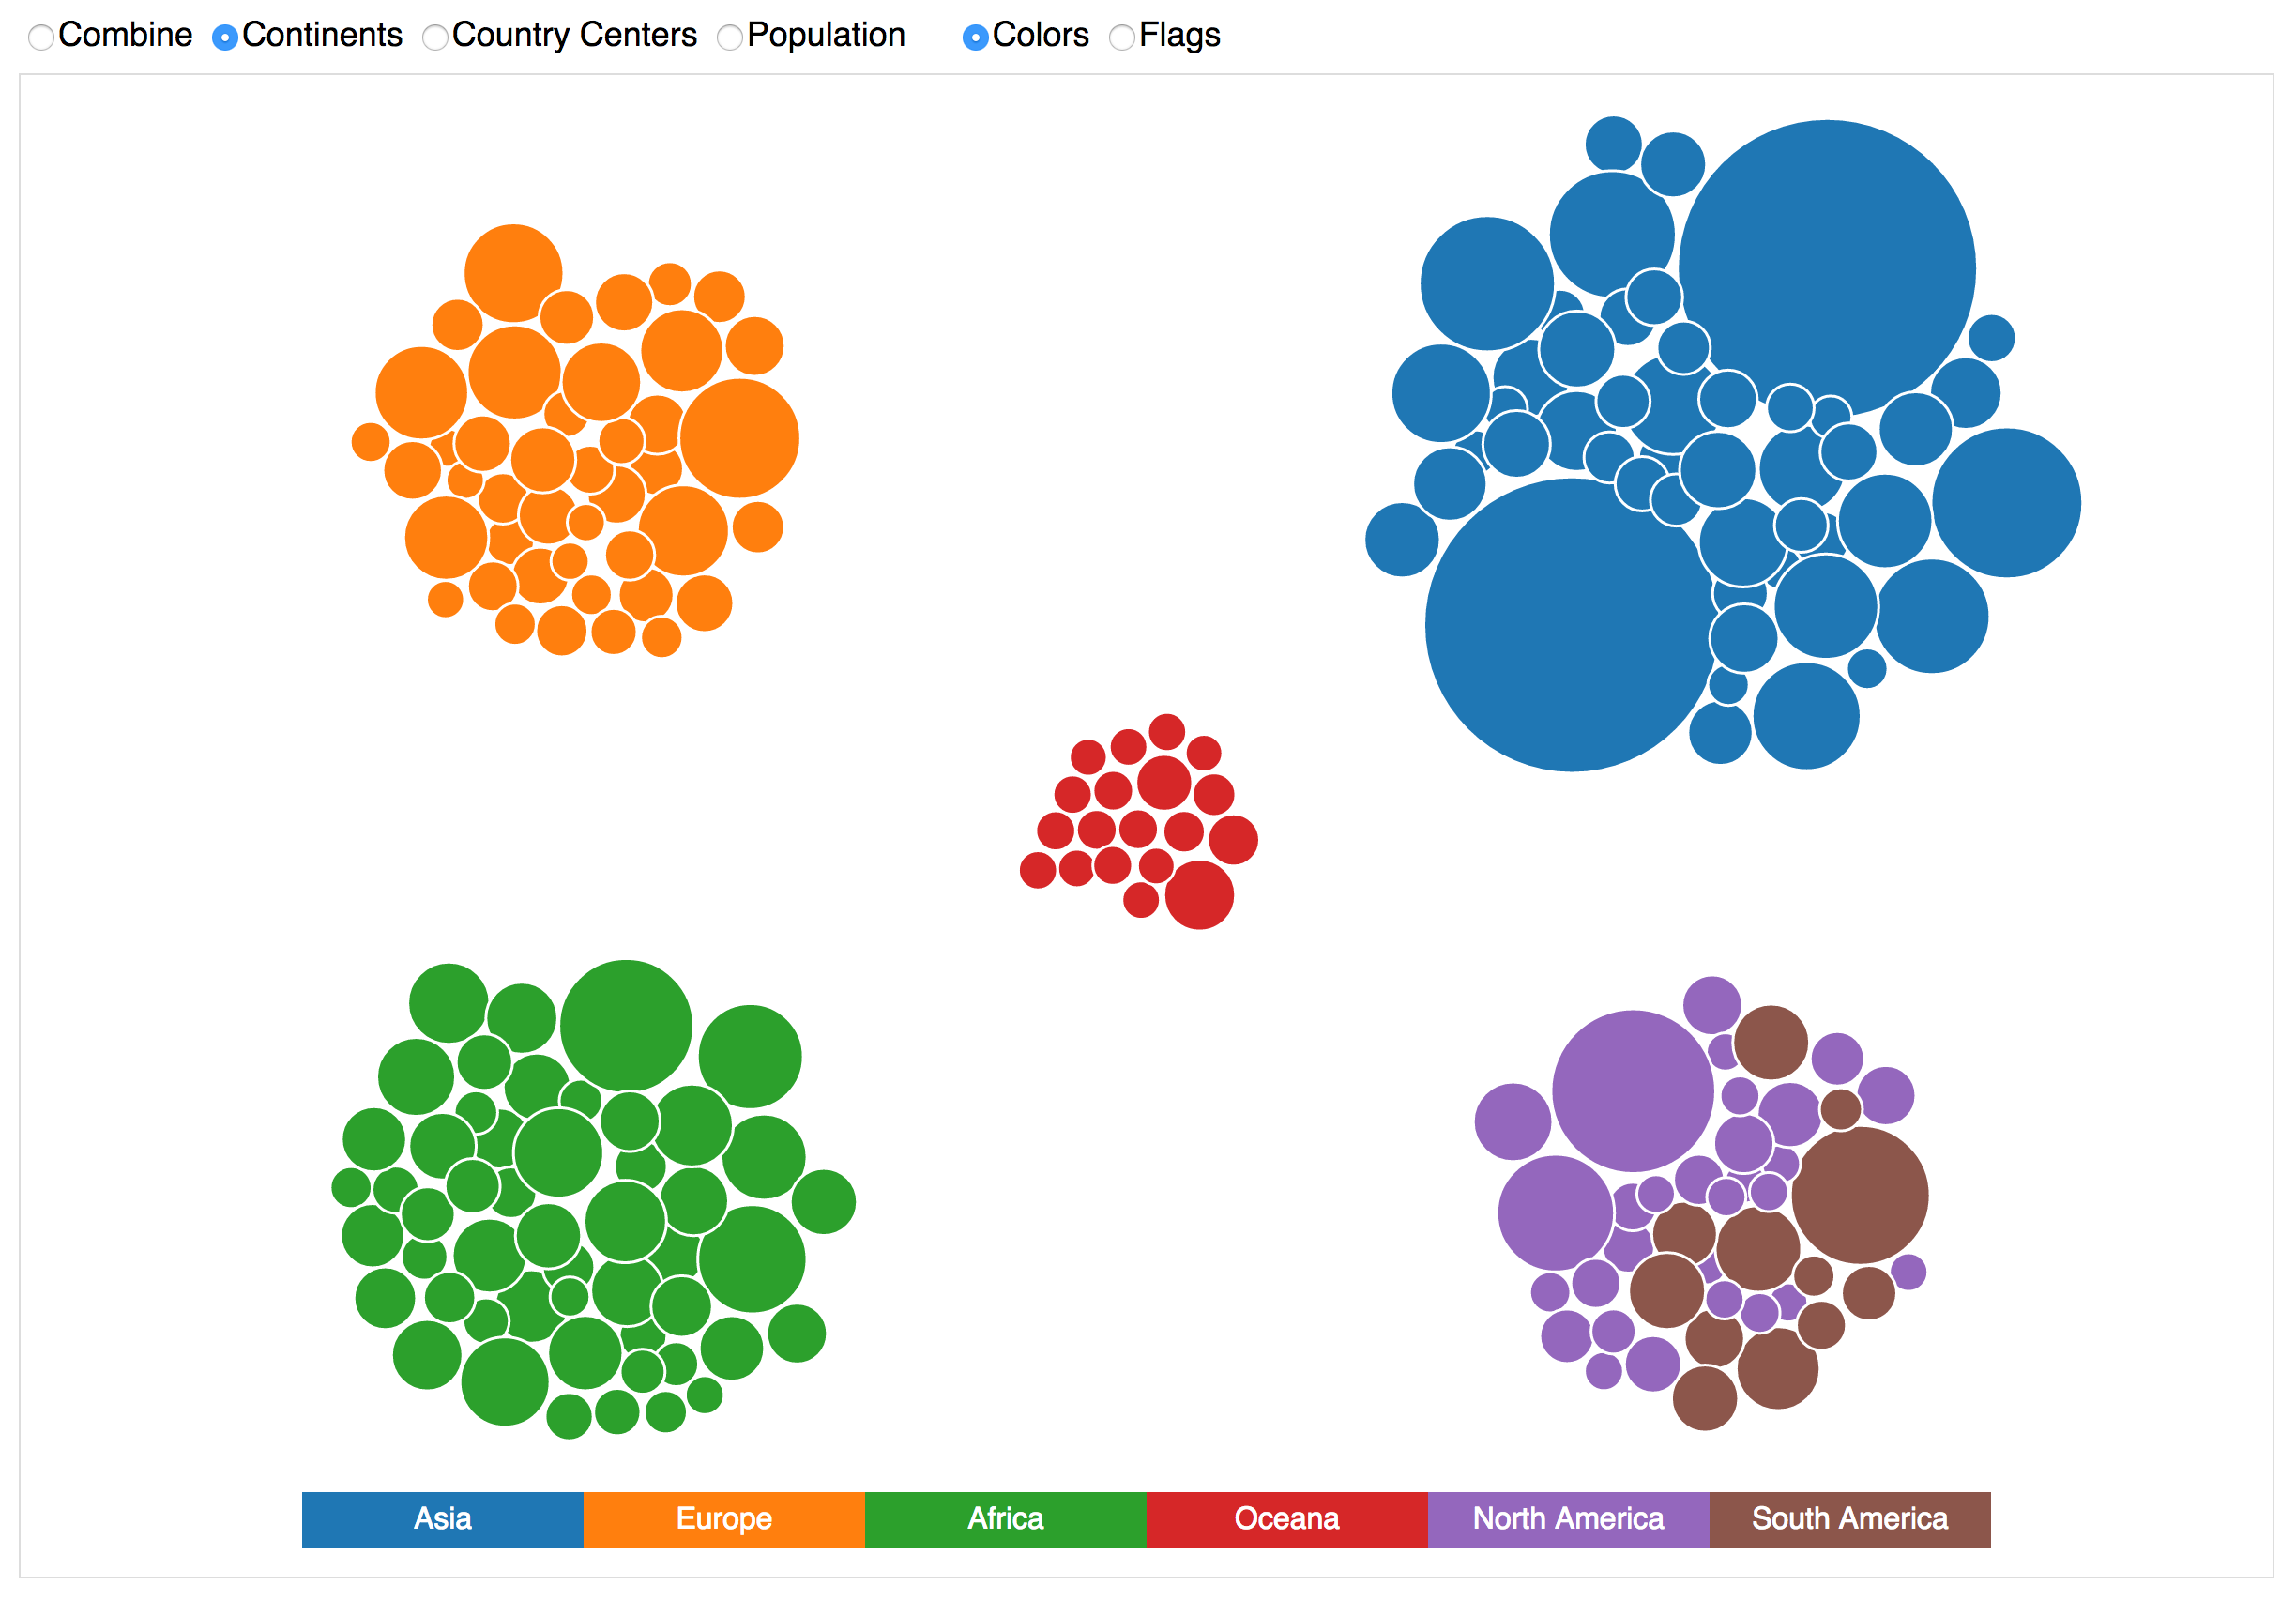
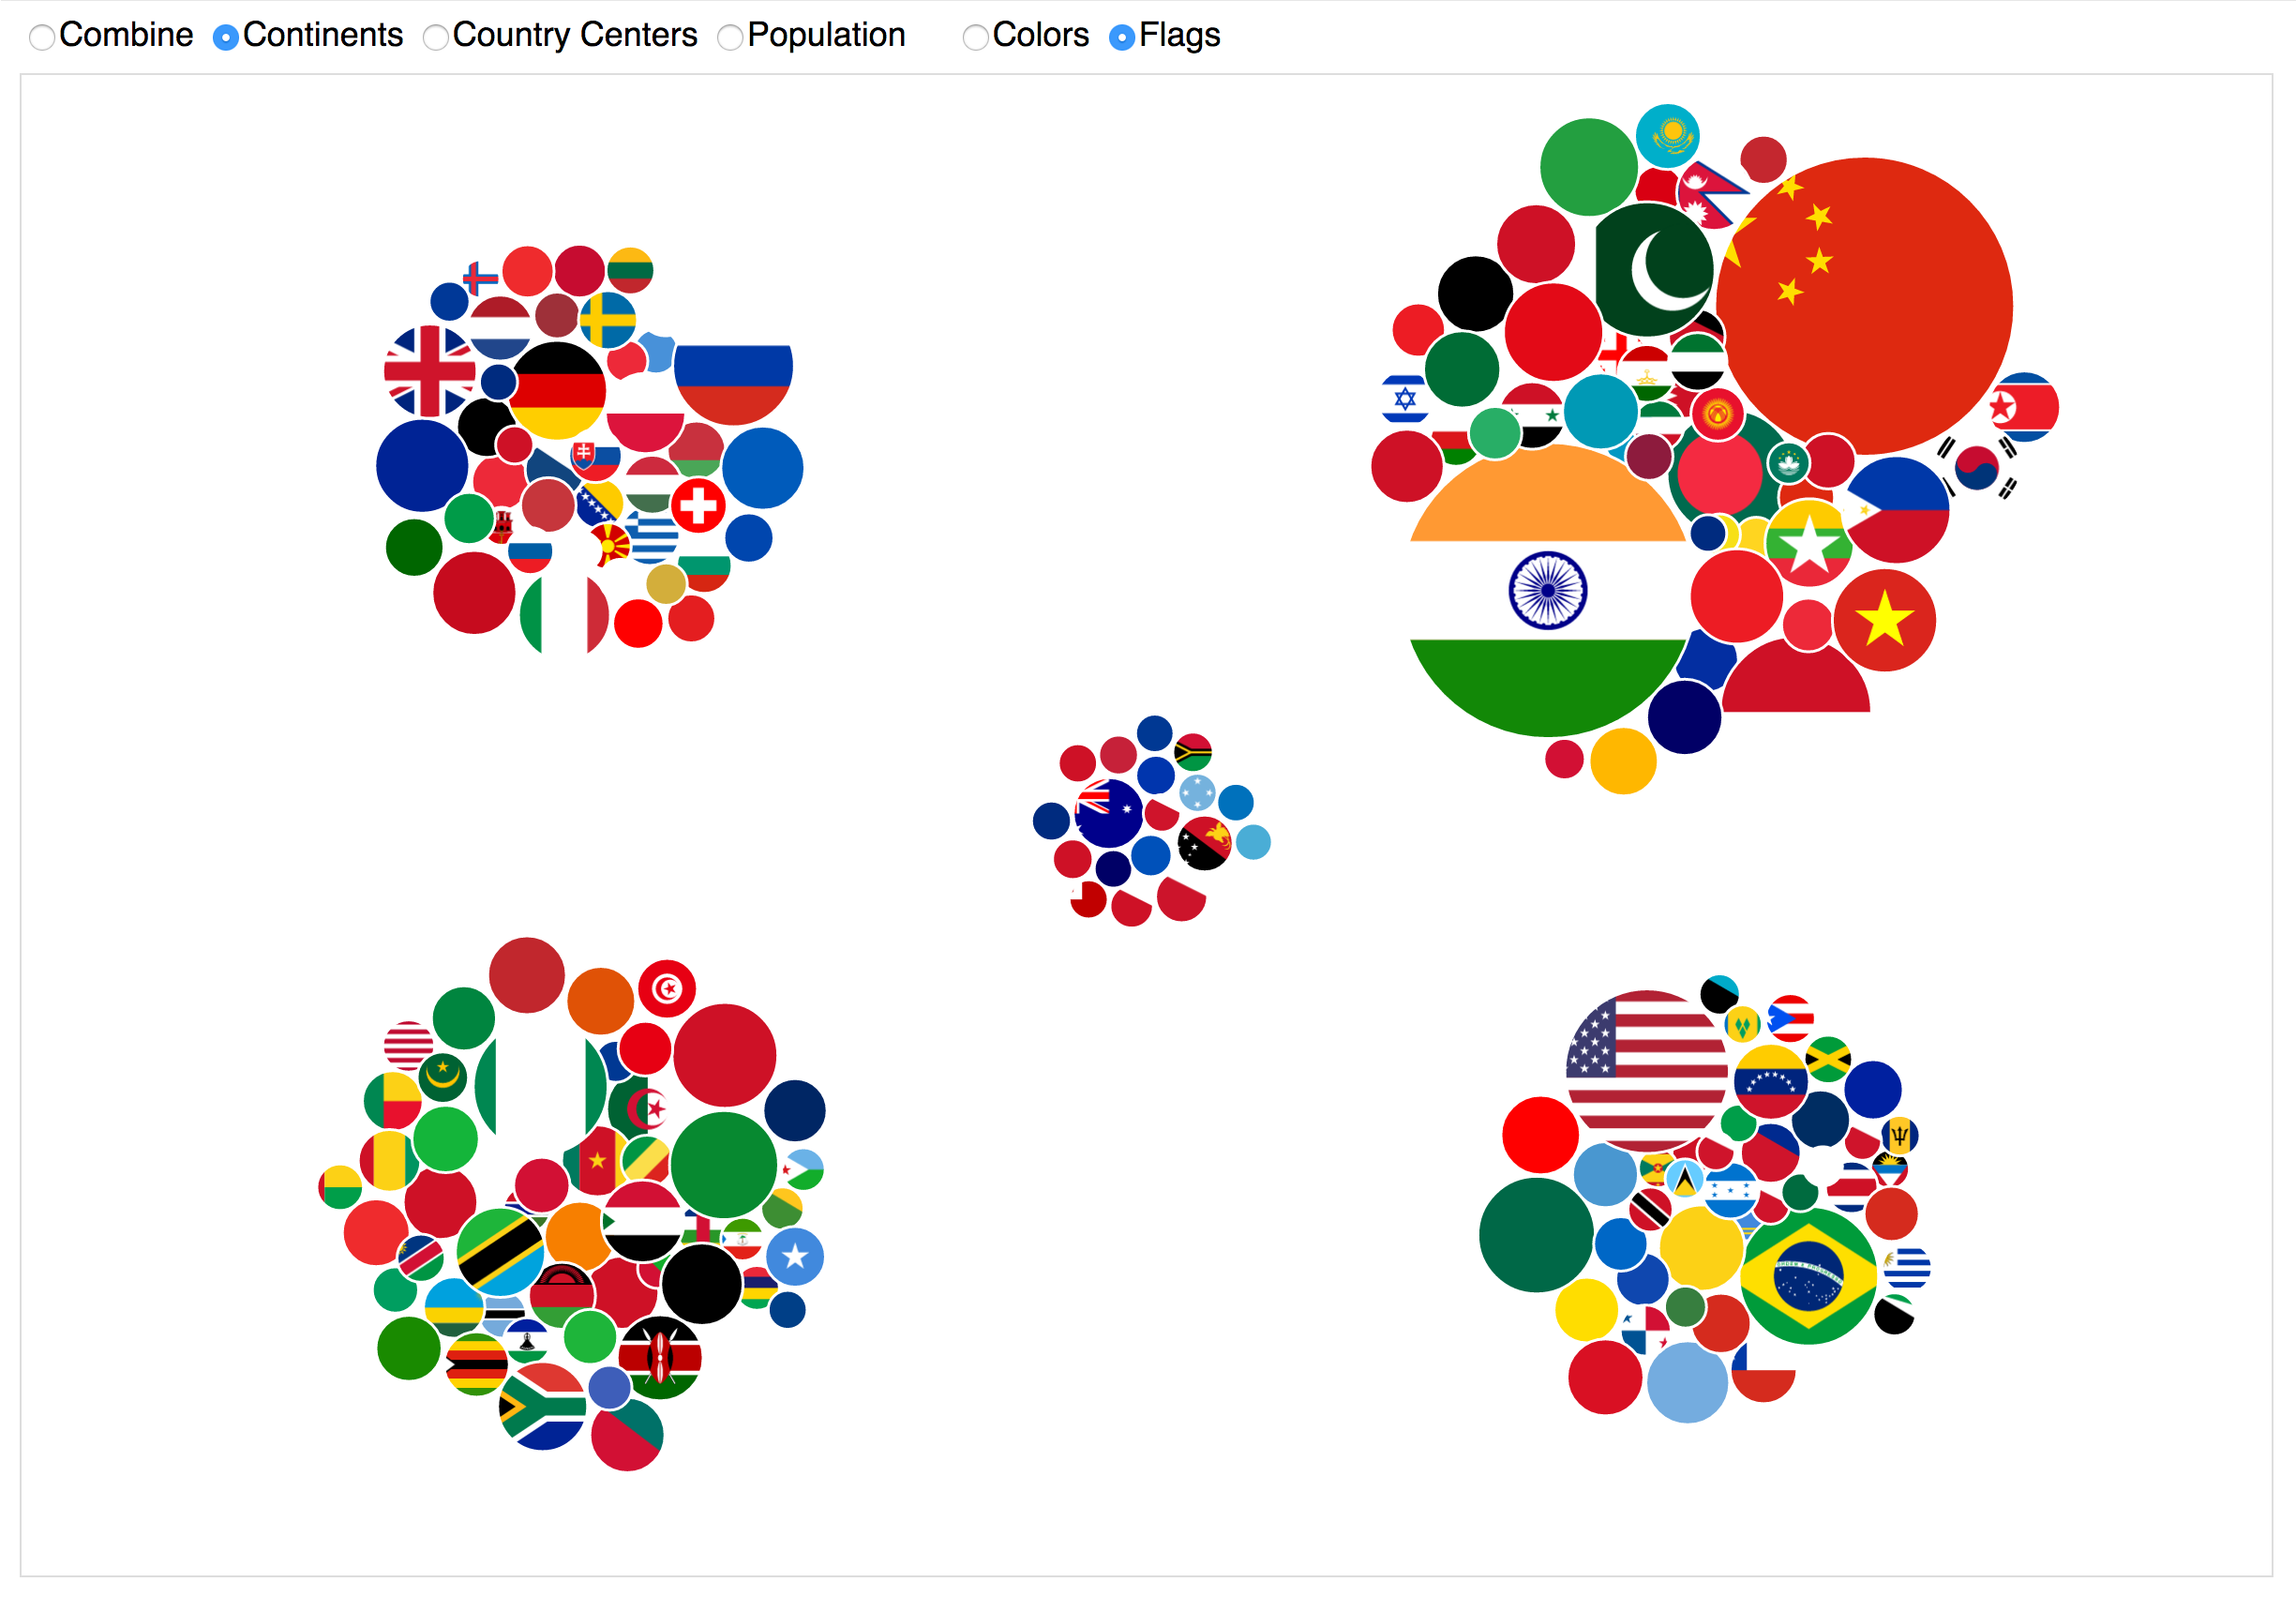
- Continents
- Groups the circles by continent and pushes the groups towards the four corners and the center.
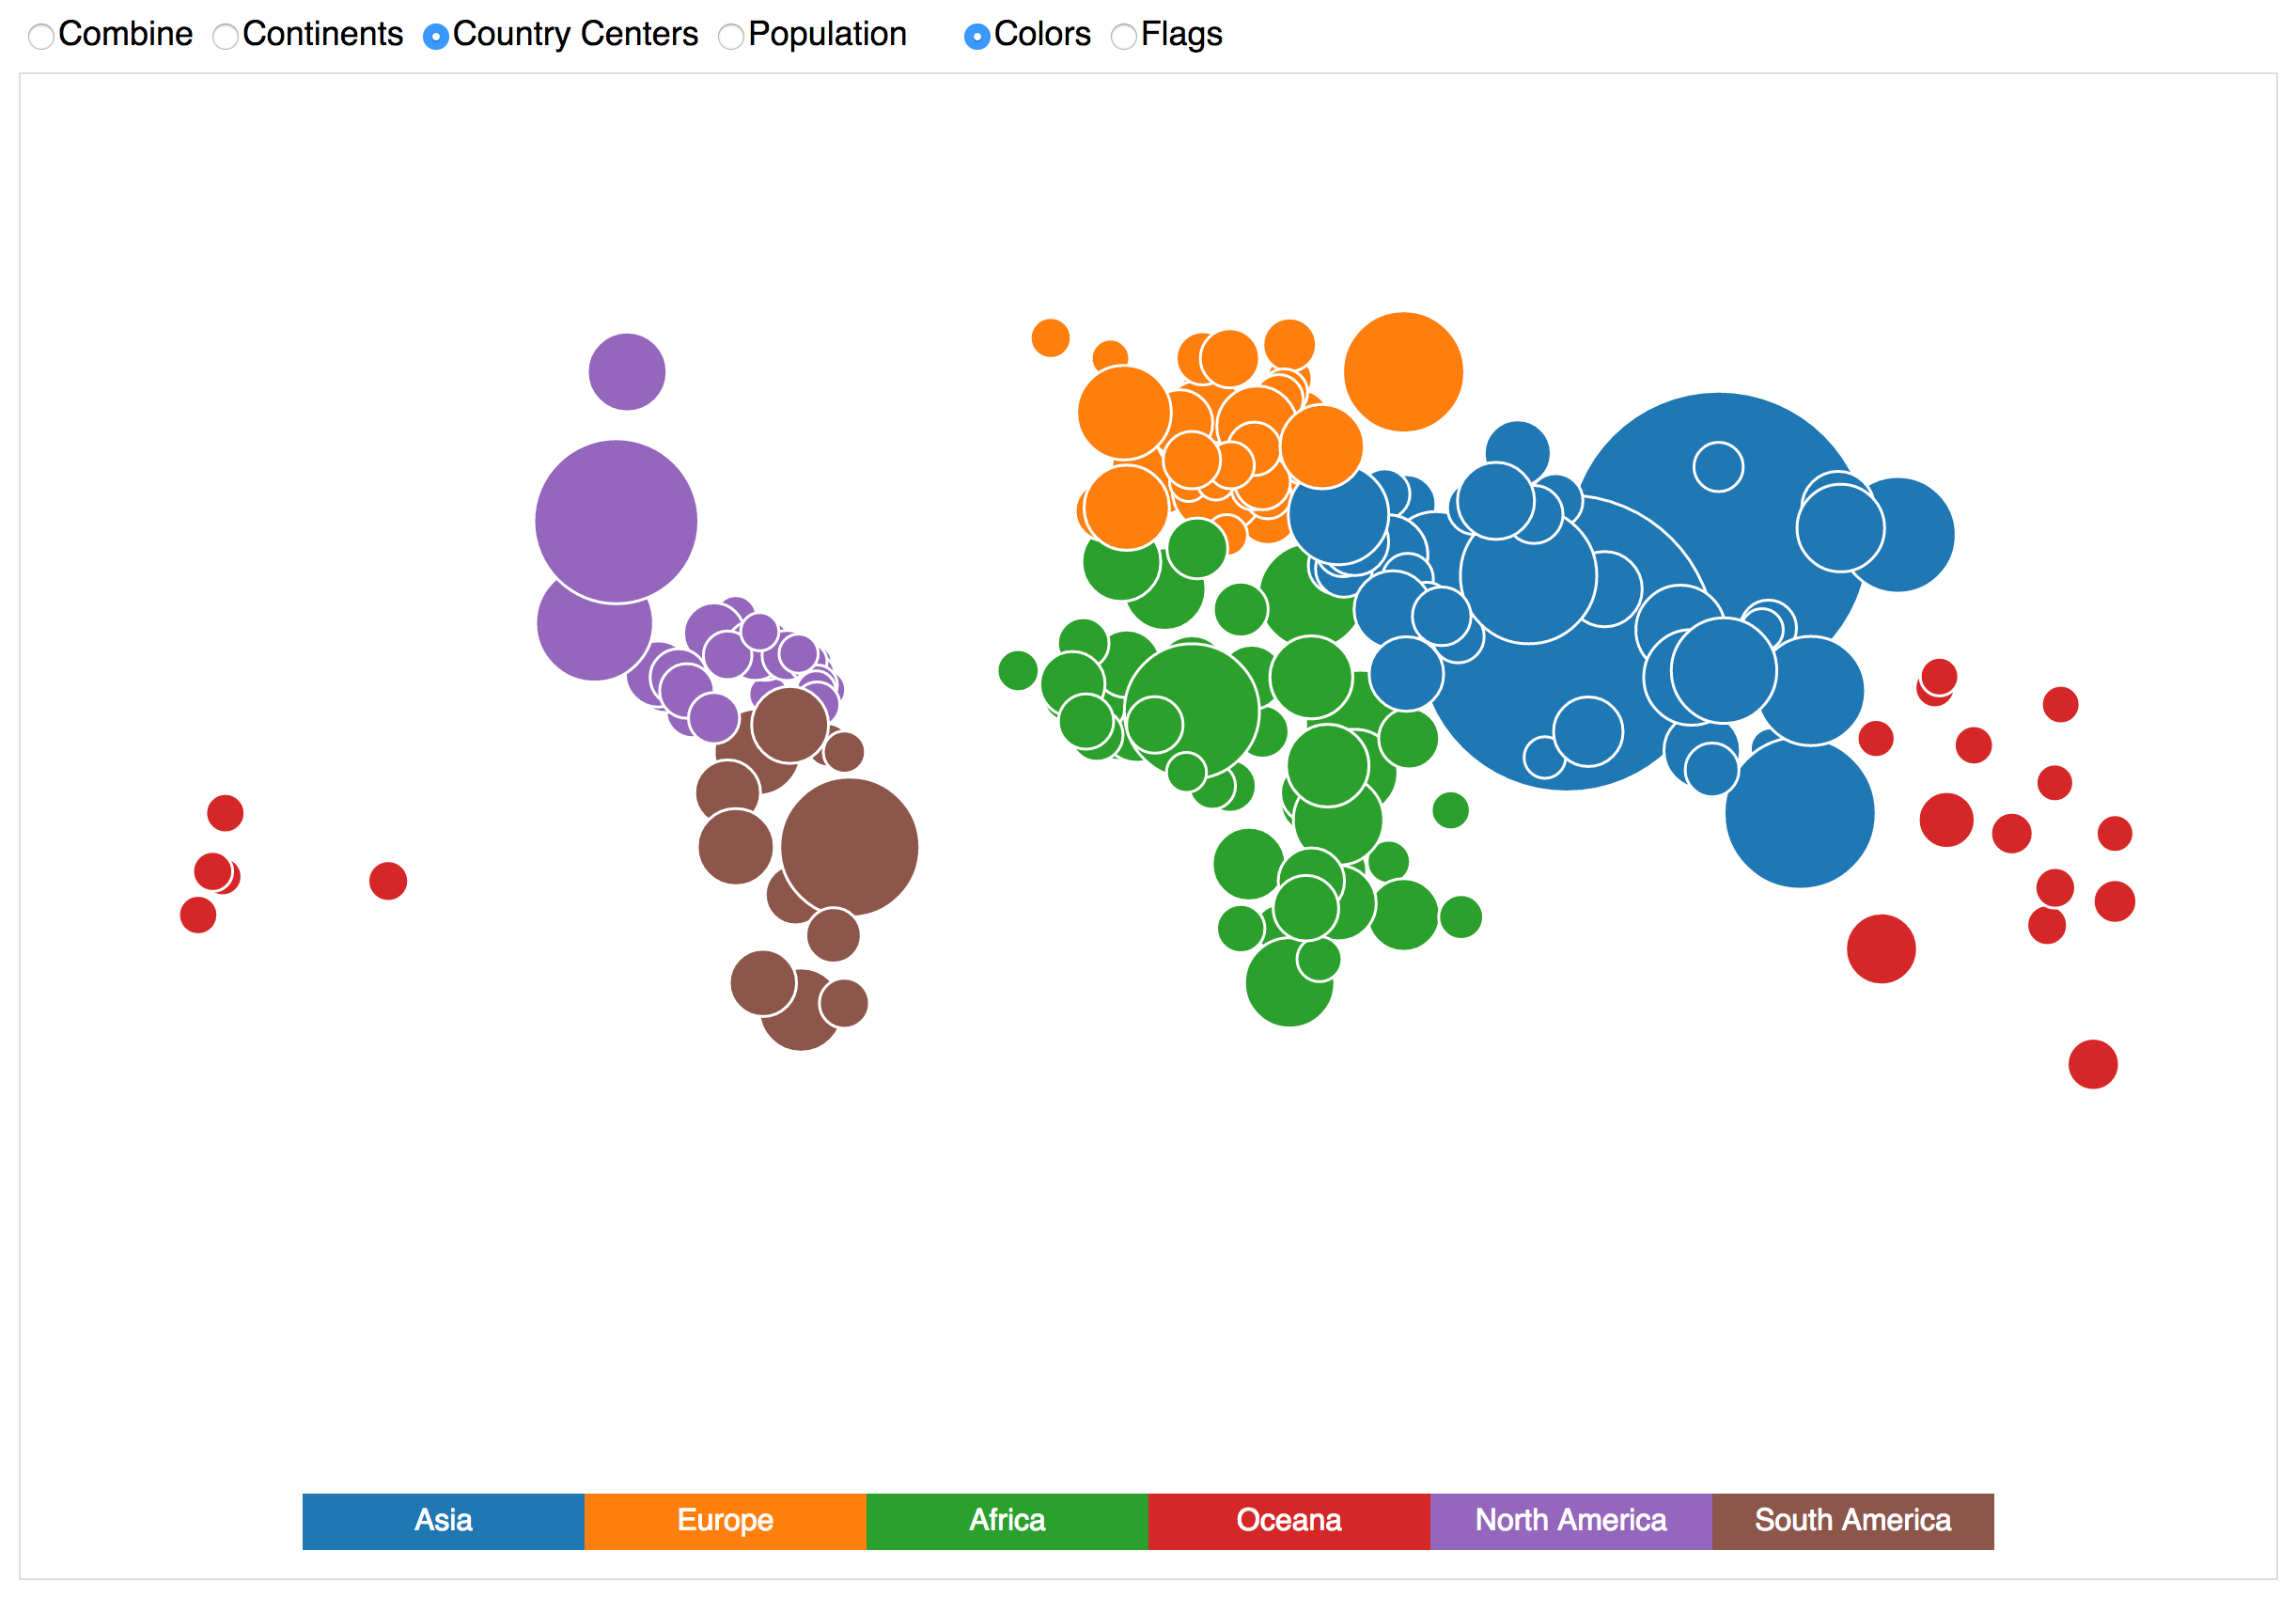
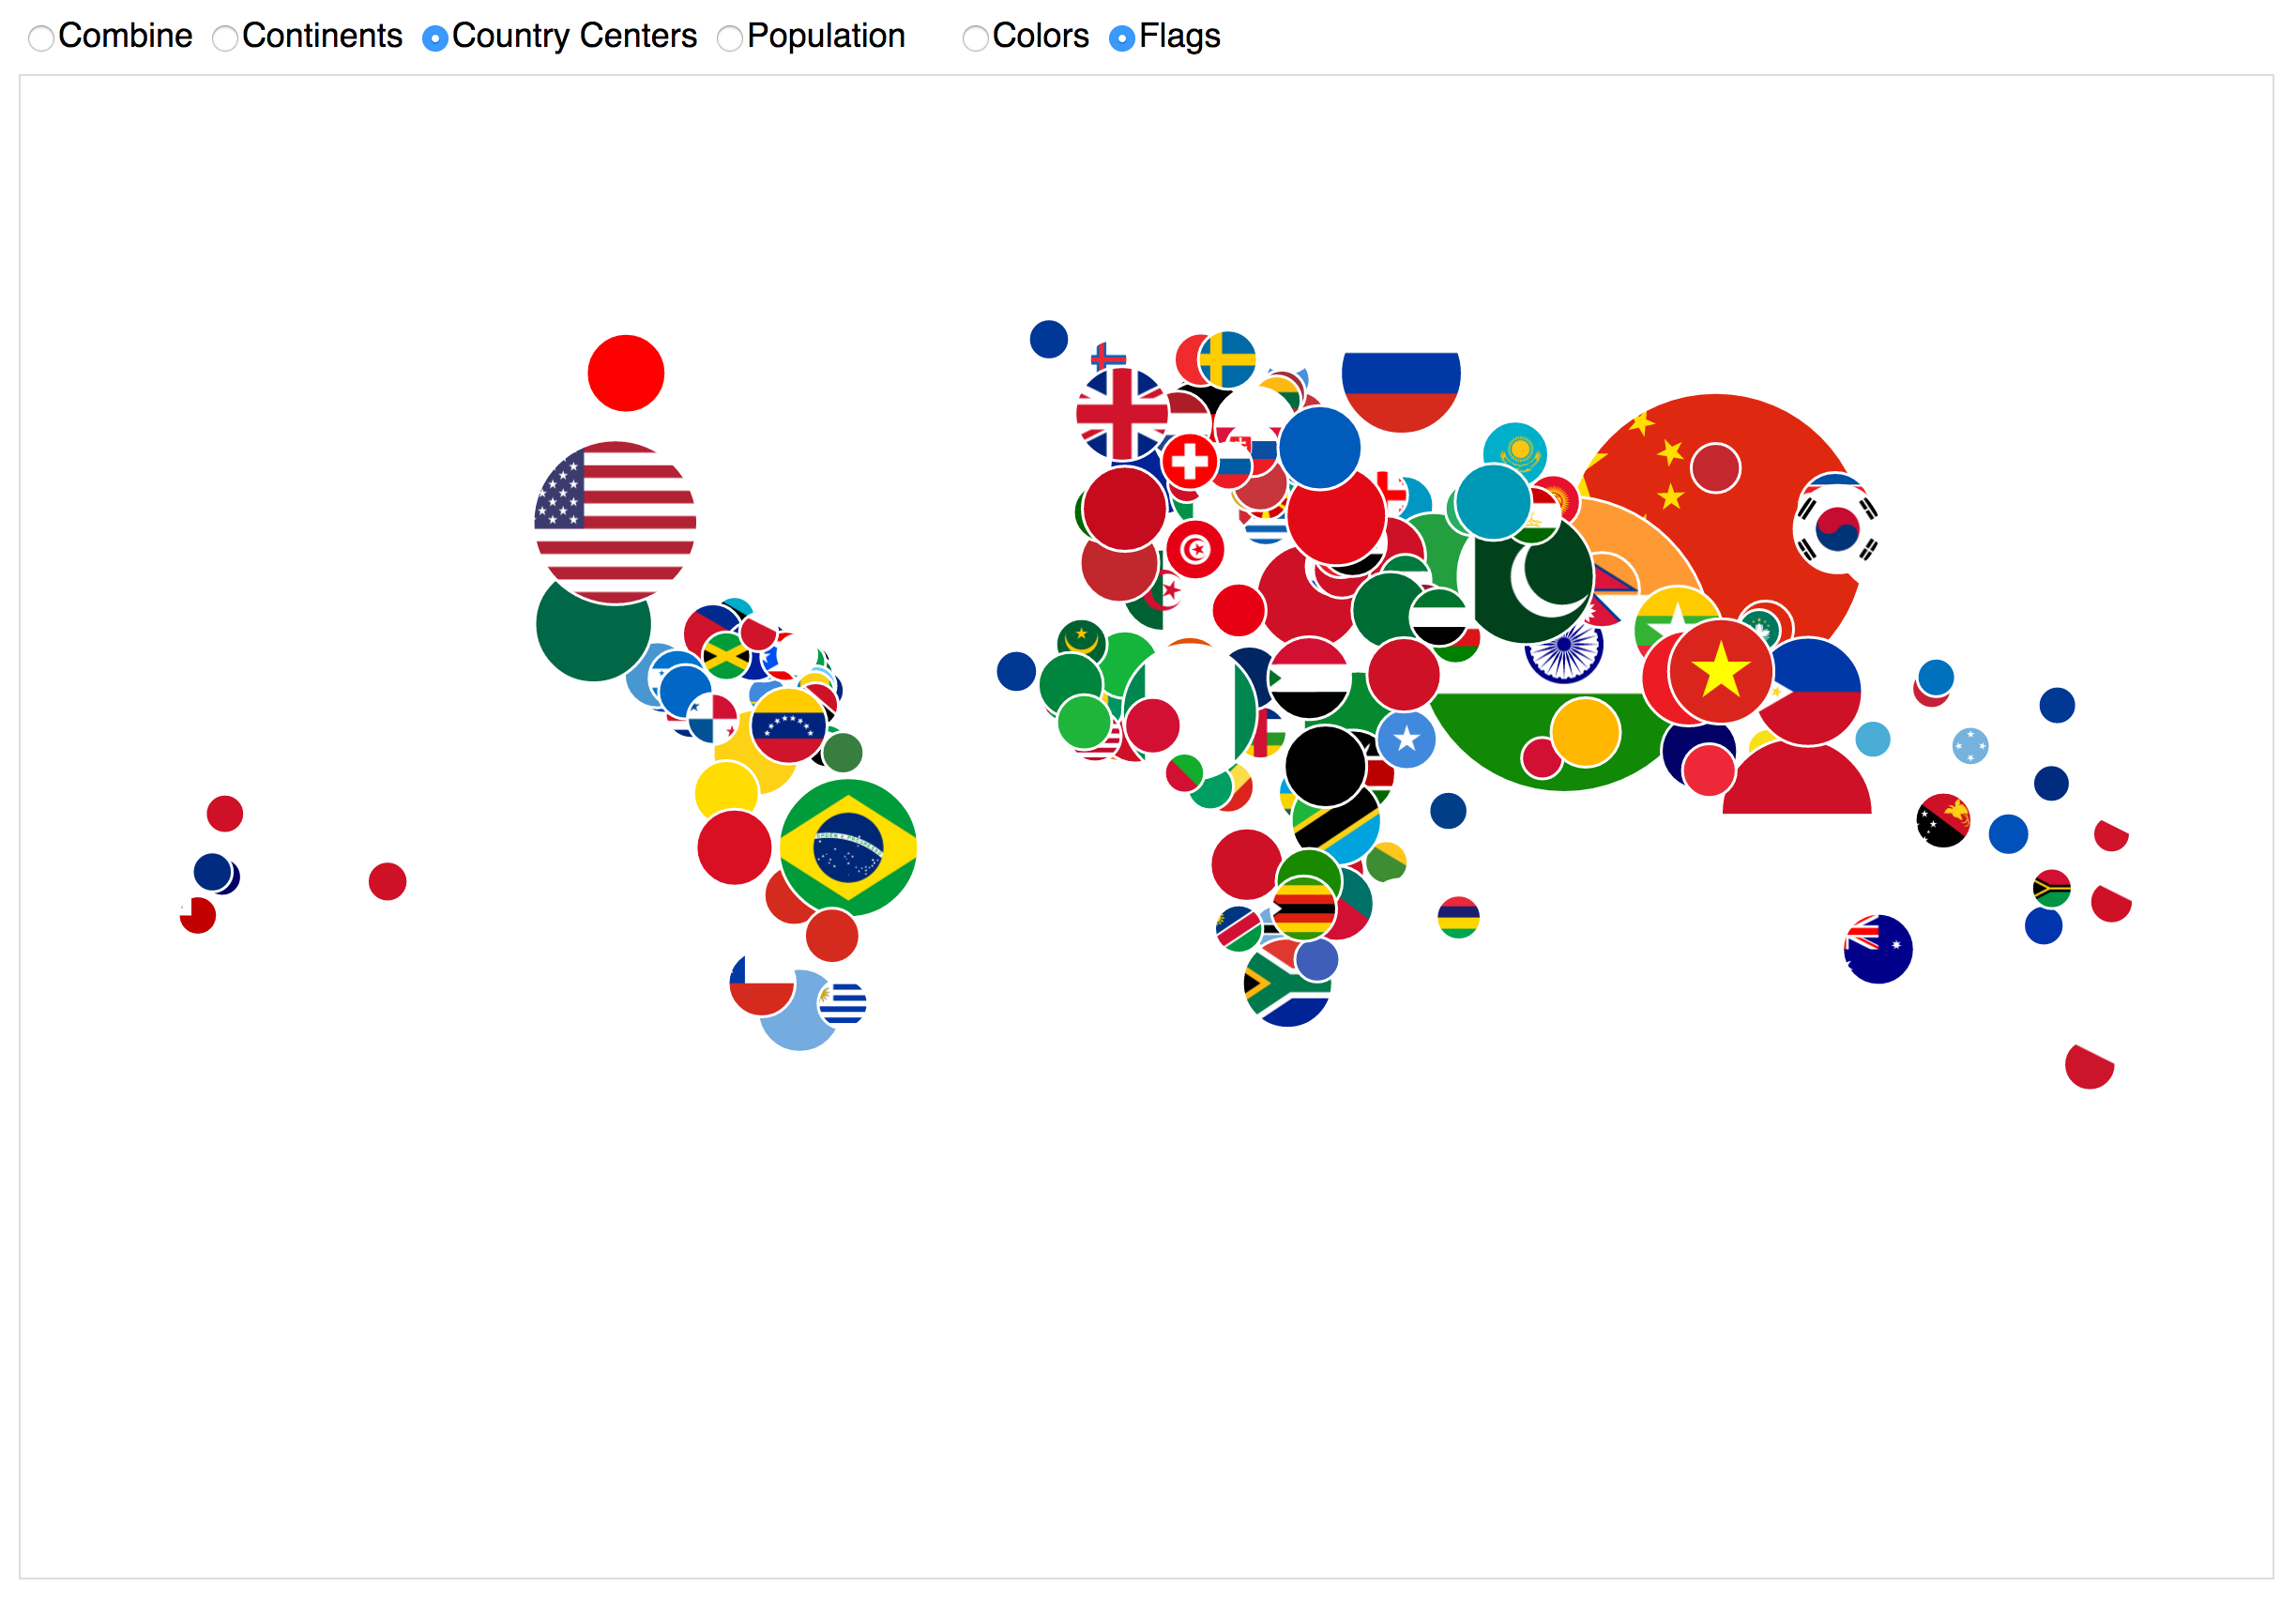
- Country Centers
- Uses the Equirectangular projection to push the center of the circles towards the center of the countries they represent.
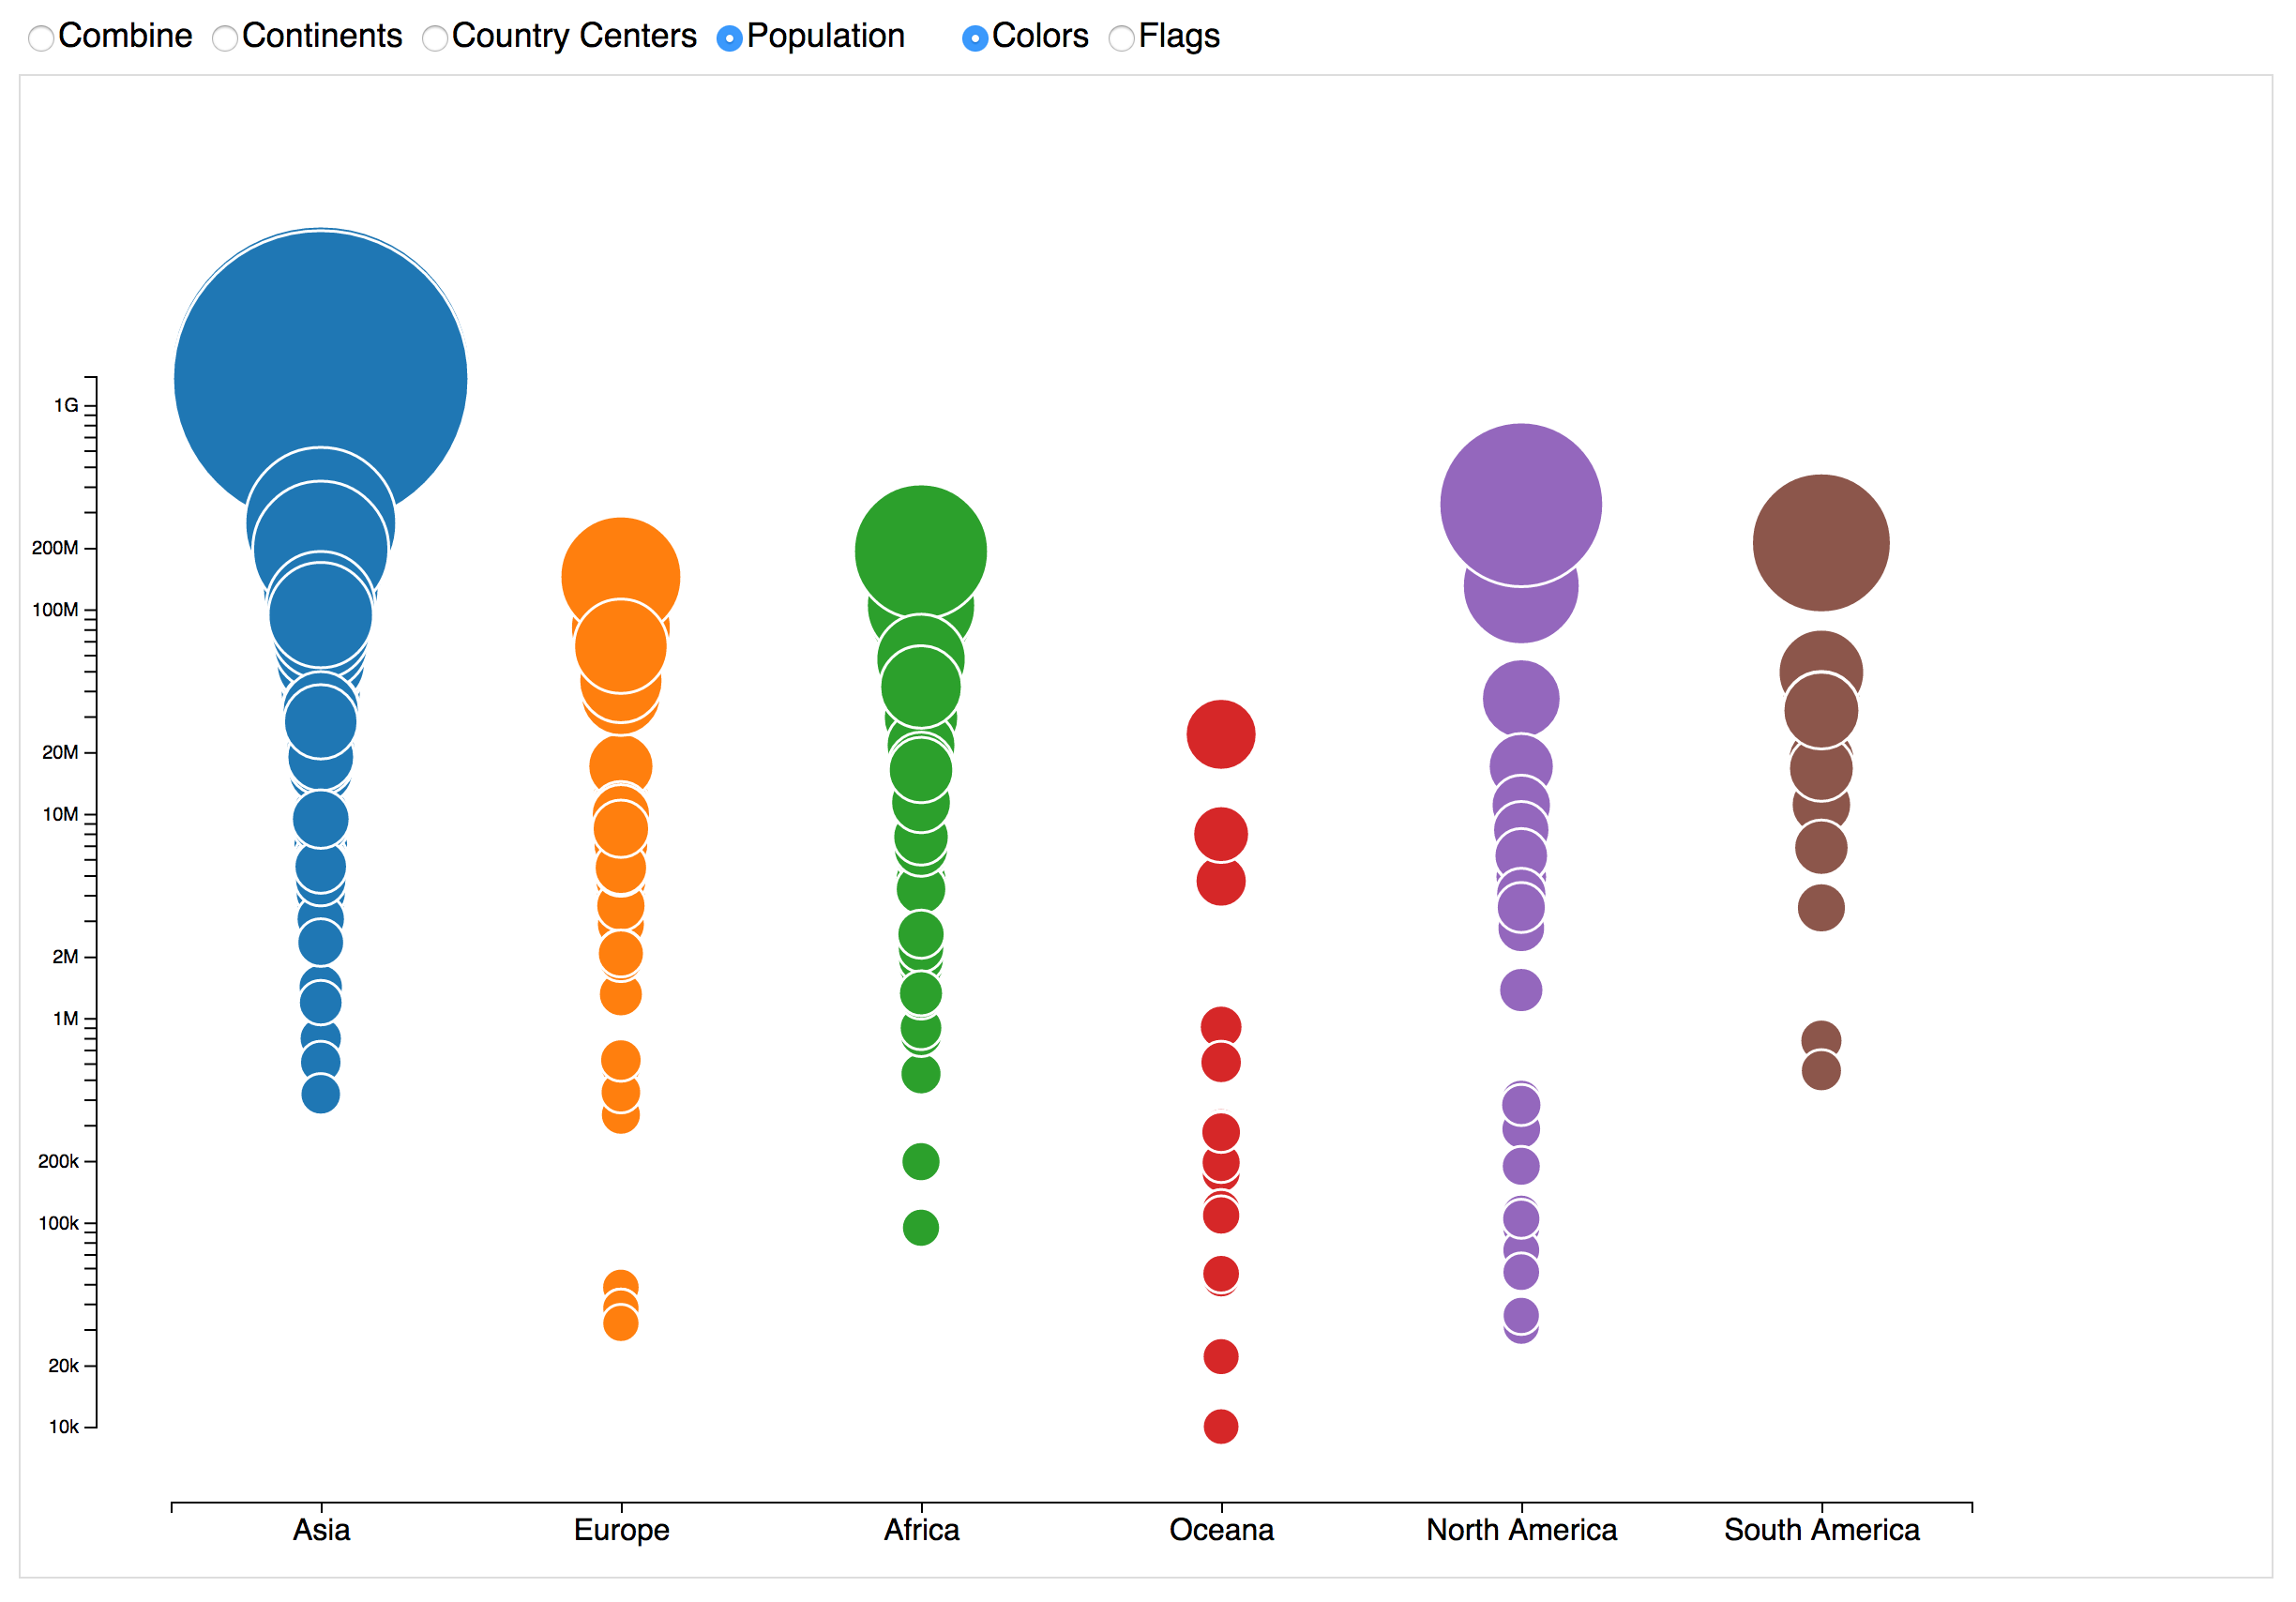
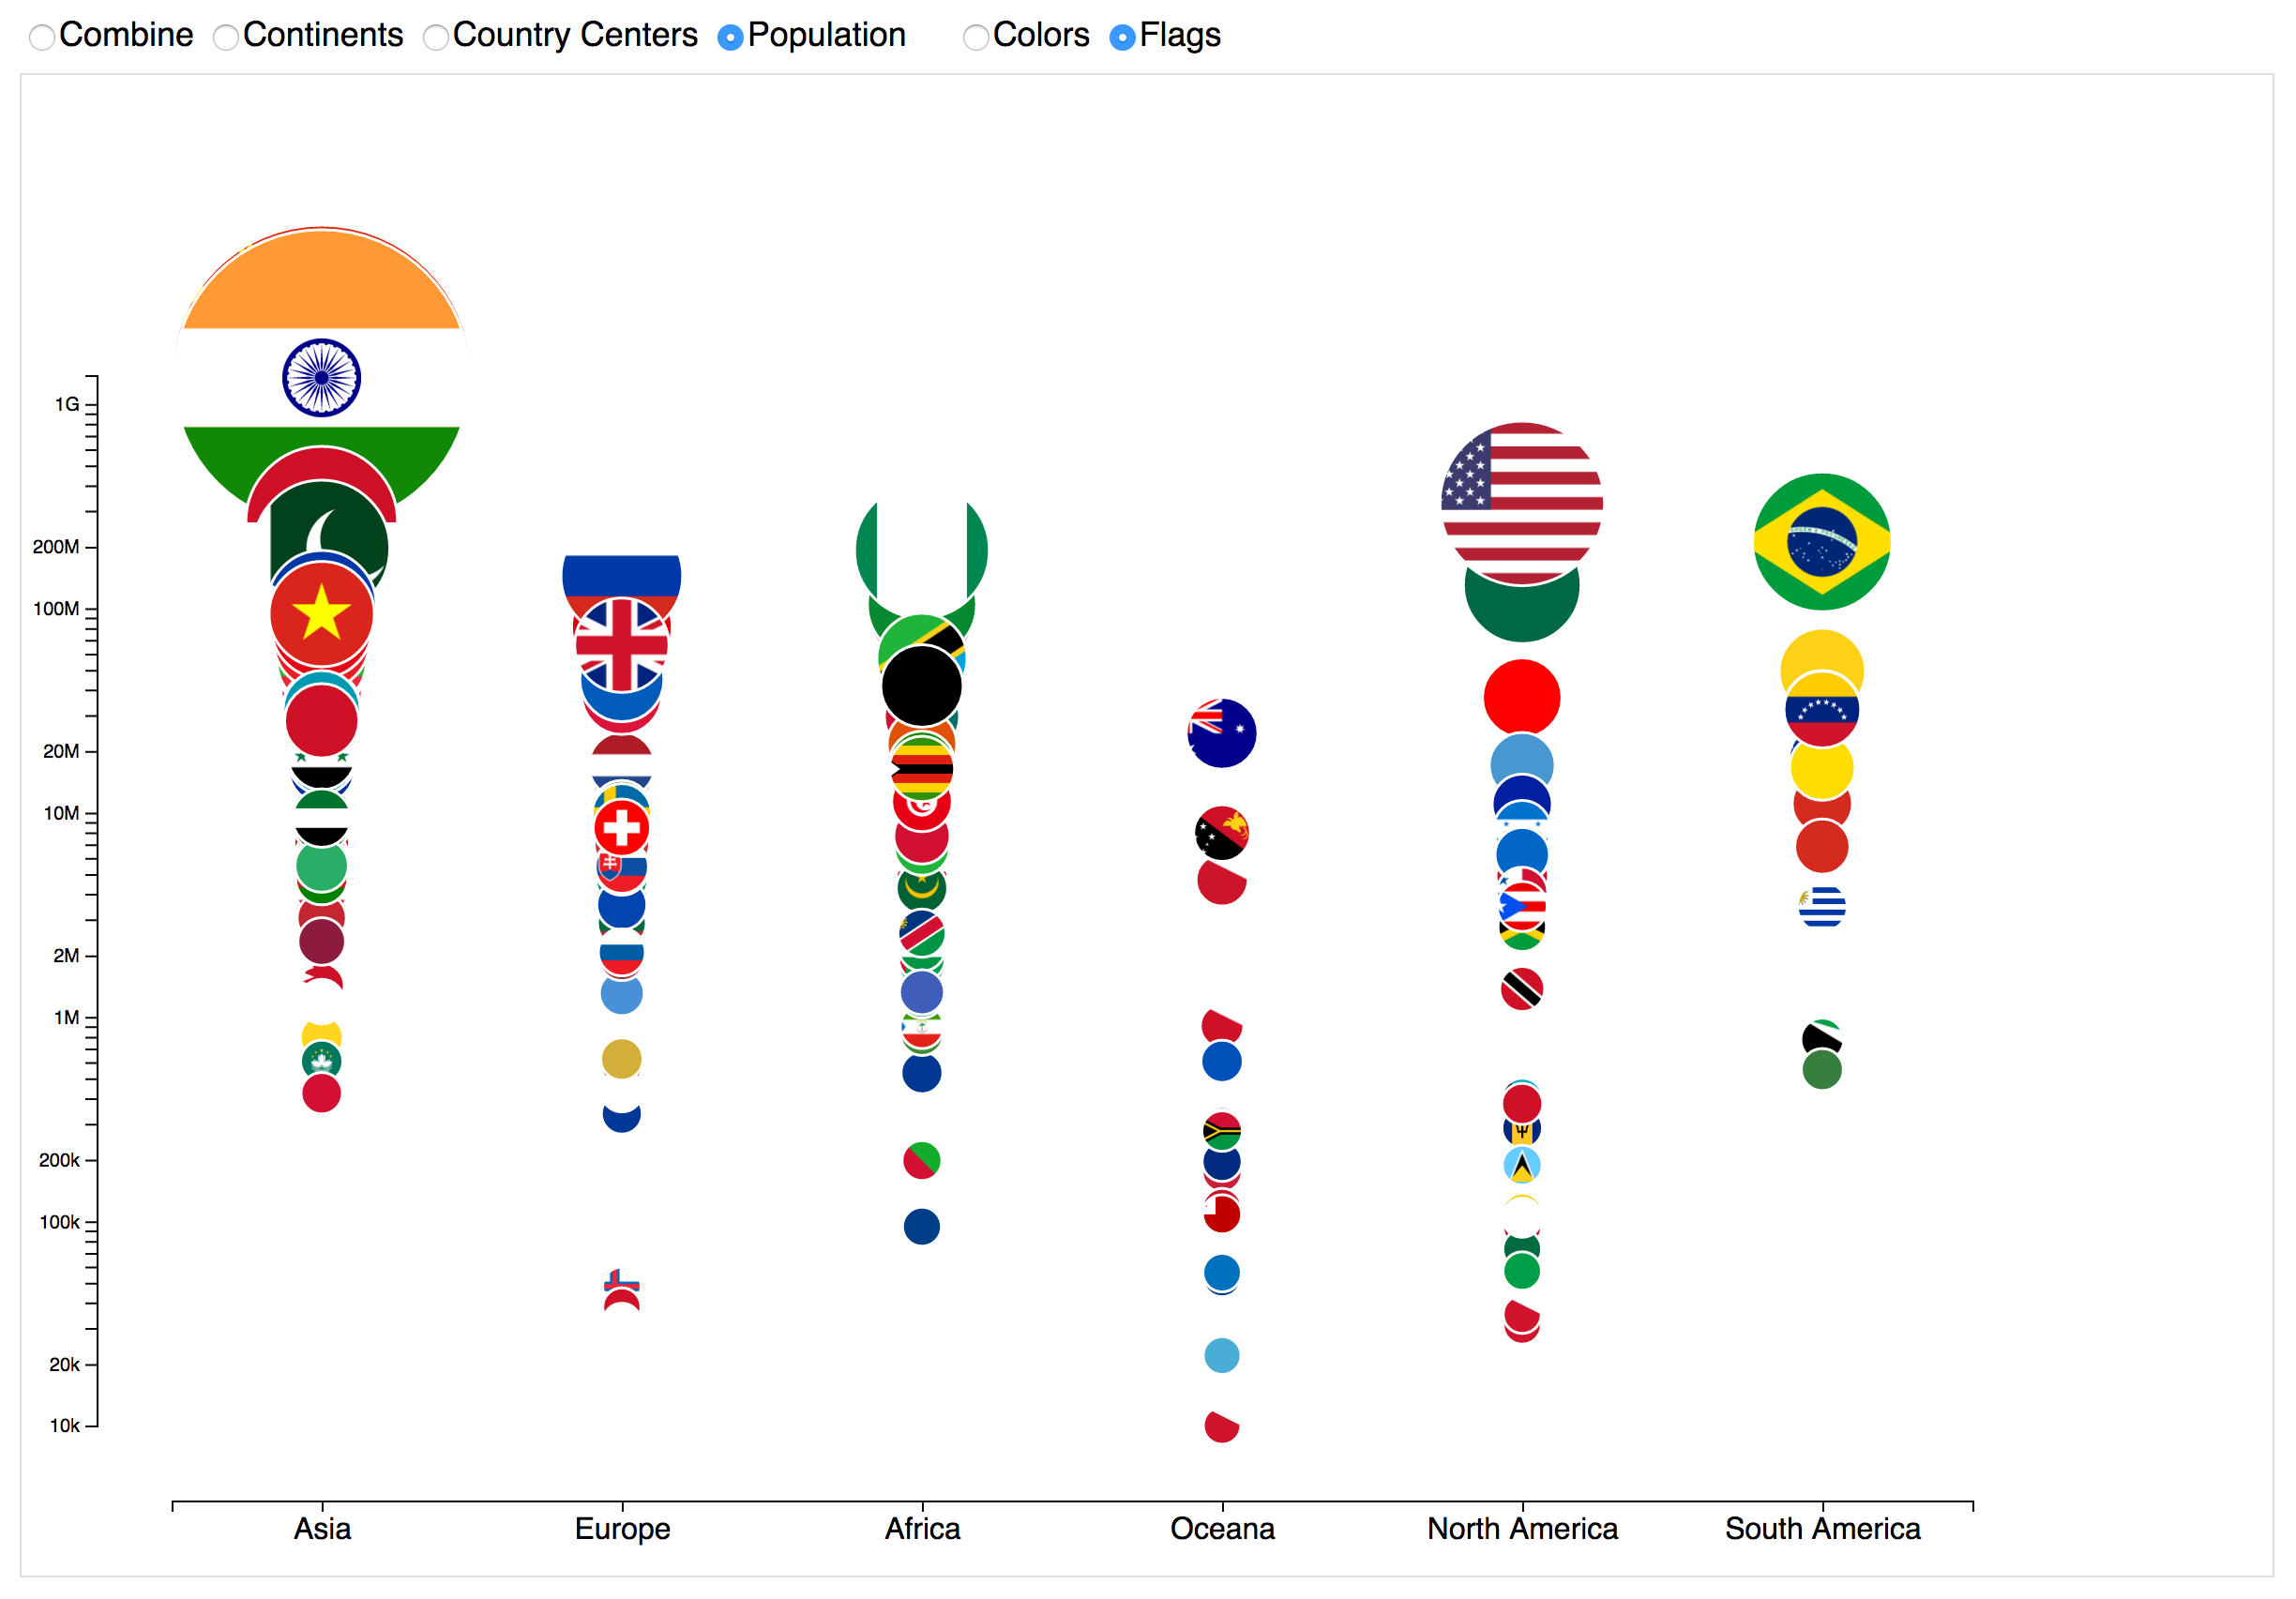
- Population
- Groups the circles by continent and sorts them according to population on a log scale.
Axes
This project also demonstrates how to animate D3 axes on and off the screen when selecting and de-selecting the Population circle grouping. Additionally, the continent color key demonstrates how to create a color key.
