Cryptocurrency Analysis Save
Analysis and visualisation of the cryptocurrency market
cryptocurrency-analysis
About
Having followed the cryptocurrency market for a while now, I decided to do some exploring in the data available from coinmarketcap. Especially in light of the increasing number of successful coins and decreasing Bitcoin dominance in terms of market capitalisation, I assume many investors are eager to understand the dynamics in this market.
To replicate, first head over to coinmarketcap-scraper;
this lets you download data from coinmarketcap into a local database.
The script analysis.R can then be run on this database - copy the database file to your R working directory.
Progress
Data updated 20/05/2019.
This is a work in progress. Steps taken so far:
-
Obtain and clean daily closing prices for each currency. This includes interpolation for missing data.
-
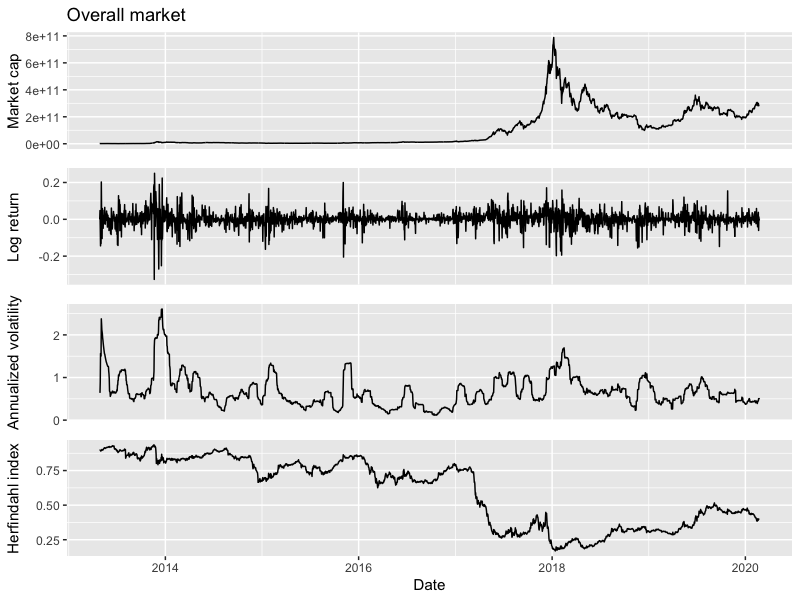
Use daily closing prices to calculate daily overall market statistics. For the sake of these calculations, the overall market is interpreted as an index/portfolio.
-
Overall market capitalisation: The sum of all currency valuations, i.e., closing prices multiplied with circulating supply as given by coinmarketcap. Please note that this is a controversial metric.
-
Overall market return: We use logarithmic returns to make daily changes in overall market value easily comparable. More information.
-
Overall market volatility: The annualized overall market volatility illustrates the degree in variation of the changes in overall market capitalisation. For each day, the value is based on the logarithmic overall market returns of the last 30 days. More information.
-
Herfindahl index: To illustrate the change in competition between currencies. The Herfindahl index measures competition in a market by summing the squares of all competitor market shares. It ranges from 1/N (highly competitive) to 1 (high concentration), where N is the number of competitors. More information.
Here, we can observe how the market capitalisation has increased during 2017 by a factor of up to 45x. The altcoin boom has increased the competition significantly since early 2017. In the data on returns and volatility we find volatility clustering, which is common in financial time series: Times of relative calm, and times of sudden price movements. Looking at the annualized volatility series, the clusters of high volatility have generally been decreasing in magnitude until late 2016. The hype during 2017 has caused higher volatility again, however less than we observe for some periods between 2013 and 2015. Note that the annualized volatilities of stock indices such as the S&P 500 are typically much lower, compared to the early crypto days up to an order of magnitude.
- Calculate statistics for each individual currency.
-
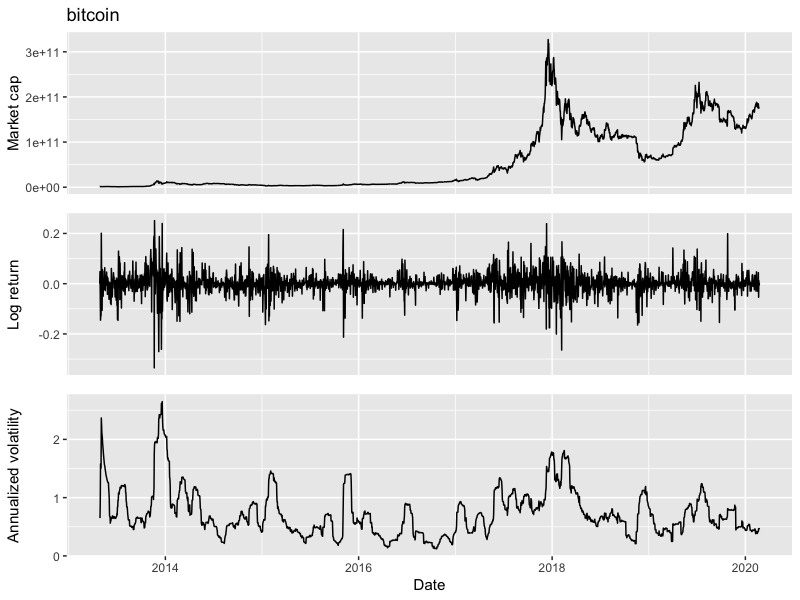
Market capitalisation: A given currency's valuation, i.e., closing price multiplied with circulating supply as given by coinmarketcap. Please note that this is a controversial metric.
-
Return: The daily logarithmic return of a given currency.
-
Volatility: The annualized volatility of a given currency; based on the logarithmic return from the last 30 days.
Example: Bitcoin.
- Comparing different currencies directly.
-
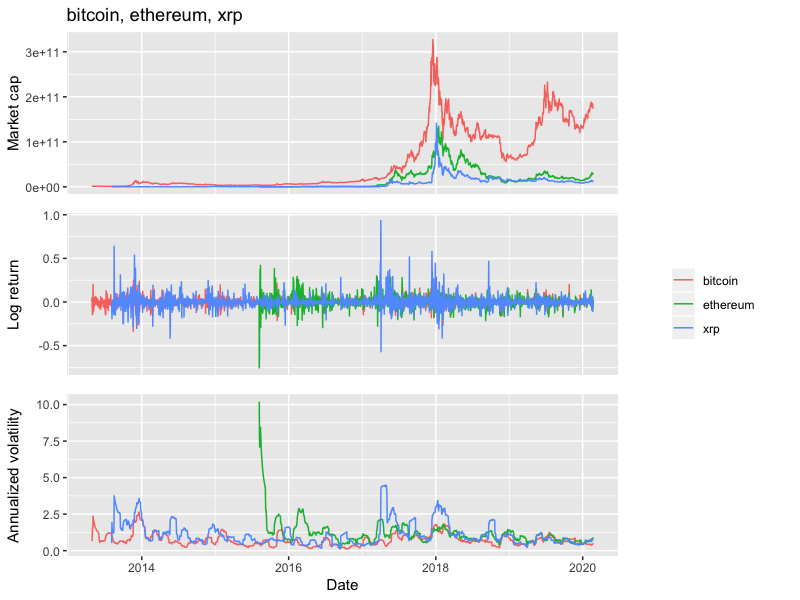
Using the already calculated statistics, we can plot daily market capitalisations, returns and volatilities of arbitrary currencies on a time axis.
Example: Bitcoin, Ethereum and Ripple.
-
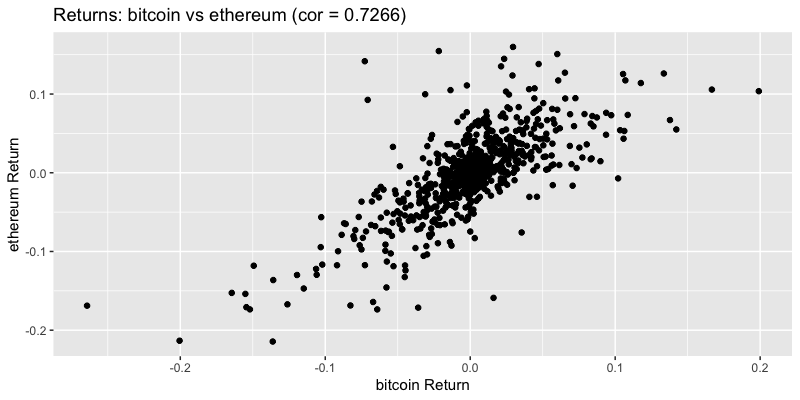
We can also investigate the correlations between the daily returns of arbitrary currencies. Correlation measures the linear relationship between two sets of data. A high positive value when comparing the daily returns of two currencies indicates a strong positive linear relationship of the returns in the past.
To illustrate the idea of correlation between two currency returns: Plotting Bitcoin vs Ethereum returns. Here, every point represents one day. Notice the slightly positive linear relationship? Note that this plot is based on data since 2018.
-
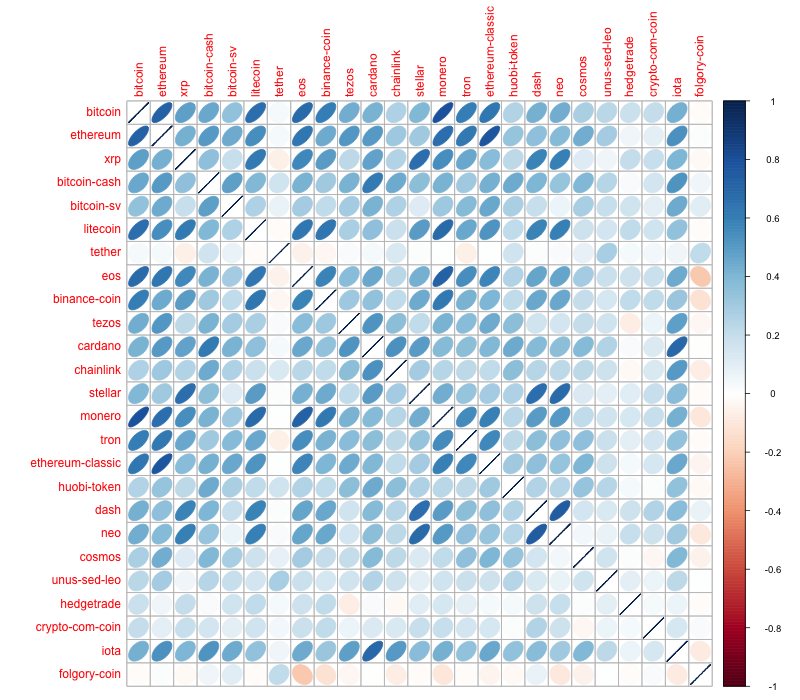
To get a better idea of the current relationships between currency returns, we can look at pairwise correlations between all currencies. The (symmetric) correlation matrix visualises the correlation for each pair of variables - from perfect positive linear relationship (blue) to perfect negative linear relationship (red).
Visualisation of the correlation matrix for top 25 coins and tokens. Note that this plot is based on data since 2018.
-
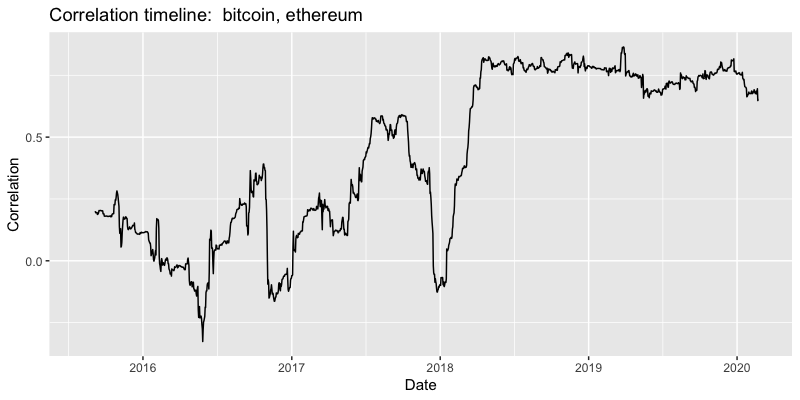
If we want to investigate the temporal development of return correlations, we can calculate this statistic for different time intervals.
Temporal development of Bitcoin vs Ethereum return correlation. Using sliding time window of 90 days.
- Comparing individual currencies with the overall market.
-
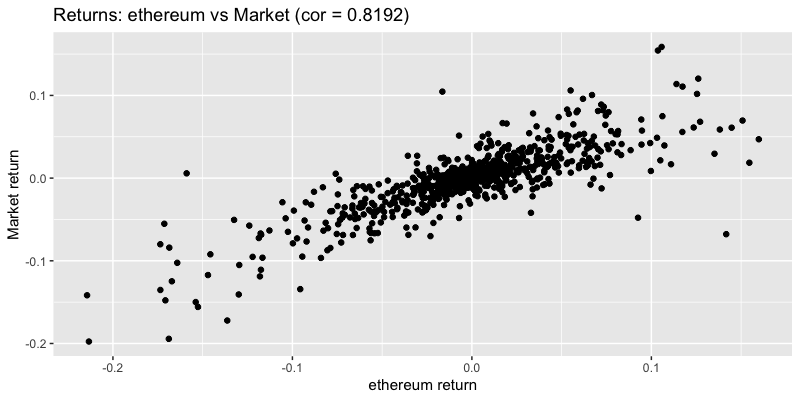
Similarly to a previous plot, we can investigate the correlation of arbitrary currency returns with the market return.
Example: Plotting Ethereum vs Market return. Note that this plot is based on data since 2018.
-
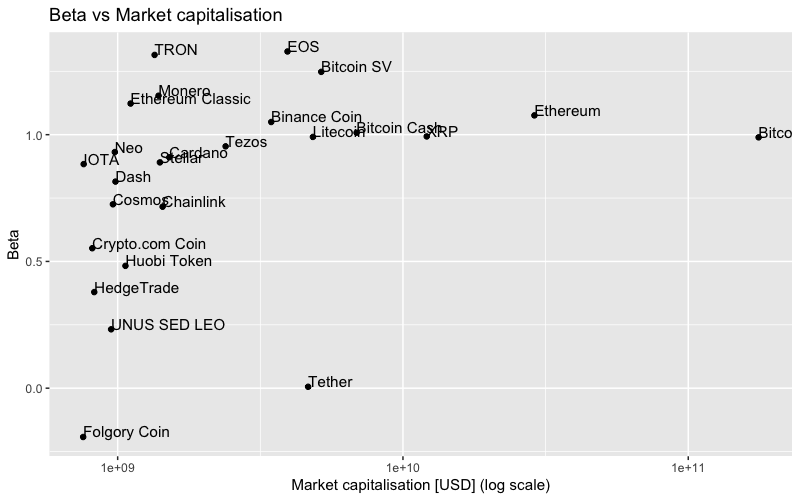
Calculate currency
betato characterise the behaviour of each currency return with respect to the market return. Beta represents the covariance of coin returns and market returns, scaled by the variance of the market returns. See Wikipedia for more information. -
Investors use the information encoded in the beta coefficient to characterise an asset's volatility and tendency to move in accordance with the market index.
beta = 1indicates that the asset moves exactly like the market index. More information. Here, the market is dominated by bitcoin, hence bitcoin's beta is very close to 1 and a coin's beta can also be interpreted as a comparison to bitcoin's movement.Here, we plot currency betas against market capitalisations for the top 20 coins in terms of market capitalisation. Note that this plot is based on data since 2018.
-
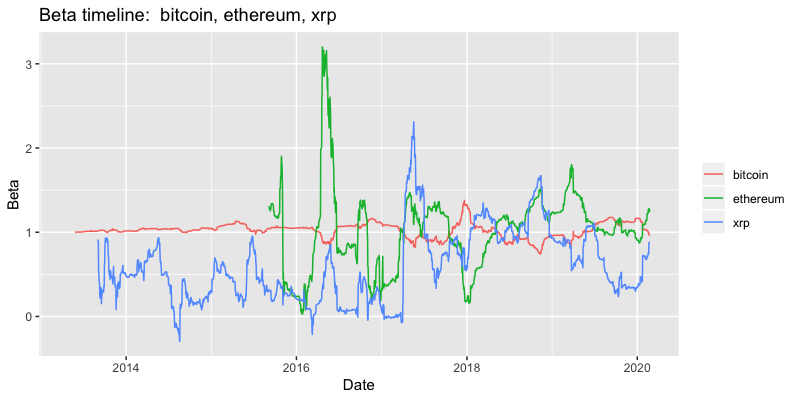
The temporal development of betas can also be interesting.
Temporal development of beta for Bitcoin, Ethereum and Ripple. Using sliding time window of 90 days.
Crypto millionaire?
I am updating this page every week or so.
- Tip BTC: 18s8pb2maRn1K1DERJggxUuGVXCw9wTHLD
- Tip ETH: 0x586a8Dcc5d64A8d8d50e044bD69FA33d2D20c349
