COVID19DataVisualizationHoloLens2 Save
COVID-19 Data Visualization for HoloLens2 / HoloLens / Windows Mixed Reality with MRTK
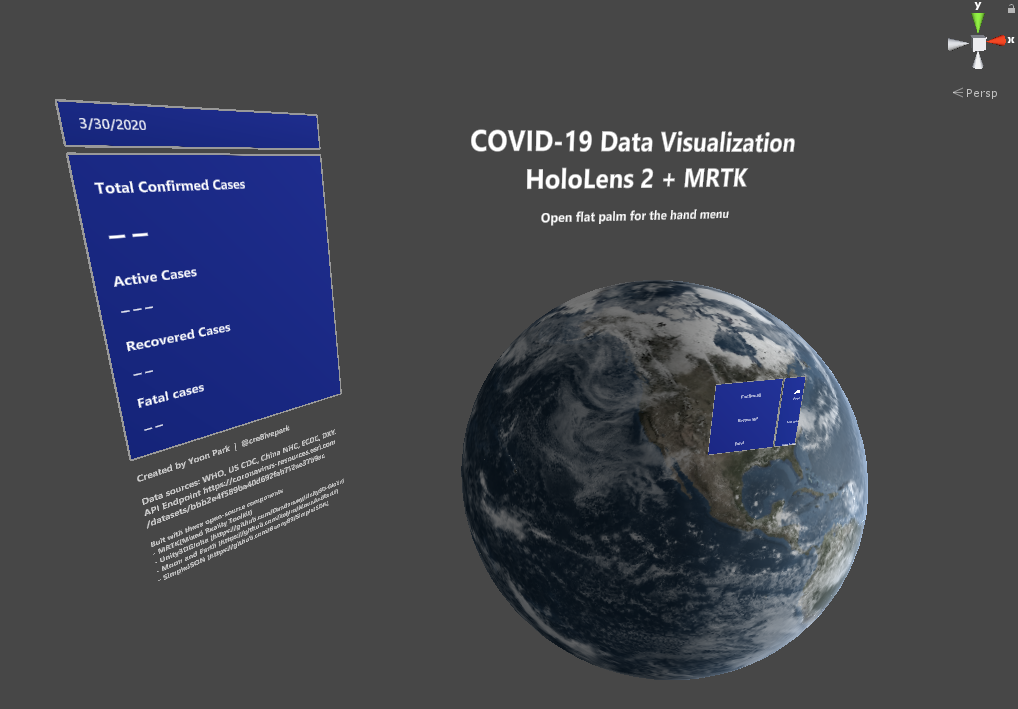
COVID19 Data Visualization with HoloLens2 + MRTK
Experimental COVID-19 Data Visualization for HoloLens 2 with MRTK. This project explores how volumetric data can be represented in physical space with direct hand-tracking inputs in mixed reality using HoloLens 2. It is based on Microsoft's MRTK(Microsoft's Mixed Reality Toolkit)
The project works with HoloLens 1st gen as well. (use static menu instead of hand menu)


Video (Updated 4/5/2020)
Data source
ESRI's Coronavirus COVID-19 Cases feature layer
https://coronavirus-resources.esri.com/datasets/bbb2e4f589ba40d692fab712ae37b9ac
Project
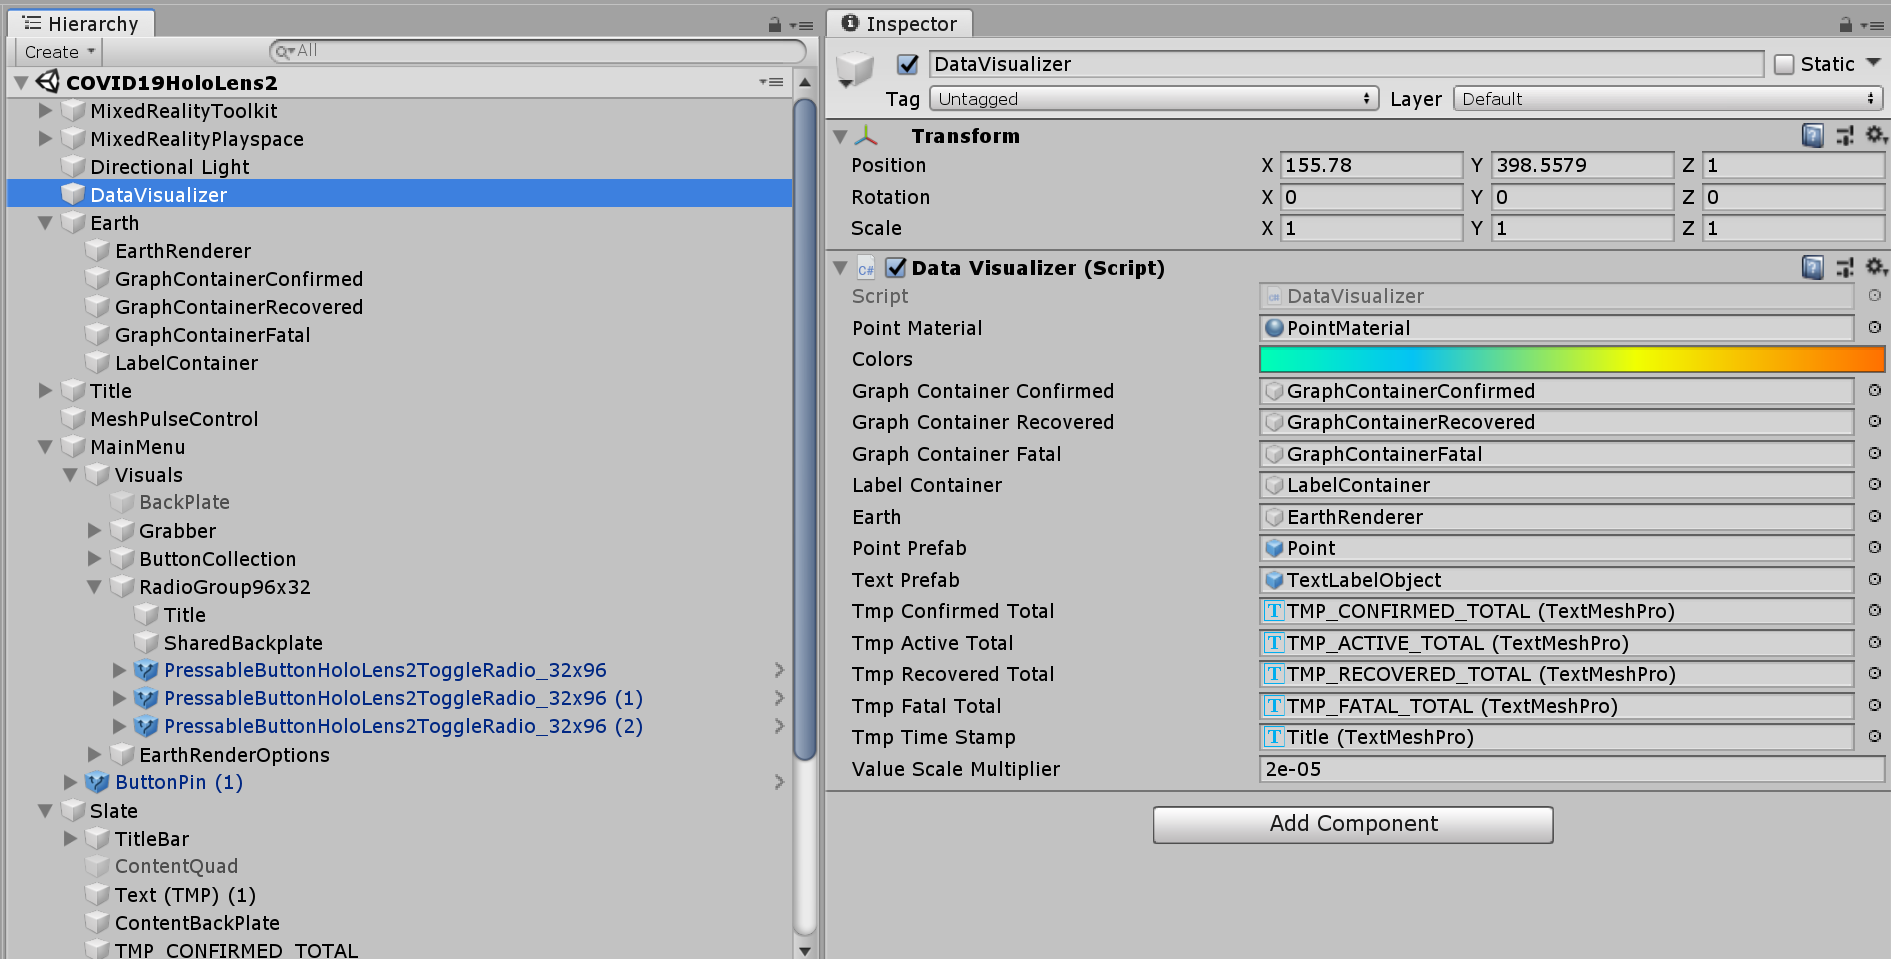
DataVisualizer.cs script contains the code for retrieving, parsing JSON data, and visualizing with graphs. Graph elements are added to GraphContainerConfirmed, GraphContainerRecovered, GraphContainerFatal, and LabelContainer. CreateMeshes() creates the graph for three data values and text label. Main menu's Radio buttons simply show/hide GraphContainer objects.
Menu stays around the user with tag-along behavior which is provided by MRTK's RadialView solver. Using the pin button, you can toggle tag-along behavior. Menu's backplate can be grabbed and moved. Grabbing and moving menu automatically disables the tag-along and makes the menu world-locked.
Menu's toggle button shows & hides GraphContainer and LabelContainer. Use slider UI for configuring the earth rendering options.
- Earth color saturation level
- Cloud opacity
- Sea color saturation level


Build and deploy
Please make sure to use 'Single Pass' (not Single Pass Instanced) to render graph properly on the device.

Built with these open-source components
- MRTK(Mixed Reality Toolkit) (http://aka.ms/MRTK)
- Unity3DGlobe (https://github.com/Dandarawy/Unity3D-Globe)
- Moon and Earth (https://github.com/keijiro/MoonAndEarth)
- SimpleJSON (https://github.com/Bunny83/SimpleJSON)
Features
- Near interactions with direct grab/move/rotate (one or two-handed)
- Far interactions using hand ray (one or two-handed)
- Main menu to switch the data, change earth rendering options
- Toggle graph, text label
- Toggle auto-rotate
Known issues
- Data normalization & polish needed
- Sometimes two-handed manipulation makes the globe tiny and not properly scalable. Use hand-ray to make it bigger again.

Disclaimer
*I work at Microsoft as a User Experience Designer. This project is my personal project. All experiments and related opinions are my own.
