Chartpy Save
Easy to use Python API wrapper to plot charts with matplotlib, plotly, bokeh and more
chartpy
chartpy creates a simple easy to use API to plot in a number of great Python chart libraries like plotly (via cufflinks), bokeh and matplotlib, with a unified interface. You simply need to change a single keyword to change which chart engine to use (see below), rather than having to learn the low level details of each library. I've also created new stylesheets and formating to ensure that the default matplotlib styling looks more modern using Open Sans font.
Contributors for the project are very much welcome, sell below!
chart = Chart(df=df, chart_type='line', style=style)

# we now plot using multiple plotting libraries, with the same dataframe
chart.plot(engine='matplotlib')
chart.plot(engine='bokeh')
chart.plot(engine='plotly')
I had previously written the open source PyThalesians financial library. This new chartpy library has some similar functionality to the chart part of that library. However, I've totally rewritten the API to make it much cleaner and easier to use. It is also now a fully standalone package, so it'll be easier to use for both non-financial and financial applications. It also has many more features including subplots and much more.
At present chartpy supports several types of plots
- line (bokeh, plotly and matplotlib)
- bar (bokeh, plotly and matplotlib)
- scatter (bokeh, plotly and matplotlib)
- bar horizontal (matplotlib and plotly)
- heatmap (matplotlib and plotly)
- surface (plotly)
- map plots (plotly)
- looking to add more (any requests?)
VisPy
There is also very early support for line charts generated by vispy, which allows for GPU accelerated plotting in Python. However, at present the wrapper doesn't yet support plotting of dates (these are ignored when plotting).
There is a big speed improvement in using the VisPy wrapper if you are plotting many millions of points (with a small number of points matplotlib seems quicker). Installation instructions for VisPy are here. By default, chartpy will install the latest release version, but you find it necessary to use the most up to date development version of VisPy
Other points to note
- Please bear in mind at present chartpy is currently a highly experimental alpha project and isn't yet fully documented
- Uses Apache 2.0 licence
Gallery
Doing plots in multiple libraries by simply changing a keyword, from the Jupyter notebook.

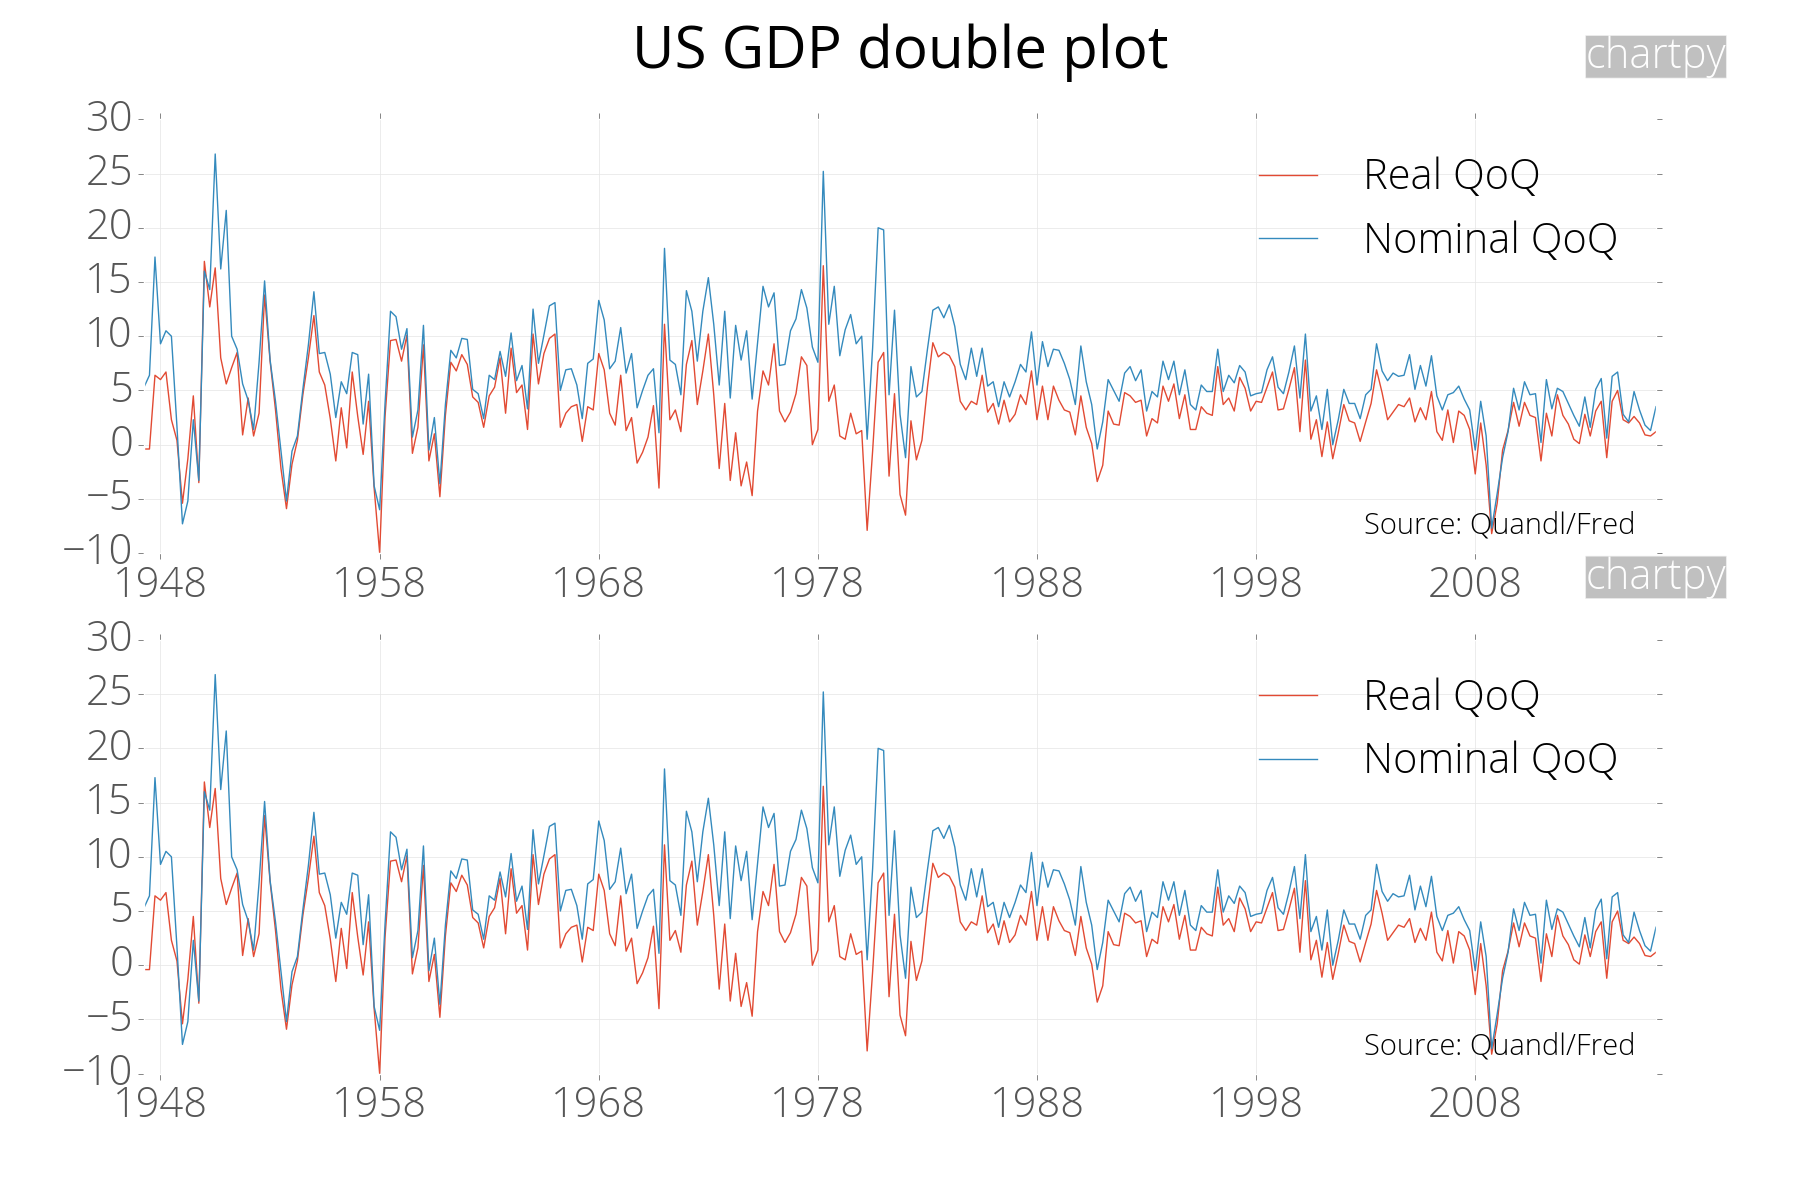
Create subplots with minimal extra coding (see examples/subplot_examples.py)
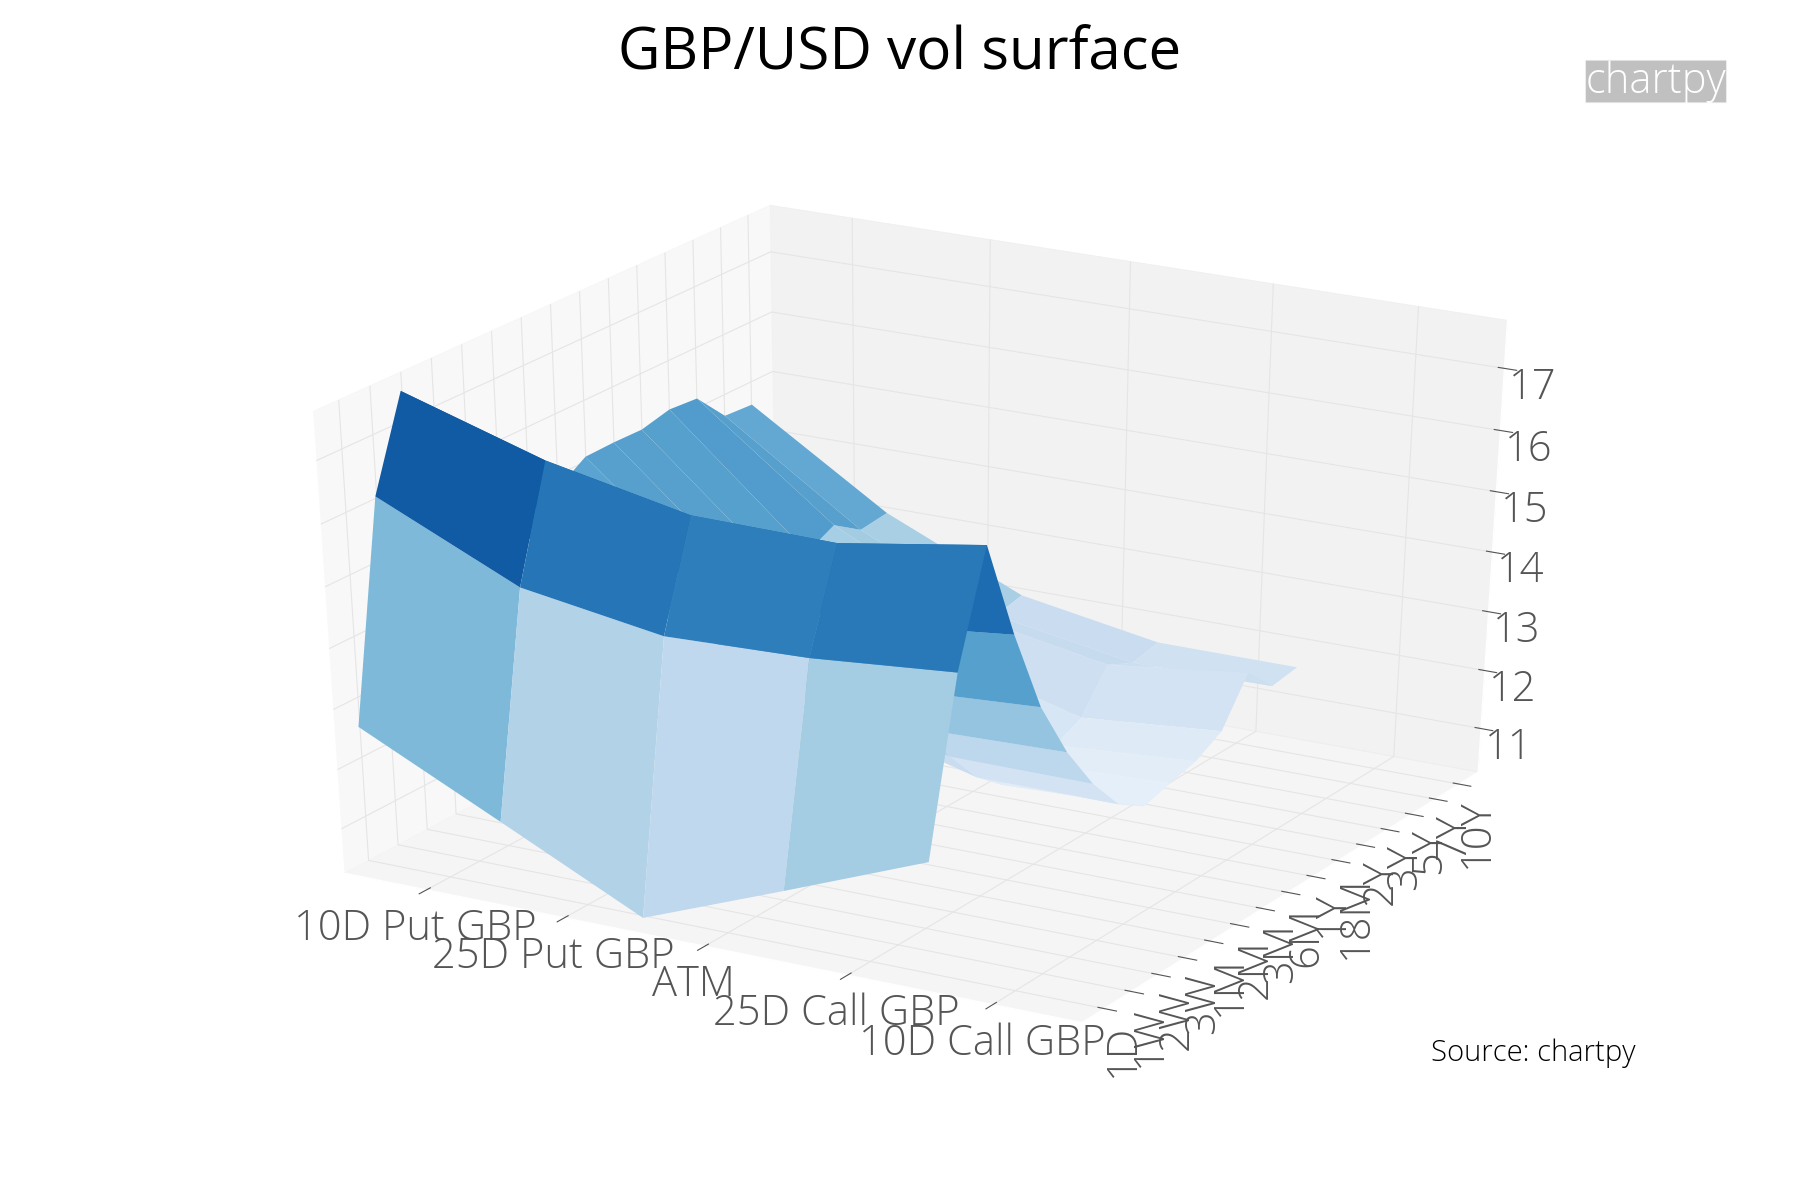
Do surface plots (plotly only at present - see examples/surface_examples.py)
Do bar horizontal plots (matplotlib and plotly - see examples/chart_demo.py)

Create heatmaps (matplotlib and plotly - see examples/chart_demo.py)


Create HTML webpages (using Canvas class - see examples/canvas_demo.py) - using mixture of plots (plotly, bokeh & matplotlib), tables and text, with just a few lines of Python! The HTML file can then be uploaded to a webserver for display (or sent around by e-mail etc)

Requirements
Major requirements
- Required: Python 3.7
- Required: pandas, matplotlib, plotly, cufflinks, bokeh, numpy etc.
To install Open Sans font
My chartpy stylesheet for matplotlib uses the free Open Sans font. For it to display properly you need to install Open Sans font on your computer
- First download font from https://www.fontsquirrel.com/fonts/open-sans
- Windows: Install font by dragging to Windows/fonts folder
- Windows: Reset matplotlib font cache (delete file eg. c:/users/username/.matplotlib/fontList.py3k.cache
- On Mac OS X/Linux procedure for installing fonts is different
Installation
You can install the library using the below (latest version). After installation:
- Make sure you edit the chartconstants.py file for the correct Plotly API and Twitter API keys (or create a chartcred.py file)
pip install git+https://github.com/cuemacro/chartpy.git
You can also install chartpy from PyPI (but this will usually be a slightly older version)
pip install chartpy
Note that chartpy now supports Plotly 4, because Cufflinks 0.17 now works with Plotly 4!
pip install cufflinks==0.17 plotly==4.2.1
Why did I write chartpy?
There are many good charting libraries. However, they all have different APIs. It took me a lot of time to learn a new API, for each new plotting library I wanted to use. I ended up writing chartpy to abstract away all this complexity, so I could concentrate on analysing data, rather than getting caught up in complex API visualisation calls. Rather than having to totally edit my code each time, a single keyword is enough to switch between for example plotly and matplotlib.
I've also tried to design the library so that adding a new plotting engine is fairly straightforward (extend EngineTemplate and edit the get_engine method in Chart), so it's basically future proof for whatever new chart libraries come along, with relatively small changes to your code base.
Interactive Web Dashboards with chartpy/dash
chartpy also has interactive dashboards based on Plotly's Dash package, but with a lot less of the boilerplate code
which Dash uses. Users extend LayoutCanvas to create their own Dash layouts and SketchComponents can be used
to quickly create Dash components/HTML components, with relatively few lines of code.
Hence, it's a lot quicker to create Dash based dashboards in chartpy! In the future, we want to also support other Python dashboards like H2O Wave.
You'll need to install Dash as an extra to use them as they aren't part of the default installation, which we can see below (Linux at top, Windows on bottom):
pip install cufflinks==0.17.3 plotly==4.14.3 kaleido dash==1.20.0 \
  dash-html-components==1.1.3 dash-core-components==1.16.0 dash-table==4.11.3 \
  jupyter-dash==0.4.0 chart_studio==1.1.0

pip install cufflinks==0.17.3 plotly==4.14.3 kaleido dash==1.20.0 ^
  dash-html-components==1.1.3 dash-core-components==1.16.0 dash-table==4.11.3 ^
  jupyter-dash==0.4.0 chart_studio==1.1.0
Contributors
Contributors are always welcome for finmarketpy, findatapy and chartpy. If you'd like to contribute, have a look at Planned Features for areas we're looking for help on. Or if you have any ideas for improvements to the libriares please let us know too!
chartpy examples
In chartpy/examples you will find several demos
Recent Release Notes
- 10 Apr 2024 - v0.1.14
- 12 Oct 2023 - v0.1.13
- 07 Jul 2022 - v0.1.12
- 06 Oct 2021 - v0.1.11
- 01 Jun 2021 - v0.1.10
- 04 May 2021 - v0.1.9
- 08 Jun 2020 - v0.1.8
- 06 May 2020 - v0.1.7
- 06 Apr 2020 - v0.1.6
- 02 Apr 2020 - v0.1.5
- 23 Oct 2019 - v0.1.4
Coding log
- 10 Apr 2024
- Added option to create Plotly charts without JavaScript embedding (smaller file sizes)
- 02 Nov 2022
- Added data parameter for creation of Dash table
- 01 Sep 2022
- Fix for latest Dash datatable
- 15 Aug 2022
- Added subplot parameters for Plotly
- 11 Aug 2022
- Minor change to headline title size for Dash datatable
- 07 Jul 2022
- Edited SketchComponents to take into account deprecated Dash imports
- 29 Jun 2021
- Add downloads badge
- 14 May 2021
- Added extra font properties for Dash DataTables
- Fixed default font
- 12 May 2021
- Fixed display of Dash DataTables for new Dash versions
- 06 May 2021
- Fixed subplots with plotly
- Added realized vol to dashboard example
- 05 May 2021
- Add simple dashboard example for downloading Quandl data
- 04 May 2021
- Changed default widths for dashboard
- 03 May 2021
- Spinning out some Dash visualization tools from tcapy to chartpy
- 19 Apr 2021
- Add region plot
- 15 Apr 2021
- Constant overrides now persist
- 13 Apr 2021
- Can add second y-axis labels for Plotly
- 22 Mar 2021
- Added more formatting for Plotly (eg. text font etc.)
- 02 Dec 2020
- Added animation for Plotly
- 08 Jun 2020
- Now requires Plotly >=4.5.1
- Fixed setup.py to install chart-studio
- 06 May 2020 - Plotly can now export to PNG
- 02 Apr 2020 - Plotly can now produce SVG
- 02 Nov 2019 - Now supports Plotly 4.x with Cufflinks 0.17
- 23 Oct 2019 - Added advisory on Plotly 3.10 and Cufflinks 0.16
- 19 Aug 2019 - Removed .ix usage, which is now deprecated in Pandas
- 06 Aug 2019 - Refactored Plotly code, adding Plotly 4.0 support (not complete yet)
- 06 Mar 2019 - Changed library for PDF generation
- 12 Feb 2019 - Fixed bug with dot/dash Plotly charts
- 27 Nov 2018 - Fixed deprecation message for plotly.graph_objs.layout.Margin
- 11 Oct 2018 - Added support for Plotly 3.0 (with line gaps)
- 08 Aug 2018 - Added fixes for bubble charts
- 06 Jun 2018 - Fixed issue with plotly bubble charts
- 26 Mar 2018 - Various bug fixes (bubble charts, plotting pandas dataframes etc).
- 19 Feb 2018 - Support for Python 2.7 and Plotly engine now supports dash
- 21 Dec 2017 - Added webgl Plotly charts & other Plotly parameters
- 15 Nov 2017 - Fixed bug when plotting time series with DatetimeIndex and newer matplotlib
- 10 Oct 2017 - Added flag to works in Bokeh 0.12.9
- 18 Sep 2017 - Fixed plotting DataFrame with DatetimeIndex with Bokeh
- 05 Jul 2017 - Fixed PLANNED_FEATURES.md link
- 03 May 2017 - Added more on contributors
- 24 Apr 2017 - Added extra xkcd example
- 19 Feb 2017 - Added simple animations for matplotlib
- 16 Feb 2017 - Added VisPy support for plotting and added demo example
- 11 Feb 2017 - Added chartpy logo
- 05 Feb 2017 - Fixed x-axis date formatting issue with matplotlib wrapper
- 02 Feb 2017 - Added page title to Canvas and starting to add PDF support for canvas
- 27 Jan 2017 - Added save_fig attribute in style
- 23 Jan 2017 - Moved examples folder
- 30 Nov 2016 - Added skeleton for bqplot (not implemented yet)
- 17 Oct 2016 - Added grid flags for bokeh, plotly and matplotlib, improved formating on printing dataframes
- 14 Oct 2016 - Fixed missing stylesheets in package setup
- 12 Oct 2016 - Fixed handling of auto generated filenames
- 11 Oct 2016 - Changed handling of auto generated filenames
- 10 Oct 2016 - Added xkcd style plots for matplotlib
- 07 Oct 2016 - Added .idea to .gitignore
- 06 Oct 2016 - Added support for secondary y-axis in Plotly
- 29 Sep 2016 - New webpage_examples notebook to illustrate creating chart webpages
- 26 Sep 2016 - Added thin margin setting for Plotly
- 25 Sep 2016 - Added Canvas method to easily create webpage reports with charts
- 23 Sep 2016 - Fixed deprecated method for uploading to Twitter
- 03 Sep 2016 - Added horizontal bars and heatmap for matplotlib and plotly
- 28 Aug 2016 - Added explanation of why chartpy?
- 20 Aug 2016 - Added Plotly default palette, surface examples
- 19 Aug 2016 - Added HTML examples for bokeh & plotly, subplotting for bokeh, plotly & matplotlib (with subplot_examples)
- 17 Aug 2016 - Uploaded first code
End of note
