Asciivmssdashboard Save
ASCii VM Scale Set Dashboard
ASCii VMSS Dashboard v2.0
Dashboard to show and configure Azure VM Scale Set status, properties... Version 2.0 New Features:
- New Azure regions (GA), now the dashboard shows 46 Azure Regions!
- UniCurses included in the tool and a pip package for easy of installation (just execute: pip install asciivmssdashboard).
- PDCurses library included as well (32bits and 64bits versions) for Windows machines (ps.: 64bits version needs a fix as it compiled OK but is crashing in runtime).
- Linux and Windows, Python 2 and 3 as well as 32bits and 64bits packages ready to install! Just a note above for the Windows 64bits version of PDCurses.
- New DEMO Execution Mode where you can just install the tool and execute it for a quick and nice demo (no need to have a real VMSS setup). Ideal to quickly see the tool in action and Azure/VMSS demos.

Simple and easy to start VMs...
Watch live graphs of Insights Telemetry data, logs and more!
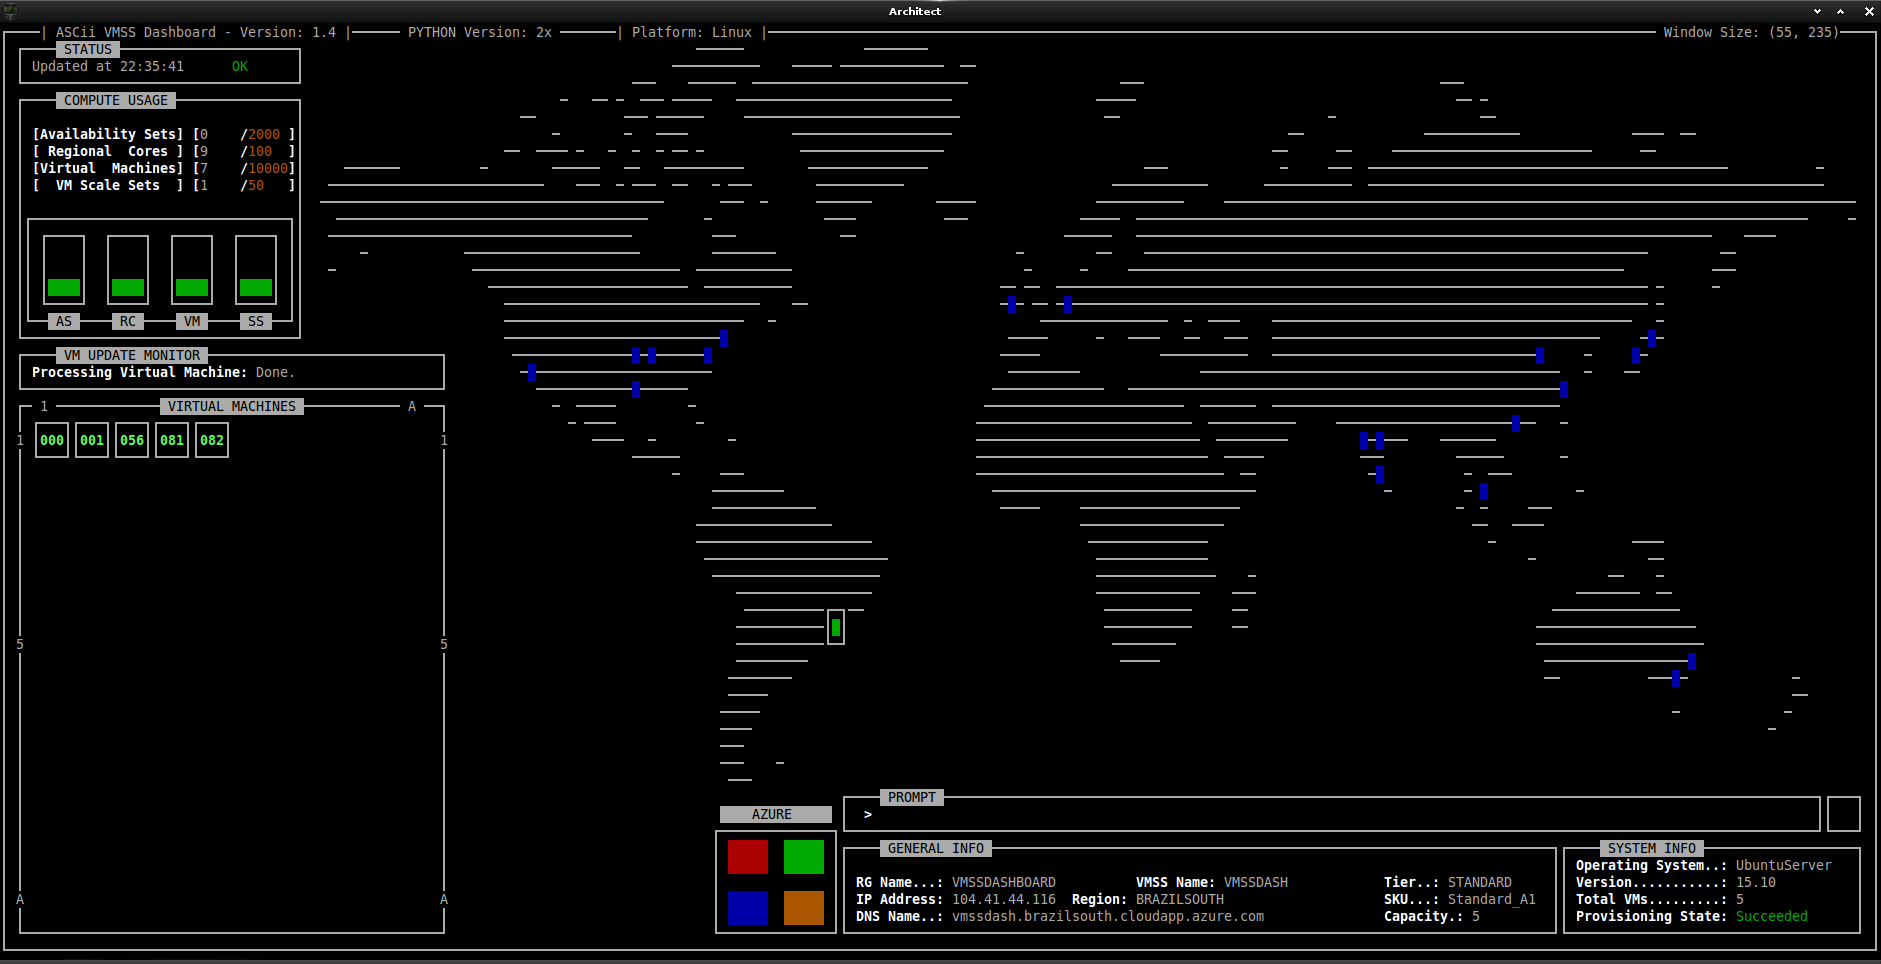
Fear nothing, the global map is still here...
Installation
USING DOCKER (Ubuntu):
-
If you don't have docker installed, first execute: sudo apt-get install -y docker.io
-
With docker installed:
- sudo docker pull msleal/asciivmssdashboard
- sudo docker run -i -t e28007e9030b /bin/bash
- su - architect
- cd asciivmssdashboard
- git pull origin master
- cp asciivmssdashboard.json.tmpl /home/your-username/.asciivmssdashboard/asciivmssdashboard.json
-
Fill in the asciivmssdashboard.json config file with your custom values... 8. export TERM=screen; export PYTHONDONTWRITEBYTECODE=1; ./console.py
OR:
- Install Python 2.x or 3.x.
- Install the ASCii VMSS Dashboard: pip install asciivmssdashboard.
- This application uses Unicurses: https://pypi.org/project/UniCurses, and a version of UniCurses (+pdcurses for Windows platform), already comes with asciivmssdashboard.
After you have the application installed, you will need: For DEMO (No real vmss config)
- Just run: asciivmssdashboard
For use it in a Real VMSS Dashboard
-
Register an Azure application, create a service principal, and get your tenant id. See "Using ASCiiVMSSDashboard".
-
Put in values for your application along with your resource group name and VM Scale Set name in /home/your-username/asciivmssdashboard.json file.
-
If you want to watch the Insights Telemetry Graphs (for the Azure Service), you will need to configure Azure Insights. See "Using Application Insights Telemetry Data".
You can use a custom URL (e.g.: Your own Telemetry API). For that, you will need to have an Telemetry API that provides the metrics (e.g.: JSON), similar to Azure Application Insights.
NOTE: If you want to use custom telemetry APIs Services, leave the 'insightsUrl' config option 'empty'. If the insightsUrl is configured, it will have precedence and ASCiiVMSSDashboard will use it in conjuction with the metric (e.g.: insightsOneMetric) configured. If it is not configured, and (for example): insightsOne is enabled, the insightsOneUrl will be used to get the first metric.
-
Run (on Linux): asciivmssdashboard or (on Windows): path_to_python path_to_asciivmssdashboard_script.
-
To Exit the Console, just hit: Ctrl+C or use the command: 'quit' (for a 'clean' exit, we will wait for the update threads to finish). In the Windows Platform you can just use the command: 'quit' for now (See "CAVEATS" bellow).
WATCH THE CONSOLE IN ACTION:
Subtitle/Captions should be enabled by default, but if not, enable them to follow the action (English and Portuguese BR available). Don't forget to subscribe to the channel for updates...
ASCiiVMSSDashboard (v1.4) - Screencast
ASCiiVMSSDashboard (v1.4) - running natively on Android (Youtube Version)
ASCiiVMSSDashboard (v1.0) - Screencast
Enjoy some code and loud music!
FEATURES:
Release Version 1.8 has animations for the Windows (Continents), Azure Regions updated,, and change of the color for the regions on map for better visibility. Other than that, I changed the character for representing the regions to be a 'block' and not just a space, so I could add bright color and have it highlighted (just works for foreground, so space was not working).
Version 1.6 features Telemetry data on graphs integrated on the ASCiiVMSSDashboard now is fully integrated and flexible.
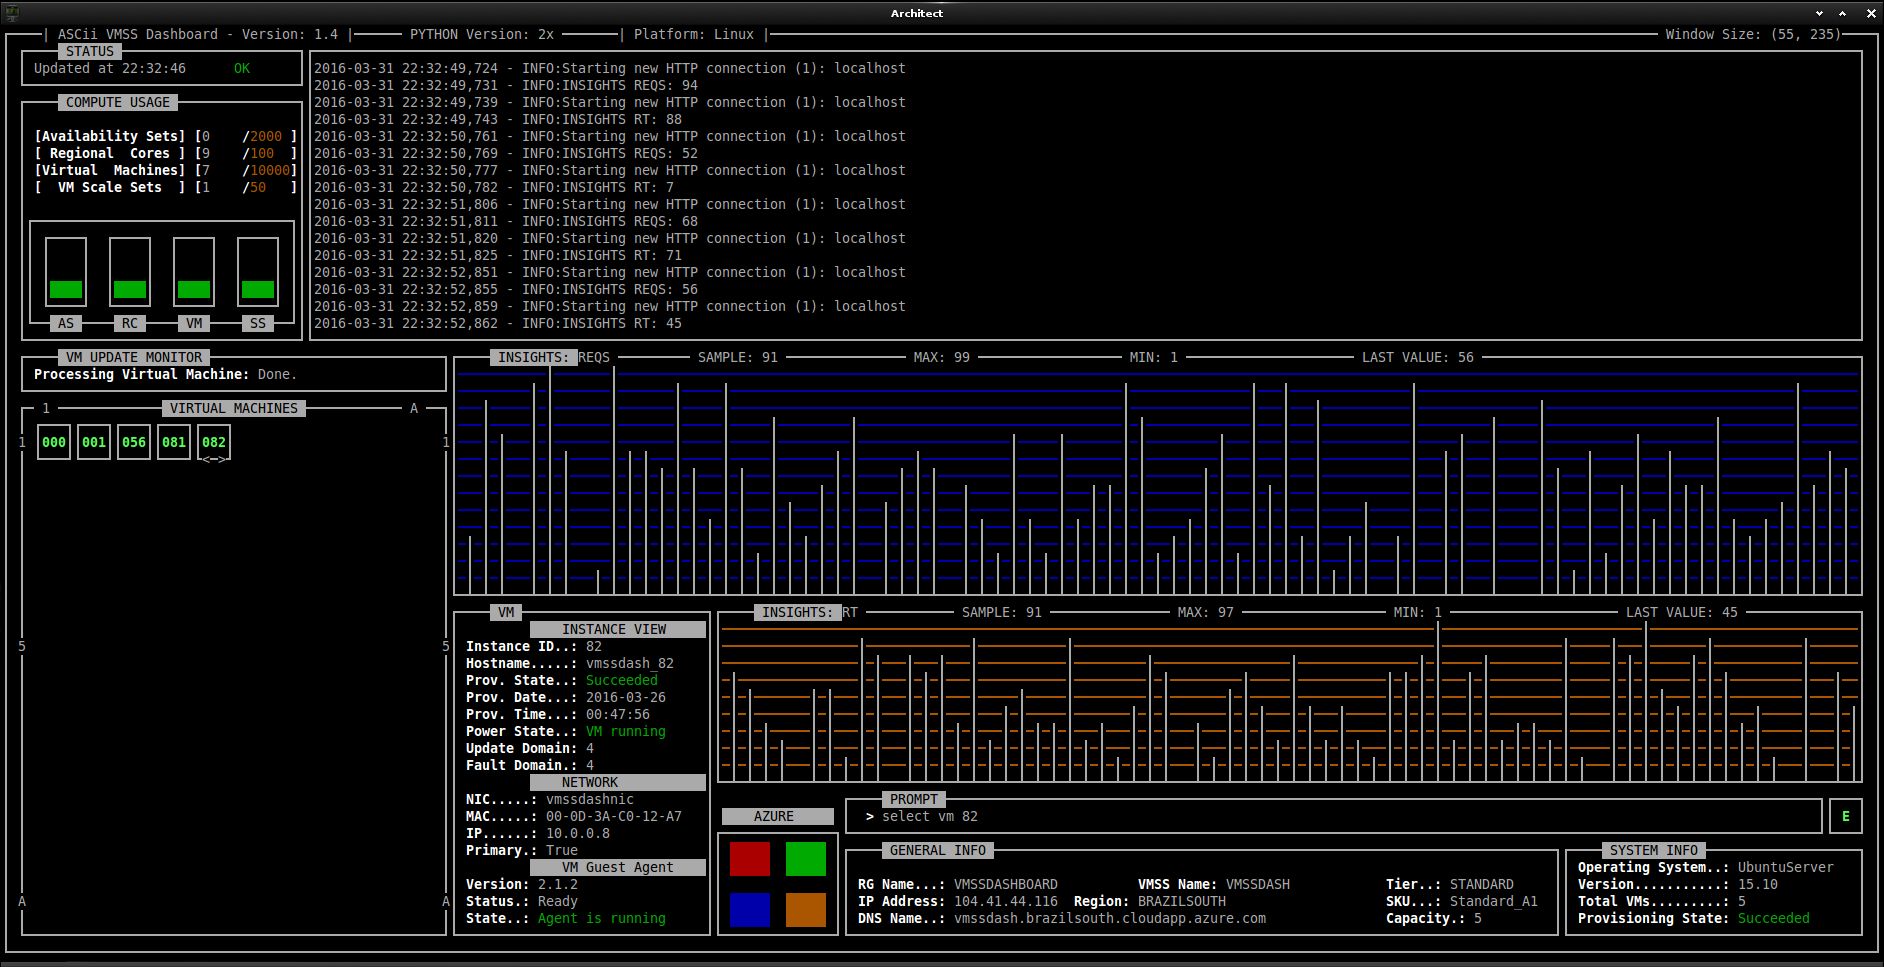
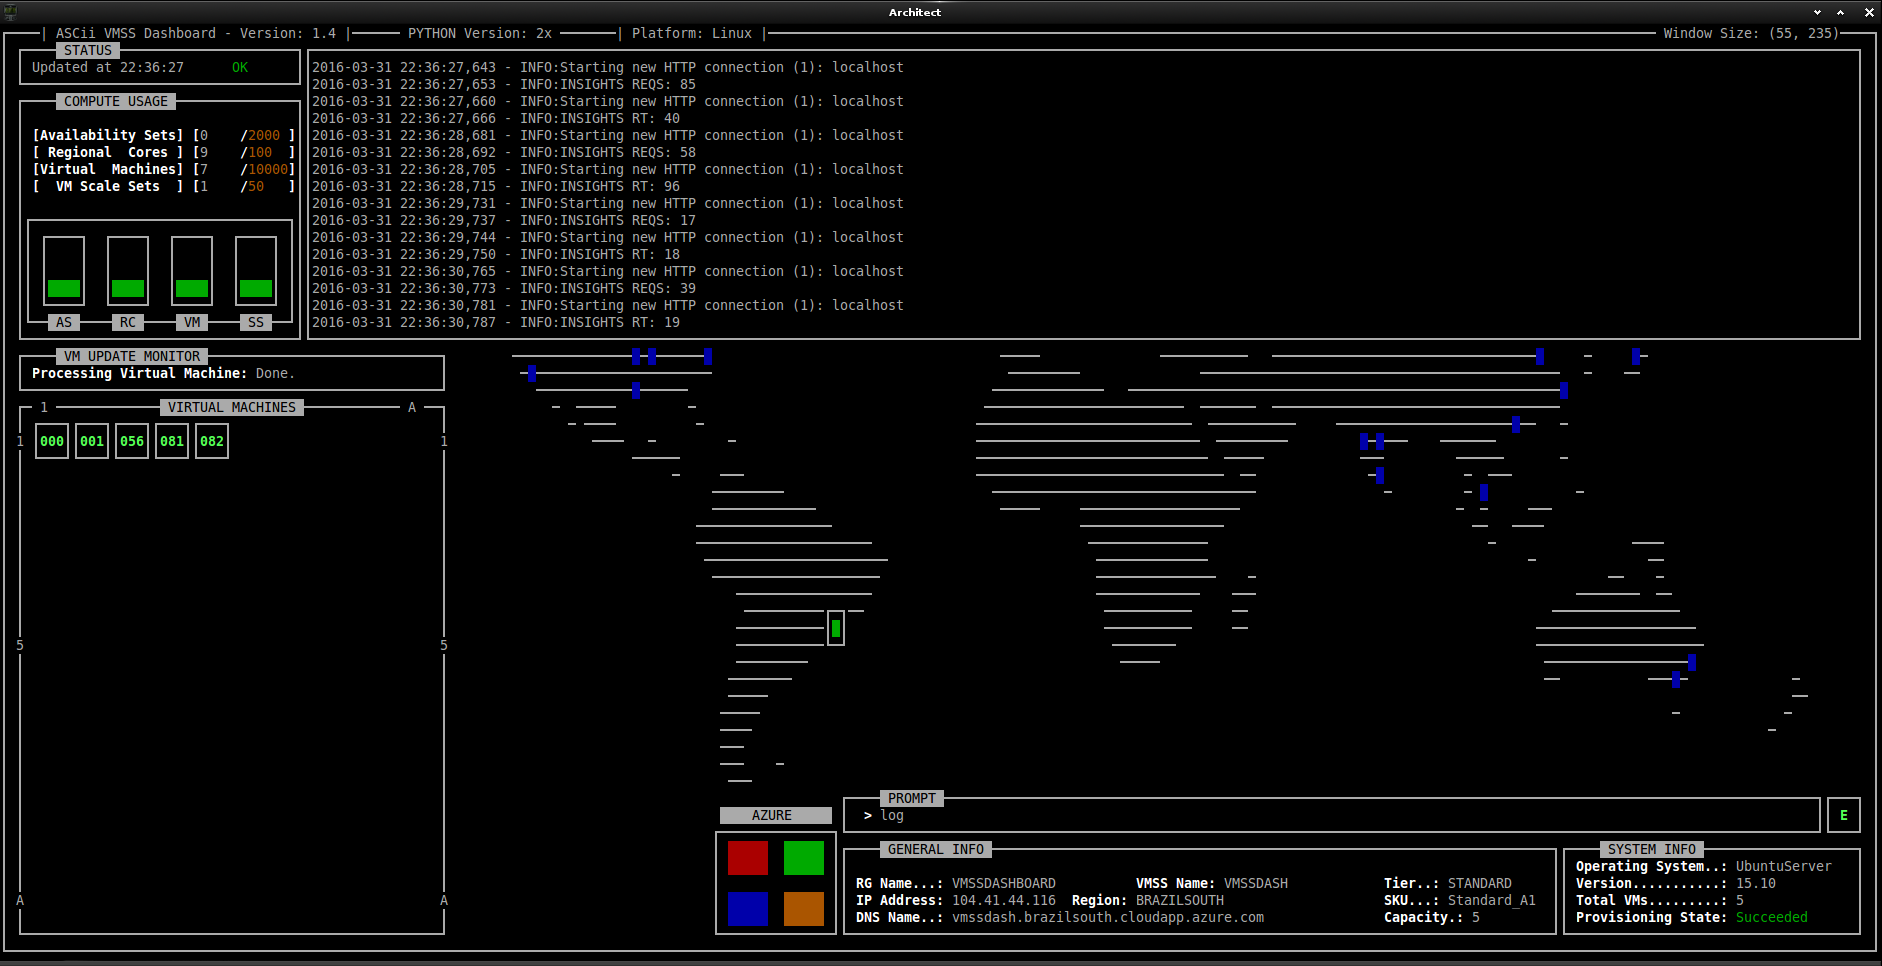
The Version 1.4 brings many new features and commands for the ASCiiVMSSDashboard utility. This version has an option to create a log file with many useful information that can be watched live directly in the ASCiiVMSSDashboard. It's very simple to display the log on the screen, just issue the command: 'log'. Using the console config file, you can set the log level (e.g.: INFO, DEBUG, and etc).
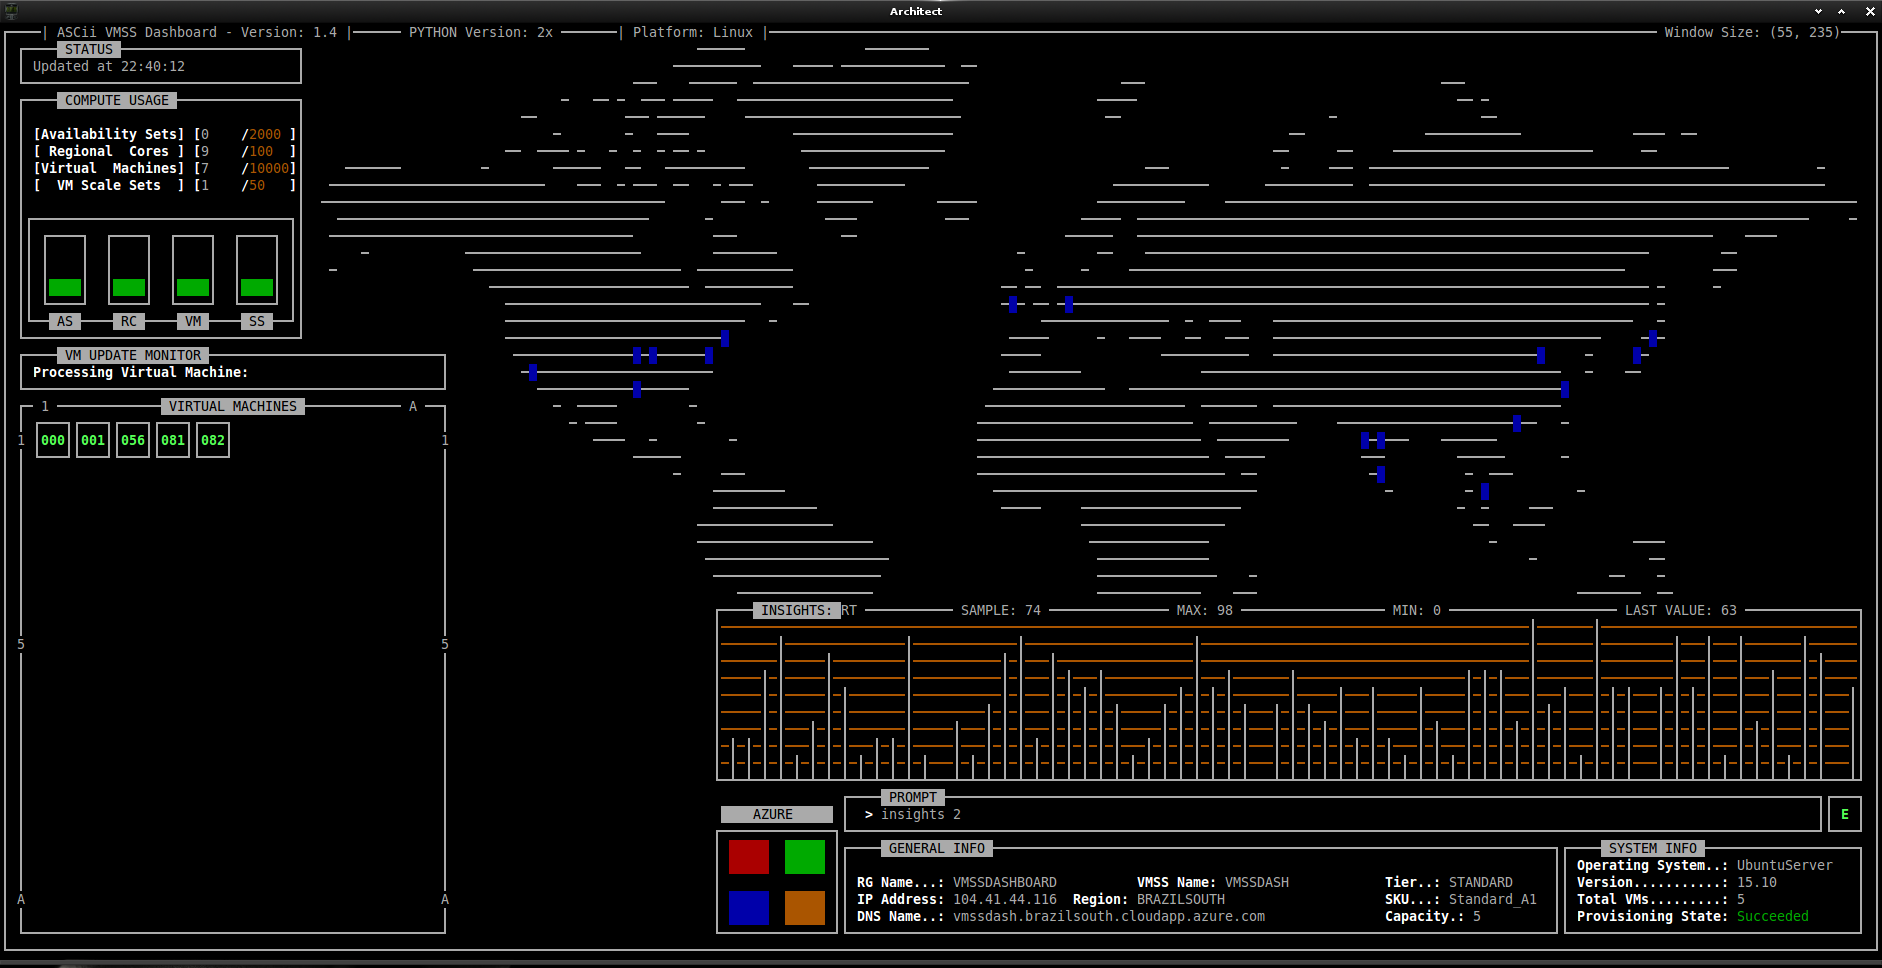
One of the key features of this new version of the ASCiiVMSSDashboard is the ability to see in real time two instrumentation graphs. You can eanble this feature on the asciivmssdashboard.json file, and set the title of the graph and the URL that the console will use to gather the metrics. The console will just do a HTTP GET on each URL and expect to receive an 'number' to plot on the graphs.
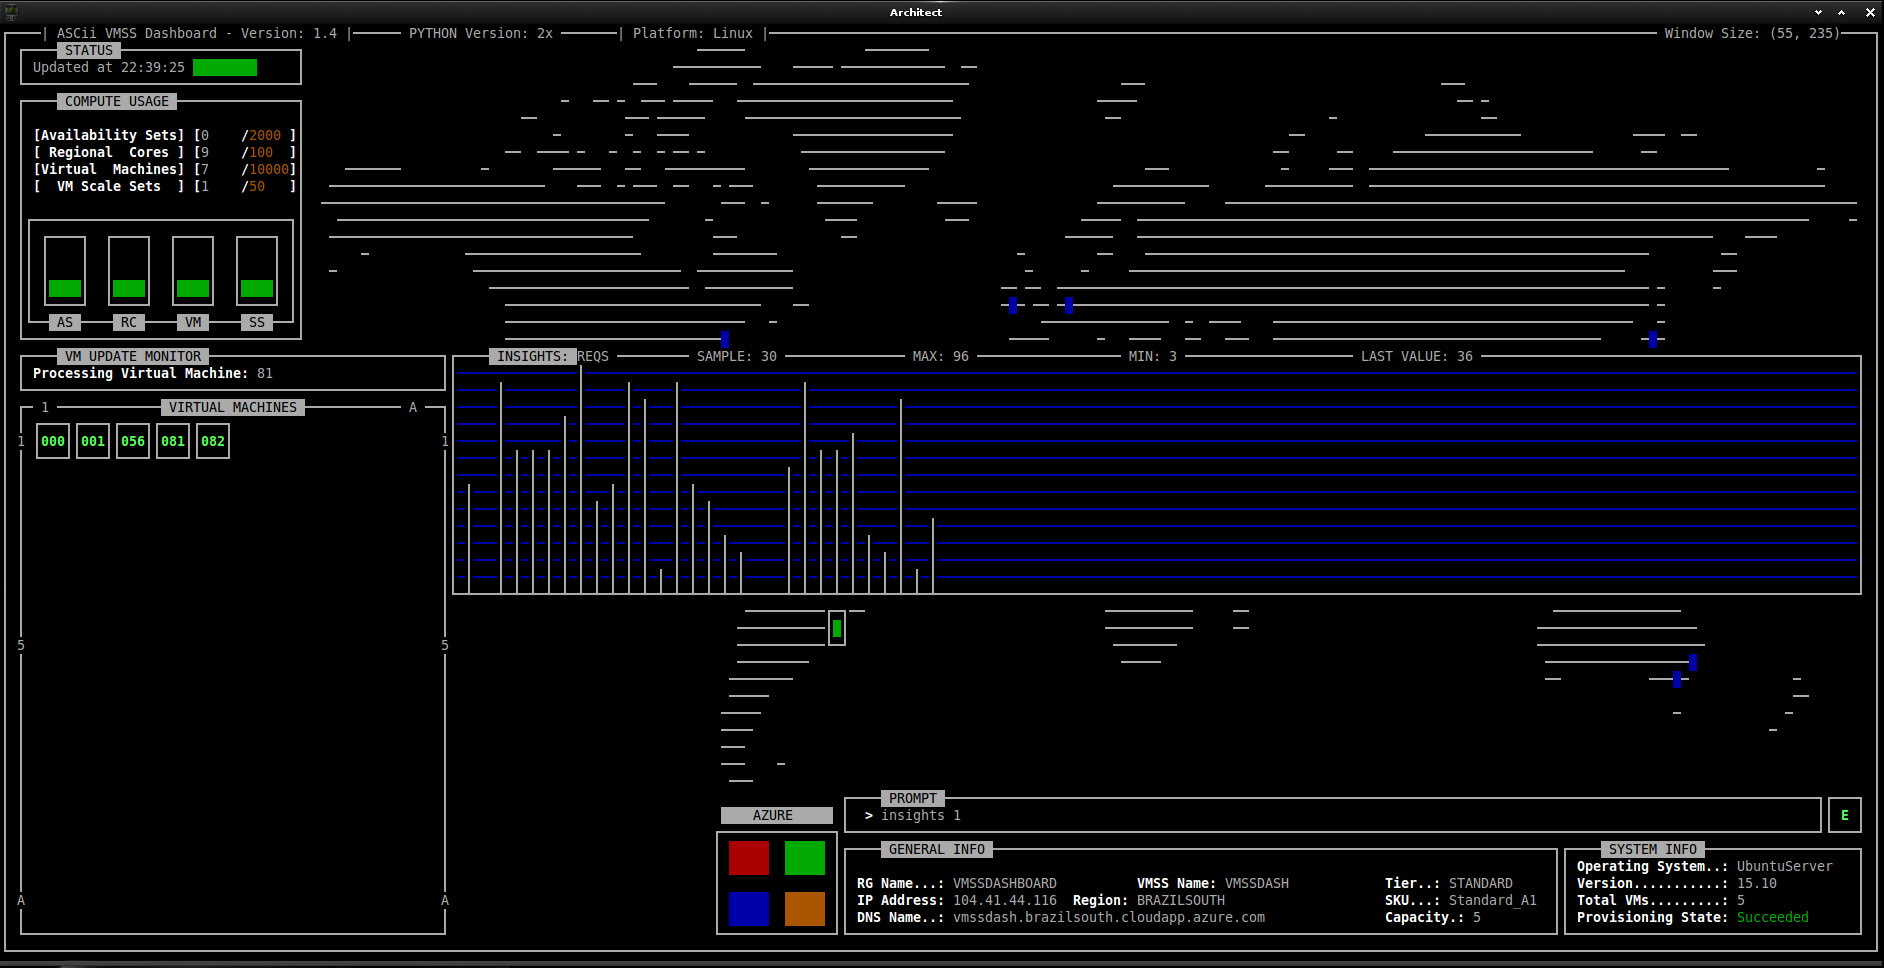
There is an option to enable one, two or disable both graphs. In the future I plan to integrate with the Azure Application Insights, and so we should be able to select any of the metrics configured on the platform. Stay tuned!
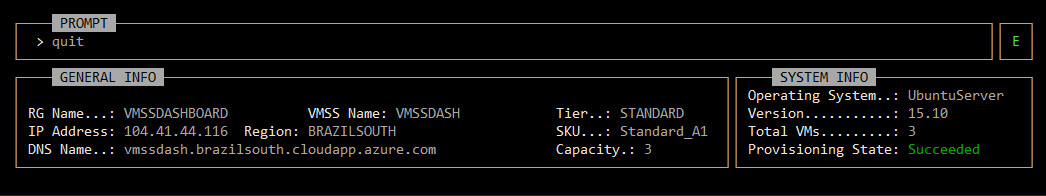
These are the PROMPT, General Info, and System Info windows:
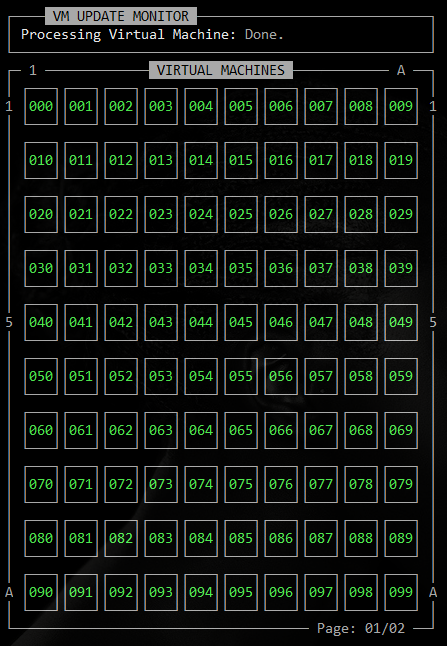
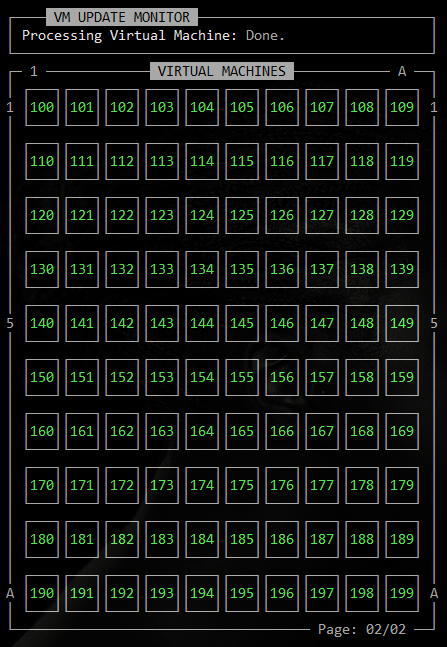
Multiple pages for visualization of all your Virtual Machines (each page shows 100 VM's). Here you can see a screenshot showing the first page:
Next, we can see the second page:
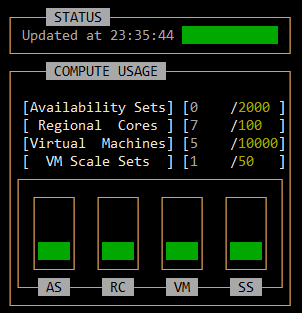
The console will show you your subscription/region usage and limits:
The ASCiiVMSSDashboard can run on Python 2.x or 3.x versions, and you will see the version it is running at the top title:

In case of any errors, you will be able to see the messages on the LOG Window, and also as a specific message in the main window:

###TIP #1: To not create the .pyc files, I use the following (on Linux): export TERM=screen; export PYTHONDONTWRITEBYTECODE=1; ./console.py. IMPORTANT: I use 'screen' terminal and it was the best emulation I found to run curses application. You can try other terminals that you have the best experience or compatibility in your system (e.g.: TERM=xterm, TERM=xterm-color, etc).
###TIP #2: I have used the console with no issues using a refresh interval of 60 seconds. If you use a more 'agressive' update interval, keep one eye at the last-update registered at the top-left of the dashboard window and/or in the log window (e.g.: 'log'), to see if the console is stil running. If you notice it stopped, you should see the 'ERROR' window described above, and the console should resume in 30 seconds. if the log has information about AZURE API 'throttling", you will need to restart the ASCiiVMSSDashboard (with a bigger inteval)...
###TIP #3: As we wait for the threads to finish as you hit 'Ctrl+C' or 'quit' (to exit), the time you will wait to get your prompt back will be proportional to you refresh interval (e.g.: max='INTERVAL'). You can change the update interval in the 'asciivmssdashboard.json' file.
ASCiiVMSSDashboard Commands
To issue commands for the Azure Resource Manager API to add and/or delete virtual machines from the Scale Set, you just need to type ':'. After that, the cursor will appear at (PROMPT window), and you will be able to enter commands. To see a help window just type ':' (to activate the command PROMPT), and 'help'. To hide the help window, just type 'help' again.
REMEMBER: To activate the prompt window, type: ':'
Commands (v1.4):
- add vm 'nr': Use this command to add virtual machines to your VMSS deployment.
- del vm 'nr': Use this command to delete virtual machines to your VMSS deployment.
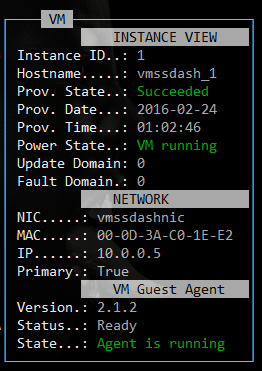
- select vm 'nr': Use this command to select a specific virtual machine on your VMSS deployment and see detailed info. You can select any Virtual Machine, and get specific details about it:
- deselect: Use this command to clear the selection of any specific virtual machine (and hide the VM details window).
- rg 'resourcegroupname' vmss 'vmscalesetname': Use this command to switch the visualization to another VM Scale Set.
- log: Use this command to show/hide a live log about the console executiong (e.g.: http requests, errors, and etc).
- insights 1: This command will show/hide the graph window for the first metric configured.
- insights 2: This command will show/hide the graph window for the second metric configured.
- debug: Use this command to show/hide all three windows (log, insights 1 and insights 2).
- quit 'or' exit: Use this command to exit the console (Any platform).
- Ctrl+c: Use this key combination to exit the ASCiiVMSSDashboard (Not working on windows for now).
- help: Use this command to get help about the dashboard commands (inside the ASCiiVMSSDashboard).
CAVEATS
- The 'stdscr.nodelay(1)' seems not to be multiplatform (at least does not work on Windows), and we are using it as a non-block function when reading user commands. For now, use the command 'quit' or 'exit' to end the dashboard on Windows. I'm looking for an alternative non-block call to use on windows and fix this.
- It would be nice to have any feedback of this program running on MacOS or any other platform...
##PDCURSES
- This application uses Unicurses: https://pypi.org/project/UniCurses, and a version of UniCurses (+pdcurses for Windows platform), already comes with asciivmssdashboard.
- If you have problems installing pdcurses on windows (not able to load uniCurses: import error), you can just add the DLL directly on the current directory of the ASCiiVMSSDashboard installation. To run the ASCiiVMSSDashboard on Windows, I have tested it just cloning the repo on Windows 10, and copying the 'pdcurses.dll' file to the cloned folder, and it runs without any issues (you still needs to have the UniCurses installed, but you have the Windows Installer link at the top of this README file).
Using ASCiiVMSSDashboard
To use this app (and in general to access Azure Resource Manager from a program without going through 2 factor authentication), you need to register your application with Azure and create a "Service Principal" (an application equivalent of a user). Once you've done this you'll have 3 pieces of information: A 'tenant ID', an 'application ID', and an 'application secret'. You will use these to populate the 'asciivmssdashboard.json' file.
For more information on how to get this information go here: Authenticating a service principal with Azure Resource Manager. See also: Azure Resource Manager REST calls from Python.
Using Application Insights Telemetry Data
If you want to have integrated graphs on the ASCiiVMSSDashboard directly from Azure Application Insights, you should follow the steps described here: App Insights I and App Insights II.
Example JSON:
    {
      "value": {
          "request/totalCount": {
              "values": "30"
          }
      }
    }
