Ansible Role Linux Prometheus Save
Ansible role for install and configure standalone or distributed Prometheus v2 with long term storage capabilities on Linux operating system.
![]()
Please note that the original design goal of this role was more concerned with the initial installation and bootstrapping environment, which currently does not involve performing continuous maintenance, and therefore are only suitable for testing and development purposes, should not be used in production environments. The author does not guarantee the accuracy, completeness, reliability, and availability of the role content. Under no circumstances will the author be held responsible or liable in any way for any claims, damages, losses, expenses, costs or liabilities whatsoever, including, without limitation, any direct or indirect damages for loss of profits, business interruption or loss of information.
请注意,此角色的最初设计目标更关注初始安装和引导环境,目前不涉及执行连续维护,因此仅适用于测试和开发目的,不应在生产环境中使用。作者不对角色内容之准确性、完整性、可靠性、可用性做保证。在任何情况下,作者均不对任何索赔,损害,损失,费用,成本或负债承担任何责任,包括但不限于因利润损失,业务中断或信息丢失而造成的任何直接或间接损害。
![]()
Table of Contents
- Introduction
- Overview
- Data Model
- Exposition format
- Alerting
- Visualization
- Architecture
- Components
- Basic exporters
- Requirements
- Role variables
- Dependencies
- Example Playbook
- License
- Author Information
- Donations
Introduction
What Is Monitoring?
Systems monitoring toolkit wasn’t built to do any of all things. It was built to aid software developers and administrators in the operation of production computer systems, such as the operating system, applications, databases and networks backing popular websites.
What is monitoring in that context?
Alerting
Knowing when things are going wrong is usually the most important thing that you want monitoring for. You want the monitoring system to call in a human to take a look.
Debugging
Now that you have called in a human, they need to investigate to determine the root cause and ultimately resolve whatever the issue is.
Trending
Alerting and debugging usually happen on time scales on the order of minutes to hours. While less urgent, the ability to see how your systems are being used and changing over time is also useful. Trending can feed into design decisions and processes such as capacity planning.
Plumbing
When all you have is a hammer, everything starts to look like a nail. At the end of the day, all monitoring systems are data processing pipelines. Sometimes it is more convenient to the appropriate part of your monitoring system for another purpose, rather than building a bespoke solution. This is not strictly monitoring, but it is common in practice.
Overview
Prometheus is an open-source system monitoring and alerting toolkit that focuses on capturing measurements and exposing them via an API. Works very well in a distributed, cloud-native environment, making it ideal for mission-critical microservices applications.
Prometheus is performant and simple to run, A single Prometheus server can ingest millions of samples per second. All of the services are unburdened by a load on the monitoring system. It is a single statically linked binary with a configuration file. All components of Prometheus can be run in containers, and they avoid doing anything fancy that would get in the way of configuration management tools. It is designed to be integrated into the infrastructure you already have and built on top of, not to be a management platform itself.
Since its inception in 2012, many companies and organizations have adopted Prometheus, and the project has a very active developer and user community. It is now a standalone open source project and maintained independently of any company. To emphasize this, and to clarify the project's governance structure, Prometheus joined the Cloud Native Computing Foundation in 2016, the second hosting project after Kubernetes.
As a metrics-based system, Prometheus is not suitable for storing event logs or individual events. Nor is it the best choice for high cardinality data, such as email address or username.
Prometheus is designed for operational monitoring, where small inaccuracies and race conditions due to factors like kernel scheduling and failed scrapes are a fact of life. Prometheus makes tradeoffs and prefers giving you data that is 99.9% correct over your monitoring breaking while waiting for perfect data. Thus in applications involving money or billing, Prometheus should be used with caution.
Data Model
All of the data is stored as a time series. A measurement with a timestamp. Measurements are known as metrics. Each time series is uniquely identified by a metric name and a set of key-value pairs, a.k.a. labels. This means that labels represent multiple dimensions of a metric. A combination of a metric name and a label yields a single metric. In other words, each time you create a new key-value pair on a metric you will get a new time-series in the database. An observation (they call it a sample!) is a combination of a float64 value and a millisecond precision timestamp.
Exposition format
When you look at the exposition format example below, you will notice that the first metric has the name node_cpu_seconds_total, a value 646836.5, and a set of labels inside curly braces {cpu="0",mode="idle"}. Labels can be omitted entirely together with the curly braces. They are separated by a single comma. The label value can be any UTF-8 string. Labels are very useful for compartmentalizing information, doing joins, and other useful stuff that we’ll mention later.
node_cpu_seconds_total{cpu="0",mode="idle"} 646836.5
node_cpu_seconds_total{cpu="0",mode="iowait"} 169.32
node_cpu_seconds_total{cpu="0",mode="irq"} 0
node_cpu_seconds_total{cpu="0",mode="nice"} 975.52
node_cpu_seconds_total{cpu="0",mode="softirq"} 863.66
node_cpu_seconds_total{cpu="0",mode="steal"} 0
node_cpu_seconds_total{cpu="0",mode="system"} 5581.2
node_cpu_seconds_total{cpu="0",mode="user"} 22442.72
Alerting
The Alertmanager receives alerts from Prometheus servers and turns them into notifications. Notifications can include email, chat applications such as WeChat. The Alertmanager does more than blindly turn alerts into notifications on a one-to-one basis. Related alerts can be aggregated into one notification, throttled to reduce message storms, and different routing and notification outputs can be configured for each of your different teams. Alerts can also be silenced, perhaps to snooze an issue you are already aware of in advance when you know maintenance is scheduled.
Visualization
It is recommended that you use Grafana for dashboards. It has a wide variety of features, including official support for Prometheus as a data source. It can produce a wide variety of dashboards.
Service discovery
Prometheus offers a variety of service discovery options for discovering scrape targets, including Kubernetes, Consul, Azure VMs, AWS EC2, etc.
High availability & Distributed
Even a single Prometheus server provides enough scalability, But at a certain cluster scale, problems arise that go beyond the capabilities of a vanilla Prometheus. Prometheus encourages a functional sharding approach, With the help of third party components, Prometheus can achieve High availability, Distributed, Global query and de-duplicated view, Reliable historical data storage, Compaction and Downsampling. also simplifies maintenance, cost and system design.
Architecture
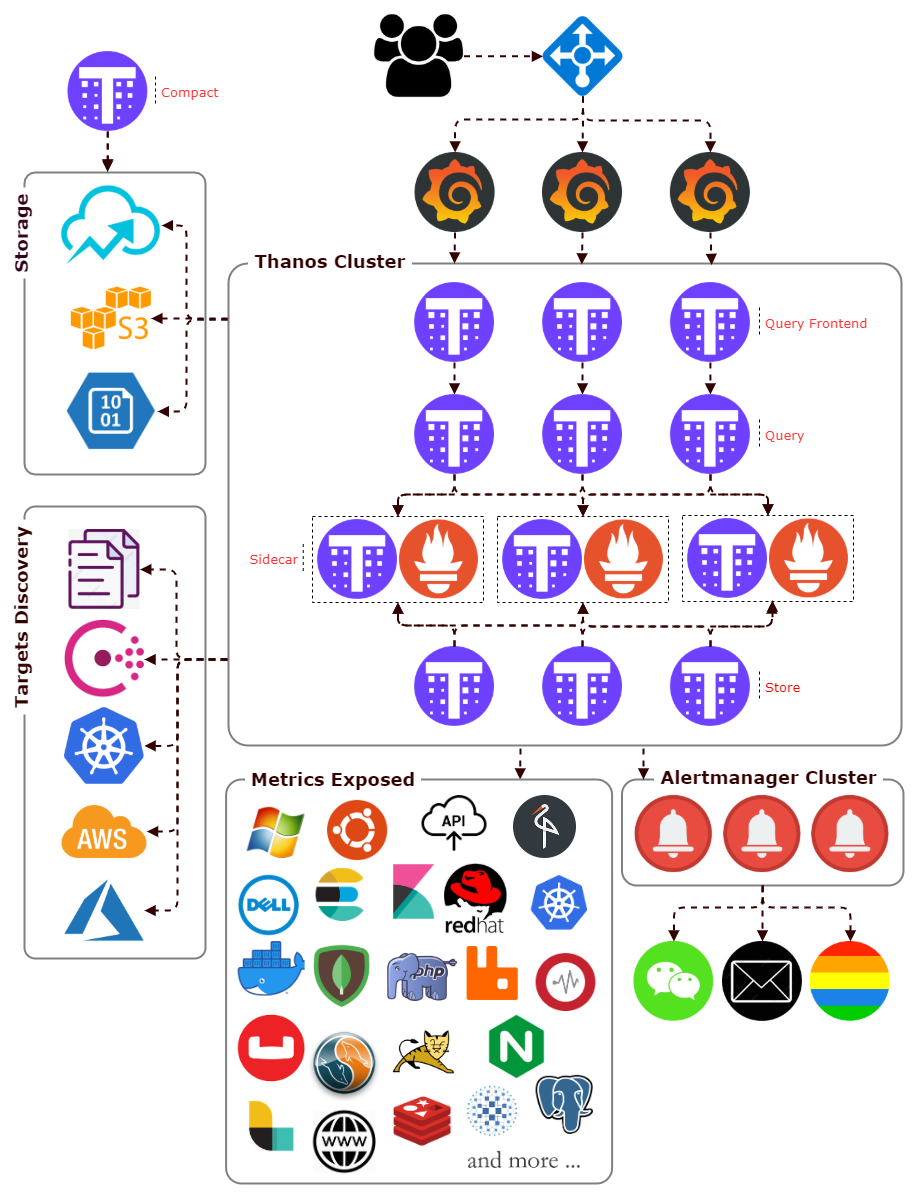
Components
Exporters
An exporter is a piece of software that you deploy right beside the application you want to obtain metrics from. It takes in requests from Prometheus, gathers the required data from the application, transforms them into the correct format, and finally returns them in a response to Prometheus.
Thanos Query
The Query component is stateless and horizontally scalable and can be deployed with any number of replicas. Once connected to the Sidecars, it automatically detects which Prometheus servers need to be contacted for a given PromQL query. Also capable of deduplicating data collected from Prometheus distributed.
Thanos Query Frontend
The thanos query frontend component implements a service that can be put in front of Thanos Queriers to improve the read path.
Thanos Sidecar
Sidecar is to backup Prometheus data into an Object Storage bucket, and giving other Thanos components access to the Prometheus instance the Sidecar is attached to.
Thanos Store (optional)
As the sidecar backs up data into the object storage of your choice, you can decrease Prometheus retention and store less locally. It can find in your object storage bucket.
Thanos Compact (optional)
The compact component simply scans the object storage and processes compaction where required. At the same time, it is responsible for creating downsampled copies of data to speed up queries.
Thanos Bucket (optional)
The bucket component is a set of commands to inspect data in object storage buckets. It is normally run as a stand-alone command to aid with troubleshooting.
Consul
Consul is a distributed, highly available, and data center aware solution to connect and configure applications across dynamic, distributed infrastructure. Prometheus has integrations with consul as service discovery mechanisms.
Object Storage (optional)
Offer a clustered storage solution to Long-Term Storage data across multiple machines, support Google Cloud Storage / AWS S3 / Azure Storage Account / etc.
Basic exporters that we use
Node exporter
Installed on the Linux operation machine. Exports statistics about network, I/O, CPU, memory, filesystems for hardware and OS metrics by kernels.
WMI exporter
Using the Windows Management Instrumentation for Windows machines.
cAdvisor
Exposes CPU, memory, network and I/O usage from containers.
Various kinds of DataBase exporter
Collection methods are supported on MySQL/MariaDB, PostgreSQL and MongoDB.
JMX exporter
Export from a wide variety of JVM-based applications, for example Zookeeper and Tomcat.
Other monitoring systems
Some of these exporters are maintained as part of the official Prometheus GitHub organization, those are marked as official, others are externally contributed and maintained.
Requirements
Operating systems
This Ansible role installs standalone or distributed Prometheus v2 server on the Linux operating system, including establishing a filesystem structure and server configuration with some common operational features, Will work on the following operating systems:
- CentOS 7
Prometheus versions
The following list of supported the Prometheus releases:
- Prometheus v2 final
Distributed mode
- Targets will be dispersed if greater than 3 Prometheus nodes.
- Use the last digit of the IP Address or host number to spread the load between multiple Prometheus nodes.
Performance is severely affected by remote reading and deduplicating data queries, Thanos store components + object storage offers only if need long term storage.
for example:
    node01: - source_labels: [__address__]
              regex: .+[02468]:.+
              action: drop
    node02: - source_labels: [__address__]
              regex: .+[13579]:.+
              action: drop
    node03: - source_labels: [__address__]
              regex: .+[02468]:.+
              action: drop
    node04: - source_labels: [__address__]
              regex: .+[13579]:.+
              action: drop
Role variables
Main parameters
There are some variables in defaults/main.yml which can (Or needs to) be overridden:
General parameters
-
thanos_is_install: A boolean to determine whether or not to install the Thanos. -
thanos_bucket_is_used: A boolean to determine whether or not to use object storage. -
prometheus_data_path: Specify the Prometheus configure directory. -
prometheus_alert_incident_levels_map: Defines the display mode of incident alarm, severity or priority. -
prometheus_external_labels: The global labels to time series or alerts when communicating with external systems.
Consul SD configurations
-
prometheus_consul_server: The consul address and port. -
prometheus_consul_token: The consul acl token.
Kubernetes SD configurations
-
prometheus_kubernetes: The Kubernetes API server information.
Azure Monitor Metric configurations
-
prometheus_azure_monitor: The Azure credentials.
Role dependencies
-
prometheus_grafana_dept: A boolean to determine whether or not to install the Grafana for metrics visualization. -
prometheus_grafana_ngx_dept: A boolean to determine whether or not to proxy Grafana web interface using NGinx.
Listen port
-
prometheus_port.alertmanager: alertmanager instance listen port. -
prometheus_port.cluster: alertmanager cluster listen port. -
prometheus_port.prometheus: Prometheus instance listen port. -
thanos_port.compact_http: Port for compact HTTP endpoints. -
thanos_port.query_grpc: Port for query gRPC endpoints. -
thanos_port.query_http: Port for query HTTP endpoints. -
thanos_port.sidecar_grpc: Port for sidecar gRPC endpoints. -
thanos_port.sidecar_http: Port for sidecar HTTP endpoints. -
thanos_port.store_grpc: Port for store gRPC endpoints. -
thanos_port.store_http: Port for store HTTP endpoints.
Grafana parameters
-
prometheus_grafana_path: Specify the Grafana data directory. -
prometheus_grafana_version: Specify the Grafana version. -
prometheus_grafana_admin_user: The name of the default Grafana admin user. -
prometheus_grafana_admin_password: The password of the default Grafana admin. -
prometheus_grafana_https: A boolean to determine whether or not to Encrypting HTTP client communications. -
prometheus_grafana_port: Grafana instance listen port. -
prometheus_grafana_proxy: Whether running behind a HaProxy. -
prometheus_grafana_ngx_domain: Defines domain name. -
prometheus_grafana_ngx_port_http: NGinx HTTP listen port. -
prometheus_grafana_ngx_port_https: NGinx HTTPs listen port.
Prometheus System Variables
-
prometheus_arg.evaluation_interval: How frequently to evaluate rules. -
prometheus_arg.query_max_concurrency: Maximum number of queries executed concurrently. -
prometheus_arg.refresh_interval: Refresh interval to re-read the instance list. -
prometheus_arg.scrape_interval: How frequently to scrape targets from this job. -
prometheus_arg.scrape_timeout: How long until a scrape request times out. -
prometheus_arg.storage_tsdb_block_duration: Must be set to equal values to disable local compaction. -
prometheus_arg.storage_tsdb_retention: How long to retain samples in storage. -
prometheus_arg.ulimit_core: The number of coredump launched by systemd. -
prometheus_arg.ulimit_memlock: The number of memory lock launched by systemd. -
prometheus_arg.ulimit_nofile: The number of files launched by systemd. -
prometheus_arg.ulimit_nproc: The number of processes launched by systemd.
Prober Exporter Variables
-
prometheus_prober_arg: Prober configuration.
Alertmanager System Variables
-
alertmanager_arg.group_by: They are grouped by alertname. -
alertmanager_arg.group_wait: How long to initially wait to send a notification for a group of alerts. -
alertmanager_arg.group_interval: How long to wait before sending a notification about new alerts that are added to a group. -
alertmanager_arg.repeat_interval: How long to wait before sending a notification again if it has already been sent successfully for an alert. -
alertmanager_arg.smtp: Define mail parameters. -
alertmanager_arg.wechat: Define wechat parameters. -
alertmanager_arg.webhook: Define webhook parameters.
Alertmanager rules
-
prometheus_alert_rules: Defining alerting rules.
Thanos System Variables
-
thanos_arg.chunk_pool_size: Maximum size of concurrently allocatable bytes for chunks. -
thanos_arg.index_cache_size: Maximum size of items held in the index cache. -
thanos_arg.log_format: Log format. -
thanos_arg.log_level: Log level. -
thanos_arg.max_size: Maximum memory size of the cache in bytes. -
thanos_arg.query_auto_downsampling: Enable automatic adjustment source data. -
thanos_arg.query_max_concurrent: Maximum number of queries processed concurrently. -
thanos_arg.query_timeout: Maximum time to process query. -
thanos_arg.ulimit_core: The number of coredump launched by systemd. -
thanos_arg.ulimit_memlock: The number of memory lock launched by systemd. -
thanos_arg.ulimit_nofile: The number of files launched by systemd. -
thanos_arg.ulimit_nproc: The number of processes launched by systemd.
Thanos objstore Variables
-
thanos_obj_arg: Defines Object Storage implementation configurations.
Service Mesh
-
environments: Define the service environment. -
datacenter: Define the DataCenter. -
domain: Define the Domain. -
customer: Define the customer name. -
tags: Define the service custom label. -
exporter_is_install: Whether to install prometheus exporter. -
consul_public_register: Whether register a exporter service with public consul client. -
consul_public_exporter_token: Public Consul client ACL token. -
consul_public_http_prot: The consul Hypertext Transfer Protocol. -
consul_public_clients: List of public consul clients. -
consul_public_http_port: The consul HTTP API port.
Other parameters
There are some variables in vars/main.yml:
Dependencies
Example
Hosts inventory file
See tests/inventory for an example, all host must belong to one child group.
[Monitor]
node01 ansible_host='192.168.1.10'
node02 ansible_host='192.168.1.11'
node03 ansible_host='192.168.1.12'

[Monitor:vars]
thanos_is_install=true
prometheus_consul_server='consul.service.dc01.local:8500'
prometheus_consul_token='7471828c-d50a-4b25-b6a5-xxxxxxxxxxxx'
Combination of group vars and playbook
You can also use the group_vars or the host_vars files for setting the variables needed for this role. File you should change: group_vars/all or host_vars/group_name.
prometheus_data_path: '/data'
thanos_is_install: true
thanos_bucket_is_used: true
prometheus_alert_incident_levels_map: 'severity'
prometheus_external_labels:
  geography: 'China'
  region: 'chinaeast2'
prometheus_consul_server: 'consul.service.dc01.local:8500'
prometheus_consul_token: '7471828c-d50a-4b25-b6a5-xxxxxxxxxxxx'
prometheus_kubernetes:
  - apiserver: 'demo-prd-infra-operator-k8s.service.dc01.local:6443'
    token: 'xxxxxxxxxxxxxxxxxxxxxxxxxxxxxxxxxxxxxxxxxxxxxxxx'
    node_discover:
      enable: true
    pod_discover:
      enable: false
      scheme: 'http'
      port: '8080'
      metrics_path: 'prometheus'
  - apiserver: 'demo-dev-infra-operator-k8s.service.dc01.local:6443'
    token: 'xxxxxxxxxxxxxxxxxxxxxxxxxxxxxxxxxxxxxxxxxxxxxxxx'
    node_discover:
      enable: true
    pod_discover:
      enable: false
      scheme: 'http'
      port: '8080'
      metrics_path: 'prometheus'
prometheus_azure_monitor:
  tenant_id: 'a4fa8873-af02-4d7c-8198-684e93c5d8c6'
  client_id: 'c1fa72cf-1582-4a7c-8ec9-50b116d5a7de'
  client_secret: 'cb67f3f9-1794-49ae-9e51-ce2789be12c4'
  environment: 'AzureChinaCloud'
  subscription:
    - '1d290a0f-003d-4cb8-b504-d4285346506e'
    - '2ea31cc2-f994-417a-af84-9a4d7aa492cb'
  resources:
    - 'Microsoft.Cache/Redis'
    - 'Microsoft.DBforMySQL/servers'
    - 'Microsoft.DBforPostgreSQL/servers'
    - 'microsoft.network/virtualnetworkgateways'
    - 'Microsoft.Sql/managedInstances'
    - 'Microsoft.Sql/servers/elasticPools'
    - 'Microsoft.Storage/storageAccounts'
prometheus_grafana_dept: true
prometheus_grafana_ngx_dept: true
prometheus_port:
  alertmanager: '9093'
  blackbox: '9115'
  cluster: '9094'
  prometheus: '9090'
  pushgateway: '9091'
  smokeping: '9374'
  snmp: '9116'
thanos_port:
  bucket_http: '19195'
  compact_http: '19194'
  query_frontend_http: '19190'
  query_grpc: '19092'
  query_http: '19192'
  sidecar_grpc: '19091'
  sidecar_http: '19191'
  store_grpc: '19093'
  store_http: '19193'
prometheus_grafana_path: '/data'
prometheus_grafana_version: '6.7.6'
prometheus_grafana_admin_user: 'admin'
prometheus_grafana_admin_password: 'changeme'
prometheus_grafana_https: true
prometheus_grafana_port: '3000'
prometheus_grafana_proxy: false
prometheus_grafana_ngx_domain: 'visual.example.com'
prometheus_grafana_ngx_port_http: '80'
prometheus_grafana_ngx_port_https: '443'
prometheus_arg:
  evaluation_interval: '30s'
  query_max_concurrency: '1024'
  refresh_interval: '60s'
  scrape_interval: '60s'
  scrape_timeout: '10s'
  storage_tsdb_block_duration: '2h'
  storage_tsdb_retention: '30d'
  ulimit_core: 'infinity'
  ulimit_memlock: 'infinity'
  ulimit_nofile: '262144'
  ulimit_nproc: '262144'
prometheus_prober_arg:
  smokeping_hosts:
    - '223.5.5.5'
    - '119.29.29.29'
alertmanager_arg:
  timezone: 'Local'
  group_by:
    - 'alertname'
    - 'cluster'
    - 'service'
  group_wait: '60s'
  group_interval: '60s'
  repeat_interval: '2h'
  smtp:
    enable: true
    auth_password: 'changeme'
    auth_username: 'user'
    require_tls: false
    smarthost: '127.0.0.1:25'
    from: '[email protected]'
    apps:
      - name: 'xxx:''
        recipients: '[email protected]'
        match:
          project: 'xx'
  wechat:
    enable: false
    corpid: 'wxe787605fxxxxxxxx'
    api_secret: 'fm6Ehm6DI8PlGWxtKcgkDOZCLMTsNqKqTxxxxxxxxxx'
    agentid: '0'
    apps:
      - name: 'infra'
        to_party: '6'
        matchers:
          severity: '~"p1|p2"'
  webhook:
    enable: false
    apps:
      - name: 'alerta'
        url: 'https://demo-prd-infra-monitor-alerta.service.dc01.local:7443/api/webhooks/prometheus?api-key=1i_3_J4G6pjqsVkwYy7ZRj7bsXCHMqFYXaIksEMq'
prometheus_alert_rules:
  - 'Consul'
  - 'ElasticSearch'
thanos_arg:
  chunk_pool_size: '2GB'
  index_cache_size: '1GB'
  log_format: 'logfmt'
  log_level: 'info'
  max_size: '256MB'
  query_auto_downsampling: false
  query_max_concurrent: '1024'
  query_timeout: '1m'
  ulimit_core: 'infinity'
  ulimit_memlock: 'infinity'
  ulimit_nofile: '262144'
  ulimit_nproc: '262144'
thanos_obj_arg:
  retention: '365'
  type: 'S3'
  bucket: 'thanos'
  endpoint: 'demo-prd-infra-storage-minio-thanos.service.dc01.local:9001'
  insecure: false
  signature_version2: false
  access_key: 'HYBBSS5EAC3RZEURZ3TQ'
  secret_key: '4AElW1GQ59GMxq5SgvWzpN6wiZUapQZiMyhpeaAj'
environments: 'prd'
datacenter: 'dc01'
domain: 'local'
customer: 'demo'
tags:
  subscription: 'default'
  owner: 'nobody'
  department: 'Infrastructure'
  organization: 'The Company'
  region: 'China'
exporter_is_install: false
consul_public_register: false
consul_public_exporter_token: '7471828c-d50a-4b25-b6a5-xxxxxxxxxxxx'
consul_public_http_prot: 'https'
consul_public_http_port: '8500'
consul_public_clients:
  - '127.0.0.1'
License
![]()
Author Information
Please send your suggestions to make this role better.
Donations
Please donate to the following monero address.
46CHVMbb6wQV2PJYEbahb353SYGqXhcdFQVEWdCnHb6JaR5125h3kNQ6bcqLye5G7UF7qz6xL9qHLDSAY3baagfmLZABz75

