AAChartKit Pro Save
📈📊🎓🎓🎓AAChartKit-Pro is a professional version of AAChartKit, it is an elegant and friendly chart framework for iOS, iPadOS, macOS. AAChartKit-Pro is a more powerful data visualization framework that supports more types beautiful chart like bellcurve, bullet, columnpyramid, cylinder, dependencywheel, heatmap, histogram, networkgraph, organization, packedbubble, pareto, sankey, series, solidgauge, streamgraph, sunburst, tilemap, timeline, treemap, variablepie, variwide, vector, venn, windbarb, wordcloud, xrange charts and so on.

AAChartKit-Pro
![]()
![]()
![]()
![]()
![]()


![]()
![]()
![]()
English Document 🇬🇧 | 简体中文文档 🇨🇳 | 繁體中文文檔 🇭🇰
The Swift version of AAChartKit can be found here:
https://github.com/AAChartModel/AAChartKit-Swift-Pro
Preface
AAChartKit-Pro is a professional version of AAChartKit, it is an elegant and friendly chart framework for iOS, iPadOS, tvOS, macOS. AAChartKit-Pro is a more powerful data visualization framework that supports more types beautiful chart like bellcurve, bullet, columnpyramid, cylinder, dependencywheel, heatmap, histogram, networkgraph, organization, packedbubble, pareto, sankey, series, solidgauge, streamgraph, sunburst, tilemap, timeline, treemap, variablepie, variwide, vector, venn, windbarb, wordcloud, xrange charts and so on. More chart types are planned to be supported. AAChartKit-Pro gives you easy and fast access to a wide range of chart types, hassle-free and quick to integrate into your own project.
Features
- 🎂 Support up from
iOS 8+,ARCsupport. - 🚀 Powerful and easy to use. It supports
column chart,bar chart,area chart,areaspline chart,line chart,spline chart,radar chart,polar chart,pie chart,bubble chart,pyramid chart,funnel chart,columnrange chart,arearange chart,mixed chartand other graphics. Support for more chart types is planned. - 🦋 The charts are interactive and animated. The
animationeffect is exquisite, delicate, smooth and beautiful. - ⛓. Supports
chain programming syntaxlike Masonry - 💑
AAChartView + AAChartModel = Chart. The AAChartKit follows a minimalist formula: Chart view + Chart model = The chart you want, just like the powerful and beautiful charts lib AAInfographics
Beauty Appreciation
| Column Chart | Column Range Chart | Area Chart |
|---|---|---|
 |
 |
 |
| Line Chart | Step Area Chart | Step Line Chart |
|---|---|---|
 |
 |
 |
| Spline Chart | Areaspline Chart | Stacked Polar Chart |
|---|---|---|
 |
 |
 |
| Bubble Chart | Arearange Average Value Chart | Column Mixed Line Chart |
|---|---|---|
 |
 |
 |
Usage
The required 'pre' work
-
Drag the
AAChartKitLibfolder into your project. -
Add the following to your
.pchfile.
#import "AAGlobalMacro.h"
The 'real' work
- Add the following to your view controller file:
#import "AAChartKit.h"
- Create an instance object of chart view:
AAChartView
CGFloat chartViewWidth  = self.view.frame.size.width;
CGFloat chartViewHeight = self.view.frame.size.height-250;
_aaChartView = [[AAChartView alloc]init];
_aaChartView.frame = CGRectMake(0, 60, chartViewWidth, chartViewHeight);
//_aaChartView.scrollEnabled = NO;
//// set the content height of aaChartView
// _aaChartView.contentHeight = chartViewHeight;
[self.view addSubview:_aaChartView];
- Configure the chart model properties:
AAChartModel
AAChartModel *aaChartModel= AAObject(AAChartModel)
.chartTypeSet(AAChartTypeColumn)
.titleSet(@"THE HEAT OF PROGRAMMING LANGUAGE")
.subtitleSet(@"Virtual Data")
.categoriesSet(@[@"Java",@"Swift",@"Python",@"Ruby", @"PHP",@"Go",@"C",@"C#",@"C++"])
.yAxisTitleSet(@"Degrees Celsius")
.seriesSet(@[
        AAObject(AASeriesElement)
        .nameSet(@"2017")
        .dataSet(@[@7.0, @6.9, @9.5, @14.5, @18.2, @21.5, @25.2, @26.5, @23.3, @18.3, @13.9, @9.6]),
        AAObject(AASeriesElement)
        .nameSet(@"2018")
        .dataSet(@[@0.2, @0.8, @5.7, @11.3, @17.0, @22.0, @24.8, @24.1, @20.1, @14.1, @8.6, @2.5]),
        AAObject(AASeriesElement)
        .nameSet(@"2019")
        .dataSet(@[@0.9, @0.6, @3.5, @8.4, @13.5, @17.0, @18.6, @17.9, @14.3, @9.0, @3.9, @1.0]),
        AAObject(AASeriesElement)
        .nameSet(@"2020")
        .dataSet(@[@3.9, @4.2, @5.7, @8.5, @11.9, @15.2, @17.0, @16.6, @14.2, @10.3, @6.6, @4.8]),
                 ])
;
- Draw the chart (this method is only called the first time you create an AAChartView instance object)
//The chart view object calls the instance object of AAChartModel and draws the final graphic
[_aaChartView aa_drawChartWithChartModel:aaChartModel];
🌹🌹🌹Congratulations! Everything was done!!! You will get what you want!!!🌈🌈🌈
Update chart content
if you want to refresh chart content,you should do something as follow.According to your actual needs, select the function that fits you.
- Refresh the chart data (this method is recommended for updating the series data dynamically)
//Refresh the chart dynamically only when the series attribute of the AAChartModel object is updated
[_aaChartView aa_onlyRefreshTheChartDataWithChartModelSeries:aaChartModelSeriesArray];
- Refresh the chart, minus the chart data (this method is recommended for subsequent refreshes after the first drawing of graphics has completed. If you want to update the chart data only, you should use the function
aa_onlyRefreshTheChartDataWithChartModelSeries)
//Refresh the chart after the AAChartModel content is updated
[_aaChartView aa_refreshChartWithChartModel:aaChartModel];
Samples


More graphics
- Note: The following
DEMO pictureis aGIF dynamic picturewhich has a size of around 6M. If you don't see any dynamic preview, then this is because the picture resources were not fully loaded. In such a case please be patient and wait for the contents to finish loading. Maybe you need to reload this page.

Special instructions
Special chart types in AAChartKit
The pie chart as well as the bubble chart are special in AAChartKit. If you want to draw these types of charts, you need to prepare the property series of AAChartModel differently:
- To draw a pie chart, you should configure the properties of
AAChartModellike this:
   AAChartModel *chartModel= AAObject(AAChartModel)
    .chartTypeSet(AAChartTypePie)
    .titleSet(@"THE HEAT OF PROGRAMMING LANGUAGE")
    .subtitleSet(@"Virtual Data")
    .yAxisTitleSet(@"Degrees Celsius")
    .seriesSet(
               @[AAObject(AASeriesElement)
                 .nameSet(@"Percent")
                 .dataSet(@[
                            @[@"Java"  , @67],
                            @[@"Swift" , @44],
                            @[@"Python", @83],
                            @[@"OC"    , @11],
                            @[@"Ruby"  , @42],
                            @[@"PHP"   , @31],
                            @[@"Go"    , @63],
                            @[@"C"     , @24],
                            @[@"C#"    , @888],
                            @[@"C++"   , @66],
                            ]),
                 ]

               )
    ;
- To draw a bubble chart, you should configure the properties of
AAChartModellike this:
   AAChartModel *chartModel= AAObject(AAChartModel)
    .chartTypeSet(AAChartTypeBubble)
    .titleSet(@"THE HEAT OF PROGRAMMING LANGUAGE")
    .subtitleSet(@"Virtual Data")
    .yAxisTitleSet(@"Degrees Celsius")
    .seriesSet(
               @[
                 AAObject(AASeriesElement)
                 .nameSet(@"2017")
                 .dataSet(
                          @[
                            @[@97, @36, @79],
                            @[@94, @74, @60],
                            @[@68, @76, @58],
                            @[@64, @87, @56],
                            @[@68, @27, @73],
                            @[@74, @99, @42],
                            @[@7,  @93, @87],
                            @[@51, @69, @40],
                            @[@38, @23, @33],
                            @[@57, @86, @31]
                            ]),

                 AAObject(AASeriesElement)
                 .nameSet(@"2018")
                 .dataSet(
                          @[
                            @[@25, @10, @87],
                            @[@2,  @75, @59],
                            @[@11, @54, @8 ],
                            @[@86, @55, @93],
                            @[@5,  @3,  @58],
                            @[@90, @63, @44],
                            @[@91, @33, @17],
                            @[@97, @3,  @56],
                            @[@15, @67, @48],
                            @[@54, @25, @81]
                            ]),

                 AAObject(AASeriesElement)
                 .nameSet(@"2019")
                 .dataSet(
                          @[
                            @[@47, @47, @21],
                            @[@20, @12, @4 ],
                            @[@6,  @76, @91],
                            @[@38, @30, @60],
                            @[@57, @98, @64],
                            @[@61, @17, @80],
                            @[@83, @60, @13],
                            @[@67, @78, @75],
                            @[@64, @12, @10],
                            @[@30, @77, @82]
                            ]),

                 ]
               )
    ;
Supported chart types for now
typedef NSString *AAChartType;

AACHARTKIT_EXTERN AAChartType const AAChartTypeColumn;          //column chart
AACHARTKIT_EXTERN AAChartType const AAChartTypeBar;             //bar chart
AACHARTKIT_EXTERN AAChartType const AAChartTypeArea;            //area chart
AACHARTKIT_EXTERN AAChartType const AAChartTypeAreaspline;      //area spline chart
AACHARTKIT_EXTERN AAChartType const AAChartTypeLine;            //line chart
AACHARTKIT_EXTERN AAChartType const AAChartTypeSpline;          //spline chart
AACHARTKIT_EXTERN AAChartType const AAChartTypeScatter;         //scatter chart
AACHARTKIT_EXTERN AAChartType const AAChartTypePie;             //pie chart
AACHARTKIT_EXTERN AAChartType const AAChartTypeBubble;          //bubble chart
AACHARTKIT_EXTERN AAChartType const AAChartTypePyramid;         //pyramid chart
AACHARTKIT_EXTERN AAChartType const AAChartTypeFunnel;          //funnel chart
AACHARTKIT_EXTERN AAChartType const AAChartTypeColumnrange;     //column range chart
AACHARTKIT_EXTERN AAChartType const AAChartTypeArearange;       //area range chart
AACHARTKIT_EXTERN AAChartType const AAChartTypeAreasplinerange; //area spline range chart
AACHARTKIT_EXTERN AAChartType const AAChartTypeBoxplot;         //box plot chart
AACHARTKIT_EXTERN AAChartType const AAChartTypeWaterfall;       //Waterfall chart
AACHARTKIT_EXTERN AAChartType const AAChartTypePolygon;         //polygon chart
Supported zoom guesture types for now
typedef NSString *AAChartZoomType;

AACHARTKIT_EXTERN AAChartZoomType const AAChartZoomTypeNone;
AACHARTKIT_EXTERN AAChartZoomType const AAChartZoomTypeX;
AACHARTKIT_EXTERN AAChartZoomType const AAChartZoomTypeY;
AACHARTKIT_EXTERN AAChartZoomType const AAChartZoomTypeXY;
Supported animation types for now
typedef NS_ENUM(NSInteger,AAChartAnimation) {
    AAChartAnimationLinear = 0,
    AAChartAnimationEaseInQuad,
    AAChartAnimationEaseOutQuad,
    AAChartAnimationEaseInOutQuad,
    AAChartAnimationEaseInCubic,
    AAChartAnimationEaseOutCubic,
    AAChartAnimationEaseInOutCubic,
    AAChartAnimationEaseInQuart,
    AAChartAnimationEaseOutQuart,
    AAChartAnimationEaseInOutQuart,
    AAChartAnimationEaseInQuint,
    AAChartAnimationEaseOutQuint,
    AAChartAnimationEaseInOutQuint,
    AAChartAnimationEaseInSine,
    AAChartAnimationEaseOutSine,
    AAChartAnimationEaseInOutSine,
    AAChartAnimationEaseInExpo,
    AAChartAnimationEaseOutExpo,
    AAChartAnimationEaseInOutExpo,
    AAChartAnimationEaseInCirc,
    AAChartAnimationEaseOutCirc,
    AAChartAnimationEaseInOutCirc,
    AAChartAnimationEaseOutBounce,
    AAChartAnimationEaseInBack,
    AAChartAnimationEaseOutBack,
    AAChartAnimationEaseInOutBack,
    AAChartAnimationElastic,
    AAChartAnimationSwingFromTo,
    AAChartAnimationSwingFrom,
    AAChartAnimationSwingTo,
    AAChartAnimationBounce,
    AAChartAnimationBouncePast,
    AAChartAnimationEaseFromTo,
    AAChartAnimationEaseFrom,
    AAChartAnimationEaseTo,
};
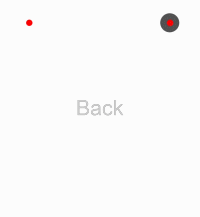
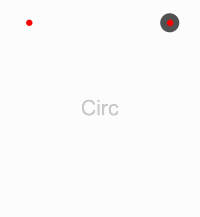
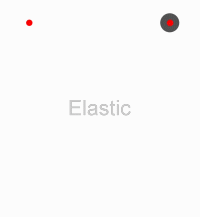
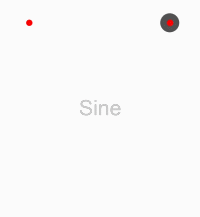
Here are the ten concrete animation types of AAChartKit
| Back | Bounce | Circ | Cubic | Elastic |
|---|---|---|---|---|
 |
 |
 |
 |
 |
| Expo | Quad | Quart | Quint | Sine |
|---|---|---|---|---|
 |
 |
 |
 |
 |
AAChartModel:chart attribute list
AAPropStatementAndPropSetFuncStatement(copy,   AAChartModel, NSString *, title);
AAPropStatementAndPropSetFuncStatement(copy,   AAChartModel, NSNumber *, titleFontSize);
AAPropStatementAndPropSetFuncStatement(copy,   AAChartModel, NSString *, titleFontColor);
AAPropStatementAndPropSetFuncStatement(copy,   AAChartModel, NSString *, titleFontWeight);

AAPropStatementAndPropSetFuncStatement(copy,   AAChartModel, NSString *, subtitle);
AAPropStatementAndPropSetFuncStatement(copy,   AAChartModel, NSNumber *, subtitleFontSize);
AAPropStatementAndPropSetFuncStatement(copy,   AAChartModel, NSString *, subtitleFontColor);
AAPropStatementAndPropSetFuncStatement(copy,   AAChartModel, NSString *, subtitleFontWeight);

AAPropStatementAndPropSetFuncStatement(strong, AAChartModel, NSArray  *, series);

AAPropStatementAndPropSetFuncStatement(copy,   AAChartModel, AAChartSubtitleAlignType, subtitleAlign);
AAPropStatementAndPropSetFuncStatement(copy,   AAChartModel, AAChartType,              chartType);
AAPropStatementAndPropSetFuncStatement(copy,   AAChartModel, AAChartStackingType,      stacking);
AAPropStatementAndPropSetFuncStatement(copy,   AAChartModel, AAChartSymbolType,        symbol);
AAPropStatementAndPropSetFuncStatement(assign, AAChartModel, AAChartSymbolStyleType,   symbolStyle);
AAPropStatementAndPropSetFuncStatement(copy,   AAChartModel, AAChartZoomType,          zoomType);
AAPropStatementAndPropSetFuncStatement(assign, AAChartModel, AAChartAnimation,         animationType);

AAPropStatementAndPropSetFuncStatement(strong, AAChartModel, NSNumber *, animationDuration);
AAPropStatementAndPropSetFuncStatement(assign, AAChartModel, BOOL,       inverted);
AAPropStatementAndPropSetFuncStatement(assign, AAChartModel, BOOL,       xAxisReversed);
AAPropStatementAndPropSetFuncStatement(assign, AAChartModel, BOOL,       yAxisReversed);
AAPropStatementAndPropSetFuncStatement(assign, AAChartModel, BOOL,       gradientColorEnabled);
AAPropStatementAndPropSetFuncStatement(assign, AAChartModel, BOOL,       polar);
AAPropStatementAndPropSetFuncStatement(assign, AAChartModel, BOOL,       dataLabelEnabled);
AAPropStatementAndPropSetFuncStatement(copy,   AAChartModel, NSString *, dataLabelFontColor);
AAPropStatementAndPropSetFuncStatement(strong, AAChartModel, NSNumber *, dataLabelFontSize);
AAPropStatementAndPropSetFuncStatement(copy,   AAChartModel, NSString *, dataLabelFontWeight);
AAPropStatementAndPropSetFuncStatement(assign, AAChartModel, BOOL,       xAxisLabelsEnabled);
AAPropStatementAndPropSetFuncStatement(copy,   AAChartModel, NSNumber *, xAxisLabelsFontSize);
AAPropStatementAndPropSetFuncStatement(copy,   AAChartModel, NSString *, xAxisLabelsFontColor);
AAPropStatementAndPropSetFuncStatement(copy,   AAChartModel, NSString *, xAxisLabelsFontWeight);
AAPropStatementAndPropSetFuncStatement(strong, AAChartModel, NSArray  *, categories);
AAPropStatementAndPropSetFuncStatement(strong, AAChartModel, NSNumber *, xAxisGridLineWidth);
AAPropStatementAndPropSetFuncStatement(strong, AAChartModel, NSNumber *, xAxisTickInterval);

AAPropStatementAndPropSetFuncStatement(assign, AAChartModel, BOOL,       xAxisVisible);
AAPropStatementAndPropSetFuncStatement(assign, AAChartModel, BOOL,       yAxisVisible);
AAPropStatementAndPropSetFuncStatement(assign, AAChartModel, BOOL,       yAxisLabelsEnabled);
AAPropStatementAndPropSetFuncStatement(copy,   AAChartModel, NSString *, yAxisTitle);
AAPropStatementAndPropSetFuncStatement(copy,   AAChartModel, NSNumber *, yAxisLabelsFontSize);
AAPropStatementAndPropSetFuncStatement(copy,   AAChartModel, NSString *, yAxisLabelsFontColor);
AAPropStatementAndPropSetFuncStatement(copy,   AAChartModel, NSString *, yAxisLabelsFontWeight);
AAPropStatementAndPropSetFuncStatement(strong, AAChartModel, NSNumber *, yAxisGridLineWidth);
AAPropStatementAndPropSetFuncStatement(strong, AAChartModel, NSArray     <NSString *>*, colorsTheme);
AAPropStatementAndPropSetFuncStatement(copy,   AAChartModel, NSString *, backgroundColor);

AAPropStatementAndPropSetFuncStatement(assign, AAChartModel, BOOL,       tooltipEnabled);
AAPropStatementAndPropSetFuncStatement(copy,   AAChartModel, NSString *, tooltipValueSuffix);
AAPropStatementAndPropSetFuncStatement(copy  , AAChartModel, NSString *, tooltipValueString);
AAPropStatementAndPropSetFuncStatement(assign, AAChartModel, BOOL,       tooltipCrosshairs);
AAPropStatementAndPropSetFuncStatement(assign, AAChartModel, BOOL,       connectNulls);
AAPropStatementAndPropSetFuncStatement(assign, AAChartModel, BOOL,       legendEnabled);

AAPropStatementAndPropSetFuncStatement(strong, AAChartModel, NSNumber *, borderRadius);
AAPropStatementAndPropSetFuncStatement(strong, AAChartModel, NSNumber *, markerRadius);

AAPropStatementAndPropSetFuncStatement(assign, AAChartModel, BOOL,       yAxisAllowDecimals);
AAPropStatementAndPropSetFuncStatement(strong, AAChartModel, NSArray  *, yAxisPlotLines);
AAPropStatementAndPropSetFuncStatement(strong, AAChartModel, NSNumber *, yAxisMax);
AAPropStatementAndPropSetFuncStatement(strong, AAChartModel, NSNumber *, yAxisMin);
AAPropStatementAndPropSetFuncStatement(strong, AAChartModel, NSArray  *, yAxisTickPositions);
AAPropStatementAndPropSetFuncStatement(copy,   AAChartModel, NSString *, zoomResetButtonText);
Created By:

                         _0_
                       _oo0oo_
                      o8888888o
                      88" . "88
                      (| -_- |)
                      0\  =  /0
                    ___/`---'\___
                  .' \\|     |// '.
                 / \\|||  :  |||// \
                / _||||| -:- |||||- \
               |   | \\\  -  /// |   |
               | \_|  ''\---/''  |_/ |
               \  .-\__  '-'  ___/-. /
             ___'. .'  /--.--\  `. .'___
          ."" '<  `.___\_<|>_/___.' >' "".
         | | :  `- \`.;`\ _ /`;.`/ - ` : | |
         \  \ `_.   \_ __\ /__ _/   .-` /  /
     =====`-.____`.___ \_____/___.-`___.-'=====
                       `=---='
*****************************************************
     ¥¥¥¥¥¥¥¥¥¥¥¥¥¥¥¥¥¥¥¥¥¥¥¥¥¥¥¥¥¥¥¥¥¥¥¥¥¥¥¥¥¥¥
         €€€€€€€€€€€€€€€€€€€€€€€€€€€€€€€€€€
               $$$$$$$$$$$$$$$$$$$$$$$
                   BUDDHA_BLESS_YOU
                      AWAY_FROM
                         BUG
Source Code⛓
| Language Version | Project Name | Source Code Link |
|---|---|---|
| Objective C | AAChartKit | https://github.com/AAChartModel/AAChartKit |
| Swift | AAInfographics | https://github.com/AAChartModel/AAChartKit-Swift |
LICENSE
![]() AAChartKit is available under the MIT license. See the LICENSE file for more information.
AAChartKit is available under the MIT license. See the LICENSE file for more information.
Contact
- 🌕 🌖 🌗 🌘 WARM TIPS!!! 🌑 🌒 🌓 🌔
- Please contact me on GitHub, if there are any problems encountered in use.
- GitHub Issues : https://github.com/AAChartModel/AAChartKit/issues
- And if you want to contribute for this project, please contact me as well
- GitHub : https://github.com/AAChartModel
- StackOverflow : https://stackoverflow.com/users/7842508/codeforu
- JianShu : http://www.jianshu.com/u/f1e6753d4254
- SegmentFault : https://segmentfault.com/u/huanghunbieguan
Postscript
If you want to shrink the size of the AAChartKit lib, you should do something like this:
- Delete the
.jsfile ofAAJSFilesfolder inAAChartKit. The names of the files that need to be deleted are the following:
- AAHighchartsLib.js
- AAHighchartsMore.js
- AAHighcharts-3d.js
- AAFunnel.js
2.Change the content of AAChartView.html file
<script src="AAHighchartsLib.js">
</script>
<script src="AAHighchartsMore.js">
</script>
<script src="AAHighcharts-3d.js">
</script>
<script src="AAFunnel.js">
</script>
to be
<script src="https://img.hcharts.cn/highcharts/highcharts.js">
</script>
<script src="https://img.hcharts.cn/highcharts/highcharts-more.js">
</script>
To-Do list
- Support user to add delegate events after the graphics content loading was completed
- Support graphics to refresh global content dynamically
- Support graphics to refresh pure data (
series) content dynamically - Support graphics to refresh pure data in real time and scroll dynamically
- Support color layer gradient effects
- Support 3D graphics effects, valid only for partial graphics such as
column chart、bar chart、pie charts、scatterplot chart、bubble chart, etc. - Support
CocoaPods - Support
Carthage - Support code coverage test
- Support horizontal screen (full screen) effect
- Support setting graphics rendering animation freely
- Support rendered graphics to generate image files
- Support generating image files saved to the system album
- Support user to configure
AAOptionsmodel object properties freely - Support stacking the graphics
- Support reversing the graphics axis
- Support rendering scatter chart
- Support rendering column range map
- Support rendering area range graph
- Support rendering the polar chart
- Support rendering the step line chart
- Support rendering the step area chart
- Support rendering the Nightingale rose 🌹chart
- Support rendering the rectangular tree hierarchy diagrams
- Support rendering the circular progress bar chart
- Support adding clicked event callbacks for graphics
