Global Indicators Versions Save
An open-source tool for calculating spatial indicators for healthy, sustainable cities worldwide using open or custom data.
v4.4.1
11 months agoWhat's Changed
- Enhancements by @carlhiggs in https://github.com/global-healthy-liveable-cities/global-indicators/pull/307
Full Changelog: https://github.com/global-healthy-liveable-cities/global-indicators/compare/v4.4.0...v4.4.1
v4.4.0
11 months agoThis update adds a number of enhancements, including:
- updates usage instructions providing guidance on how to use the web app graphical user interface or iPython notebook in Jupyter Lab (with guidance on quickly creating custom interactive choropleth maps)
- allow for optional import of intersection data (eg official data, or externally processed; #30
- @VuokkoH you might be interested in this one!
- allow for defining population, urban region, gtfs etc datasets in region configuration file directly (#298)
- this makes configuration easier in general; the provided example now follows this format
- users can provide their own population data using vector files (#298)
- this also means that indicator analyses can be conducted for demographic subgroups (eg. age group specific indicators)
- Reports can be prepared for custom aggregation scales when configured with alternative vector data (#293)
- The analysis workflow can optionally be run as methods of the ghsci.Region class (#296)
The latter point makes working using Python scripts directly much simpler, for example, to run the example analysis:
from subprocesses import ghsci
r = ghsci.Region('example_ES_Las_Palmas_2023')
r.analysis() # run analyses
r.generate() # generate resources
comparison = "the codename for some preivously prepared region"
comparison = r.compare(comparison) # export a quick regional comparion to csv
comparions # display the dataframe comparison
To do the above for one's own study region of course requires configuration. However, this is now more straightforward requiring modification of just a region yml file. (eg. copy and modify the example region file).
In addition, software versions in the Docker environment have been incremented, and two new packages added (pyrosm and momepy) that may later assist with more flexible ways of loading networks (e.g. using pbf, or ones own network data). The functions to make use of these packages haven't yet been implemented, but the software environment should support this in future, helping to address #158
What's Changed
- Enhancements by @carlhiggs in https://github.com/global-healthy-liveable-cities/global-indicators/pull/292
- Enhancements by @carlhiggs in https://github.com/global-healthy-liveable-cities/global-indicators/pull/297
- Enhancements by @carlhiggs in https://github.com/global-healthy-liveable-cities/global-indicators/pull/299
- updated the example jupyter notebook by @carlhiggs in https://github.com/global-healthy-liveable-cities/global-indicators/pull/300
- Enhancements by @carlhiggs in https://github.com/global-healthy-liveable-cities/global-indicators/pull/301
- added in the option to load external data to represent intersections… by @carlhiggs in https://github.com/global-healthy-liveable-cities/global-indicators/pull/303
- Updated Docker image and version by @carlhiggs in https://github.com/global-healthy-liveable-cities/global-indicators/pull/304
Full Changelog: https://github.com/global-healthy-liveable-cities/global-indicators/compare/v4.3.0...v4.4.0
v4.3.0
1 year agoThis release contains a number of enhancements to the software.
The main one is, the Global Healthy and Sustainable City Indicators (GHSCI) software can be run in different ways according to user needs (#259)
- use keywords (with instructions given):
configure,analysis,generate,compare - use Jupyter Lab (example notebook is provided; type
lab) - import as python modules (provided Jupyter notebook illustrates how this is done)
- run as a graphical user interface in web browser (type
ghsci; see #283)
Facilitating the above was refactoring to allow for regions to be defined as a class (#276).
A full annotated example is now provided in a jupyter notebook, and this includes an example for configuring and running a sensitivity analysis comparison (#288).
In addition, issues with some GTFS feeds processing files where calendar dates is used instead of calendar.txt was addressed (#275), along with some associated issues introduced while conducting this refactoring (#280, #281, #282).
Additionally,
- the instructions provided when the software is first launched have been improved and simplified, with the further addition of a
helpcommand that when entered will display the instructions again. - and supporting future development, a basic Github Actions workflow for continuous integration has been implemented, to run code tests upon pull requests to the main branch
Enjoy!
What's Changed
- Addressing linux-related issues and simplifying instructions display by @carlhiggs in https://github.com/global-healthy-liveable-cities/global-indicators/pull/257
- Enhancements by @carlhiggs in https://github.com/global-healthy-liveable-cities/global-indicators/pull/263
- Create tests.yml by @carlhiggs in https://github.com/global-healthy-liveable-cities/global-indicators/pull/285
- Enhancements by @carlhiggs in https://github.com/global-healthy-liveable-cities/global-indicators/pull/284
Full Changelog: https://github.com/global-healthy-liveable-cities/global-indicators/compare/v4.2.1...v4.3.0
v4.2.1
1 year agoThis addresses
- #251
- #248
- #245
But also adds in more informative user instructions.
Now, when the process is run it displays the software name, version, and links to our websites. Once the Docker image has loaded, it displays instructions for use and a clean user prompt (just a "# " symbol).
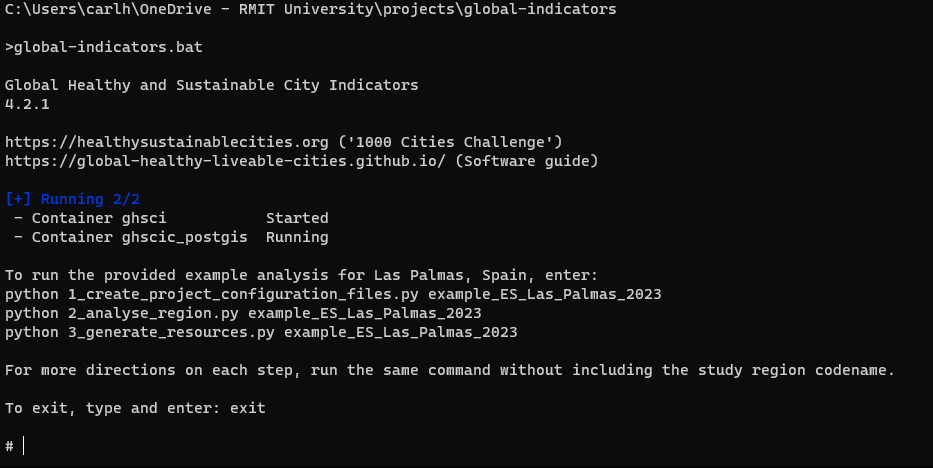
The user instructions are in an instructions.sh shell script -- its possible we could set the prompt itself to be the instructions (but I couldn't get that to work immediately, so didn't bother), or get this script to display after each time a script is run.
I'm not sure about either of those options (probably a better use of time would be to write a mini-wrapper application that meant users didn't have to see/write 'python' at all). But for now, there is more guidance --- including on how to exit.
After running the analysis script, there is also more information provided now -- how to run the generate resources script for this city specifically (so users can copy and paste instead of typing), as well as how to access the postgis database, for those interested.
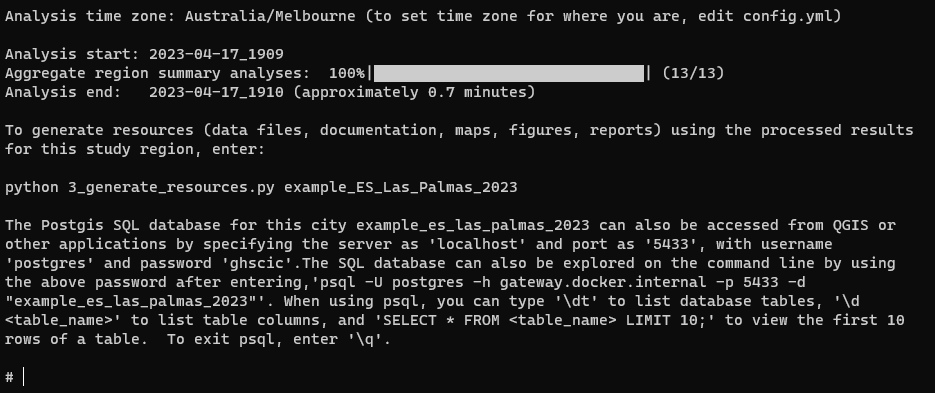
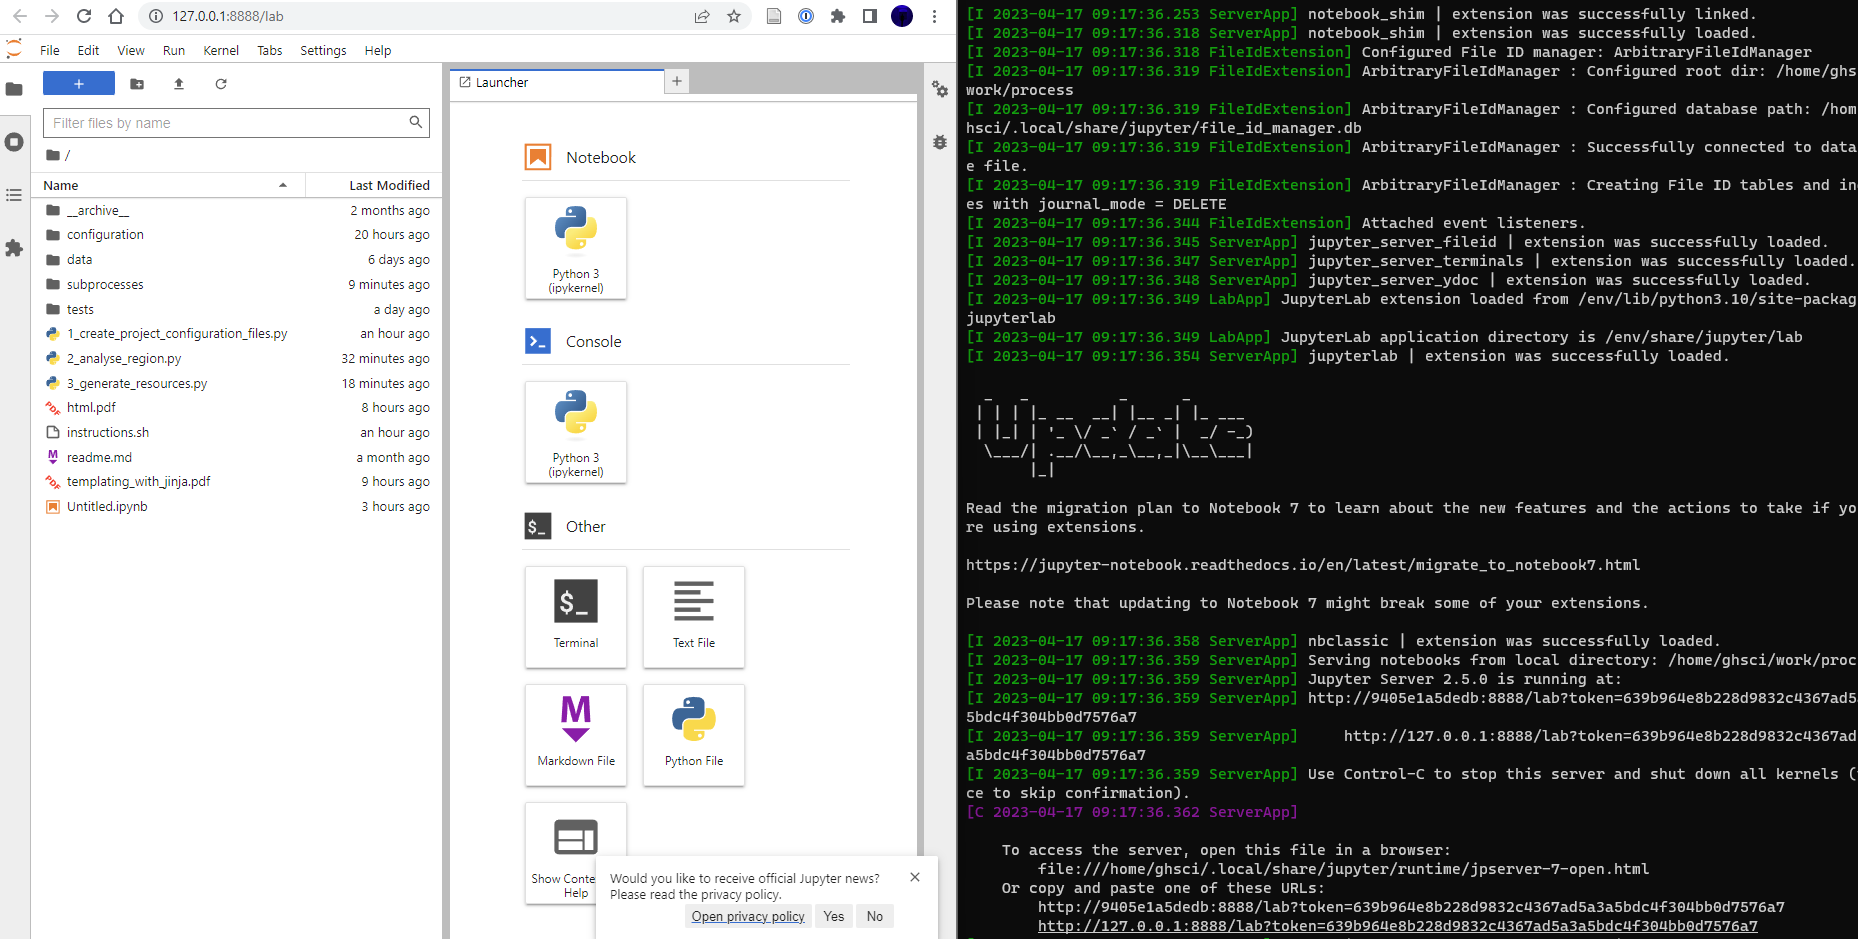
Behind the scenes allows the possibility for those enthusiastic to launch into Jupyter Lab (although its not documented - just have to write 'jupyter' as an argument when launching the process: ./global-indicators.bat jupyter (Windows) or ./global-indicators.sh jupyter (Mac, Linux) . We could later develop an example workflow using Jupyter as an alternative for those who like to work that way.
v4.2.0
1 year agoThis release allows users to generate maps/figures/reports for their cities, without further need to modify the report configuration spreadsheet.
The provided example city's configuration file demonstrates the full set of new 'reporting' parameters supporting generating resoures with prose in different languages. However, if a user has a recent version of the study region configuration file this should still work, using English as a default.
The example configuration file includes a demonstration of set up for English, Spanish and Chinese outputs; however, because the simplified Chinese character font is not included in the repository it will advise the user they need to download this to output resources using Chinese characters.
Additionally, there are now placeholder images included for the example, and updated styling, along with an option to specify whether the report is publication-ready (by default, this is False). Here is the front page of the new report in Spanish (for simplicity, the warning of 'DRAFT' is used for all languages, in addition to some language-specific warnings on the front page):
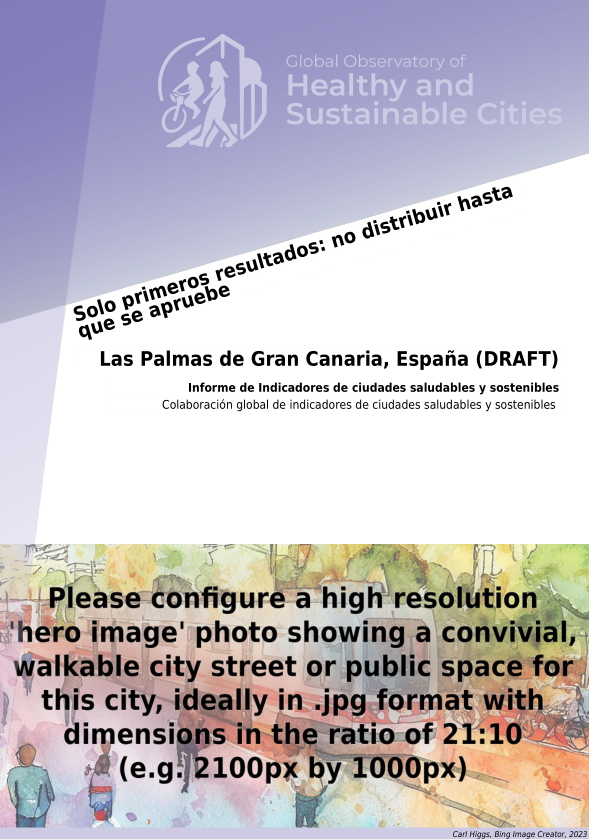
Here is the example city report with the publication_ready set as True (of course, that's not true - its just an example!):
This release also addresses a bug in the previous v4.1.0 relating to a change in the version of Pandas included in the Docker image, with consequent deprecation of a method used (#246). This has been modified to use the newer syntax.
I think this new release adds a lot of value and utility -- in addition to the reports, users can generate maps and figures without further configuration, which is a big win.
Enjoy!
v4.1.0
1 year agoThis is an important update, as per discussion in #235. In particular, it addresses an issue introduced during refactoring in October 2022, where the default scale of walkable neighbourhood analysis was reduced from 1000 to 100 metre catchments. It is recommended that all users update to use this version of the software, which also introduces more comprehensive and informative reporting outputs.
It addresses the following issues (a number of enhancements, but also a couple of bugs):
- #243
- #242
- #239
- #238
- #237 (although this included Jupyter notebook; Jupyter Lab would be preferable - for a future update)
- #236 (included directions for this)
- #233
- #231
- #230
- doesn't resolve #172, but mitigates this through addressing #216 (more efficient for ARM64)
- doesn't resolve #158, but moves towards enabling this via #216 (networks can be loaded from postgis database if matching required schema; we just need to provide a means for users to store custom network using the required schema)
Metadata and updates to config.yml required
The v4.1.0 release of the software added in creation of metadata files (ISO19115 xml, and yml) to accompany the generated data resources, in addition to data dictionaries. If you've ever created metadata, you'll know that this is a big task, so should prove useful when it comes to publishing and sharing data.
This minor release updated the project configuration file `config.yml with the curent software version, so that this can be included in the generated outputs.
To produce the metadata files required the addition of some new fields to the 'documentation' section of the project config.yml file template, and users will have to add these in to their project configuration file if this was generated using a version of the software prior to 4.1.0.
Your config.yml file is up to date if it contains the following entries in the documentation section:
documentation:
    authors: Global Healthy Liveable Cities Indicator Study Collaboration
    # Authors of project (for metadata)
    url:
    # Your URL (optional;  for metadata)
    individualname:
    # Name of contact person for analysis (for metadata)
    positionname:
    # Position of contact person conducting analysis (for metadata)
    email:
    # Contact e-mail (for metadata)
    version: 4.1.0
    # Edition of Global Healthy and Sustainable City Indicators software used (for metadata)
v4.0.1
1 year agoFixed typo (regions_config instead of region_config) in _03_create_network_resources.py subprocess
v4.0.0
1 year agoThis release simplifies and guides the configuration process for new regions. While the structure of configuration files for regions is essentially the same, the location where these is stored is changed along with file naming convention (see examples now found in configuration/regions to see how this is now handled):
- regions now use seperate region configuration files as per #225
- new region configuration files are initialised when running the project configuration script
- the initialised configuration file contains descriptions and examples to guide the user
- users are guided to provide a sensible naming schema to avoid ambiguity (e.g. AU_Melbourne_2023, indicates an analysis for the Australian city Melbourne targetting 2023). This name is now used for the output folder for a city's anlaysis and in naming the output resources, as per #219
- re-processing existing study regions (should that be required) is now faster, with additional checks in place to avoid re-creating resources
- Retrieval of network data using OSMnx now matches the publication data of OpenStreetMap data (as per #158)
- the final report step is renamed as '3_generate_resources.py' as it will produce not just reports, but also maps, figures, scorecards and validation reports
- avoided an issue with SQL server timeout for larger cities (#212)
v3.1.0
1 year agoThis release refines the previous v3.0.0 pre-release, to make it ready for users to run analysis and reporting for the example city of Las Palmas with the downloaded code:
- include a basic set of fonts used in reporting (DejaVu Sans Condensed)
- running report generation doesn't need users to add a '--city' tag; it is run just like the analyse regions step
- updated some documentation to ensure the recent changes were reflected
- improved the listing of regions when the analyse regions script is run without a city codename
This is now good to download and run. However, it is emphasised that this new release (v3.*) has tweaked the region and data configuration files.
Here is a snippet of an older configuration for Santiago de Chile:
santiago:
    full_locale: Santiago
    year: 2022
    region: CL
    country: Chile
    continent: South America
    utm: 19S
    crs_name: SIRGAS-Chile 2002 / UTM zone 19S
    crs_standard: EPSG
    crs_srid: 5361
    area_data: "./data/Chile - Metropolitana de Santiago - 2020 - EPSG5361.geojson"
    area_data_source: La Subsecretaría de Desarrollo Regional y Administrativo (Subdere)
    area_data_source_url: https://datos.gob.cl/dataset/15883 (https://www.ide.cl/descargas/capas/subdere/DivisionPoliticoAdministrativa2020.zip)
    area_data_licence: Creative Commons Non-Commercial (Any)
    area_data_licence_url: http://creativecommons.org/licenses/by-nc/2.0/
    not_urban_intersection:
    note:
There are now sub-headings to make the set up more logical, and double negatives like 'not urban intersection' have been renamed be easier to understand:
santiago_2022:
  name: Santiago
  year: 2022
  country: Chile
  country_code: CL
  continent: South America
  crs:
    name: SIRGAS-Chile 2002 / UTM zone 19S
    standard: EPSG
    srid: 5361
    utm: 19S
  study_region_boundary:
    data: region_boundaries/Chile/Chile - Metropolitana de Santiago - 2020 - EPSG5361.geojson
    source: "La Subsecretar\xEDa de Desarrollo Regional y Administrativo (Subdere)"
    publication_date: 2022-10-12
    url: https://datos.gob.cl/dataset/15883 (https://www.ide.cl/descargas/capas/subdere/DivisionPoliticoAdministrativa2020.zip)
    licence: Creative Commons Non-Commercial (Any)
    licence_url: http://creativecommons.org/licenses/by-nc/2.0/
    ghsl_urban_intersection: true
There is a helper script to update region files located in the configuration folder, remap_yml_config.py. If you had been running an earlier version, you can run it from that folder like python remap_yml_config.py, and it will save a copy of your older regions.yml and should create a new version with the new mapping. There are a few new fields you should add data for (e.g. as above, publication date for study region boundary).
Further detailed usage directions and videos are being prepared and will be published shortly.
v3.0.0
1 year agoThis is a 'pre-release' for v3.0.0 --- it has some breaking changes, in particular that I've restructured the folders and region configuration file to make things easier for users to get up and running.
Changes include:
- When a subprocess fails, advise the user and exit the process #206
- Introduce data configuration checks to elegently advise if configuration is mis-specified #205
- Simplify/clean up folders #203
- Create data sub-folders to guide configuration/data gathering #188
- Include small example region data and configuration as demo and for tests #189
- now includes example data and configuration for Las Palmas de Gran Canarias, which with a mock up template for a policy review [pending update to new style for that, and noting this review hasn't been done for this city] it will allow for the full process to be demonstrated, e.g. in videos or in a workshop that a user can run while watching, and then adapt for their own purposes). Its a small city, so the data excerpts are relatively compact.
I think the last one is the exciting bit. I've run this for a few cities now, including generating reports for Ghent, Valencia and Las Palmas de Gran Canaria with different configurations. I think its okay to put it as a pre-release. The additional guidance from readme files and for configuration files will help people, and help us with creating training / workshop materials.