ELK Save
搭建ELK日志分析平台。
ELK
环境:
Vagrant 1.8.1
CentOS 7.2 192.168.0.228
Elasticsearch 2.3.2
logstash 2.2.4
Kibana 4.4.2
filebeat 1.2.2
topbeat 1.2.2
搭建ELK日志分析平台。此处为其核心配置文件。具体搭建过程请参考ELK环境搭建.docx文档
Screenshots
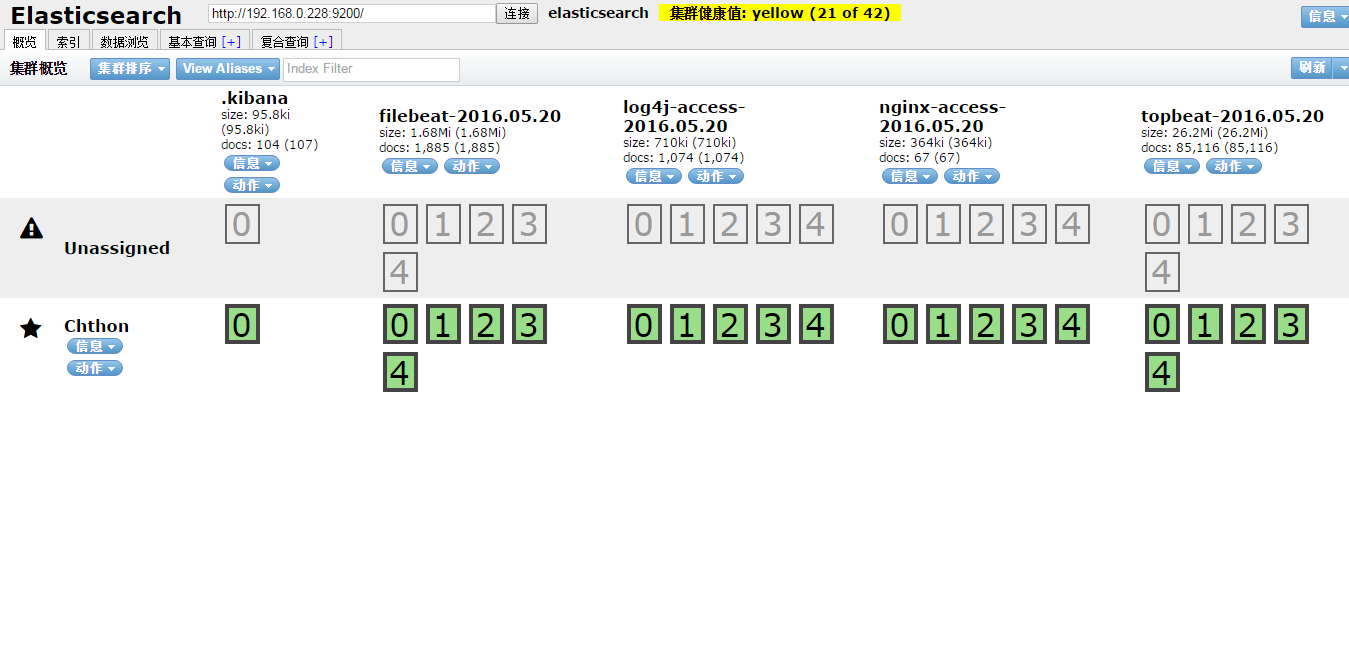
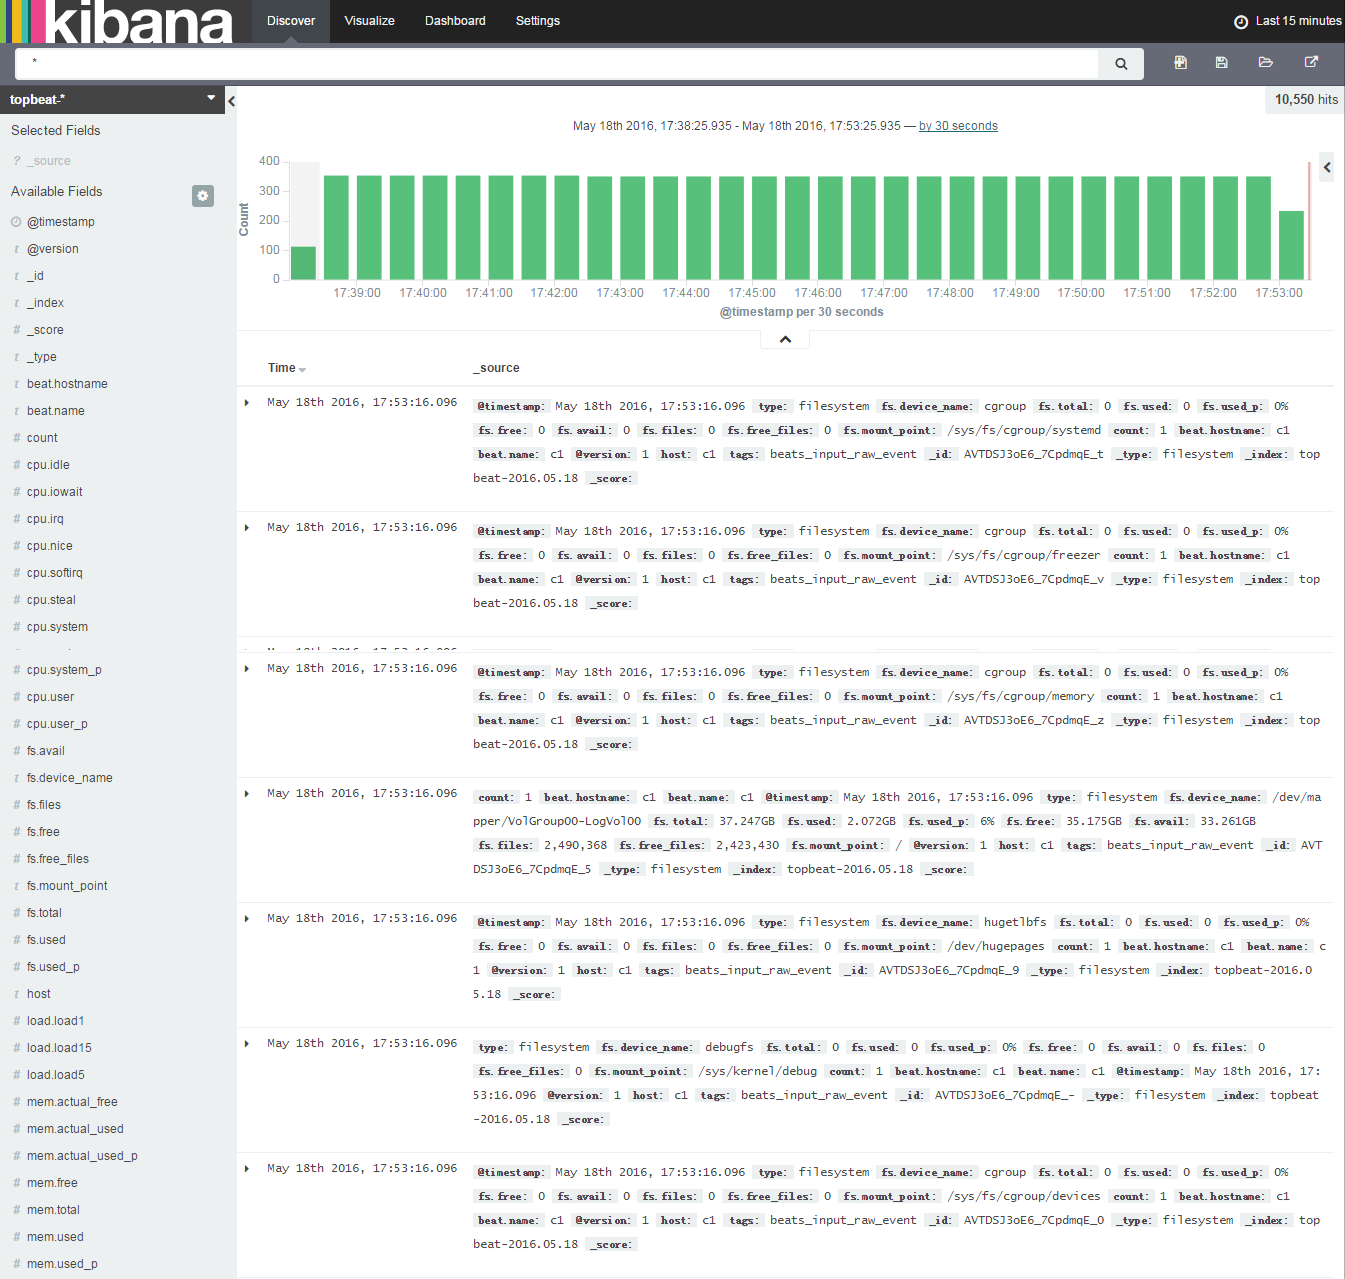
elasticsearch索引列表
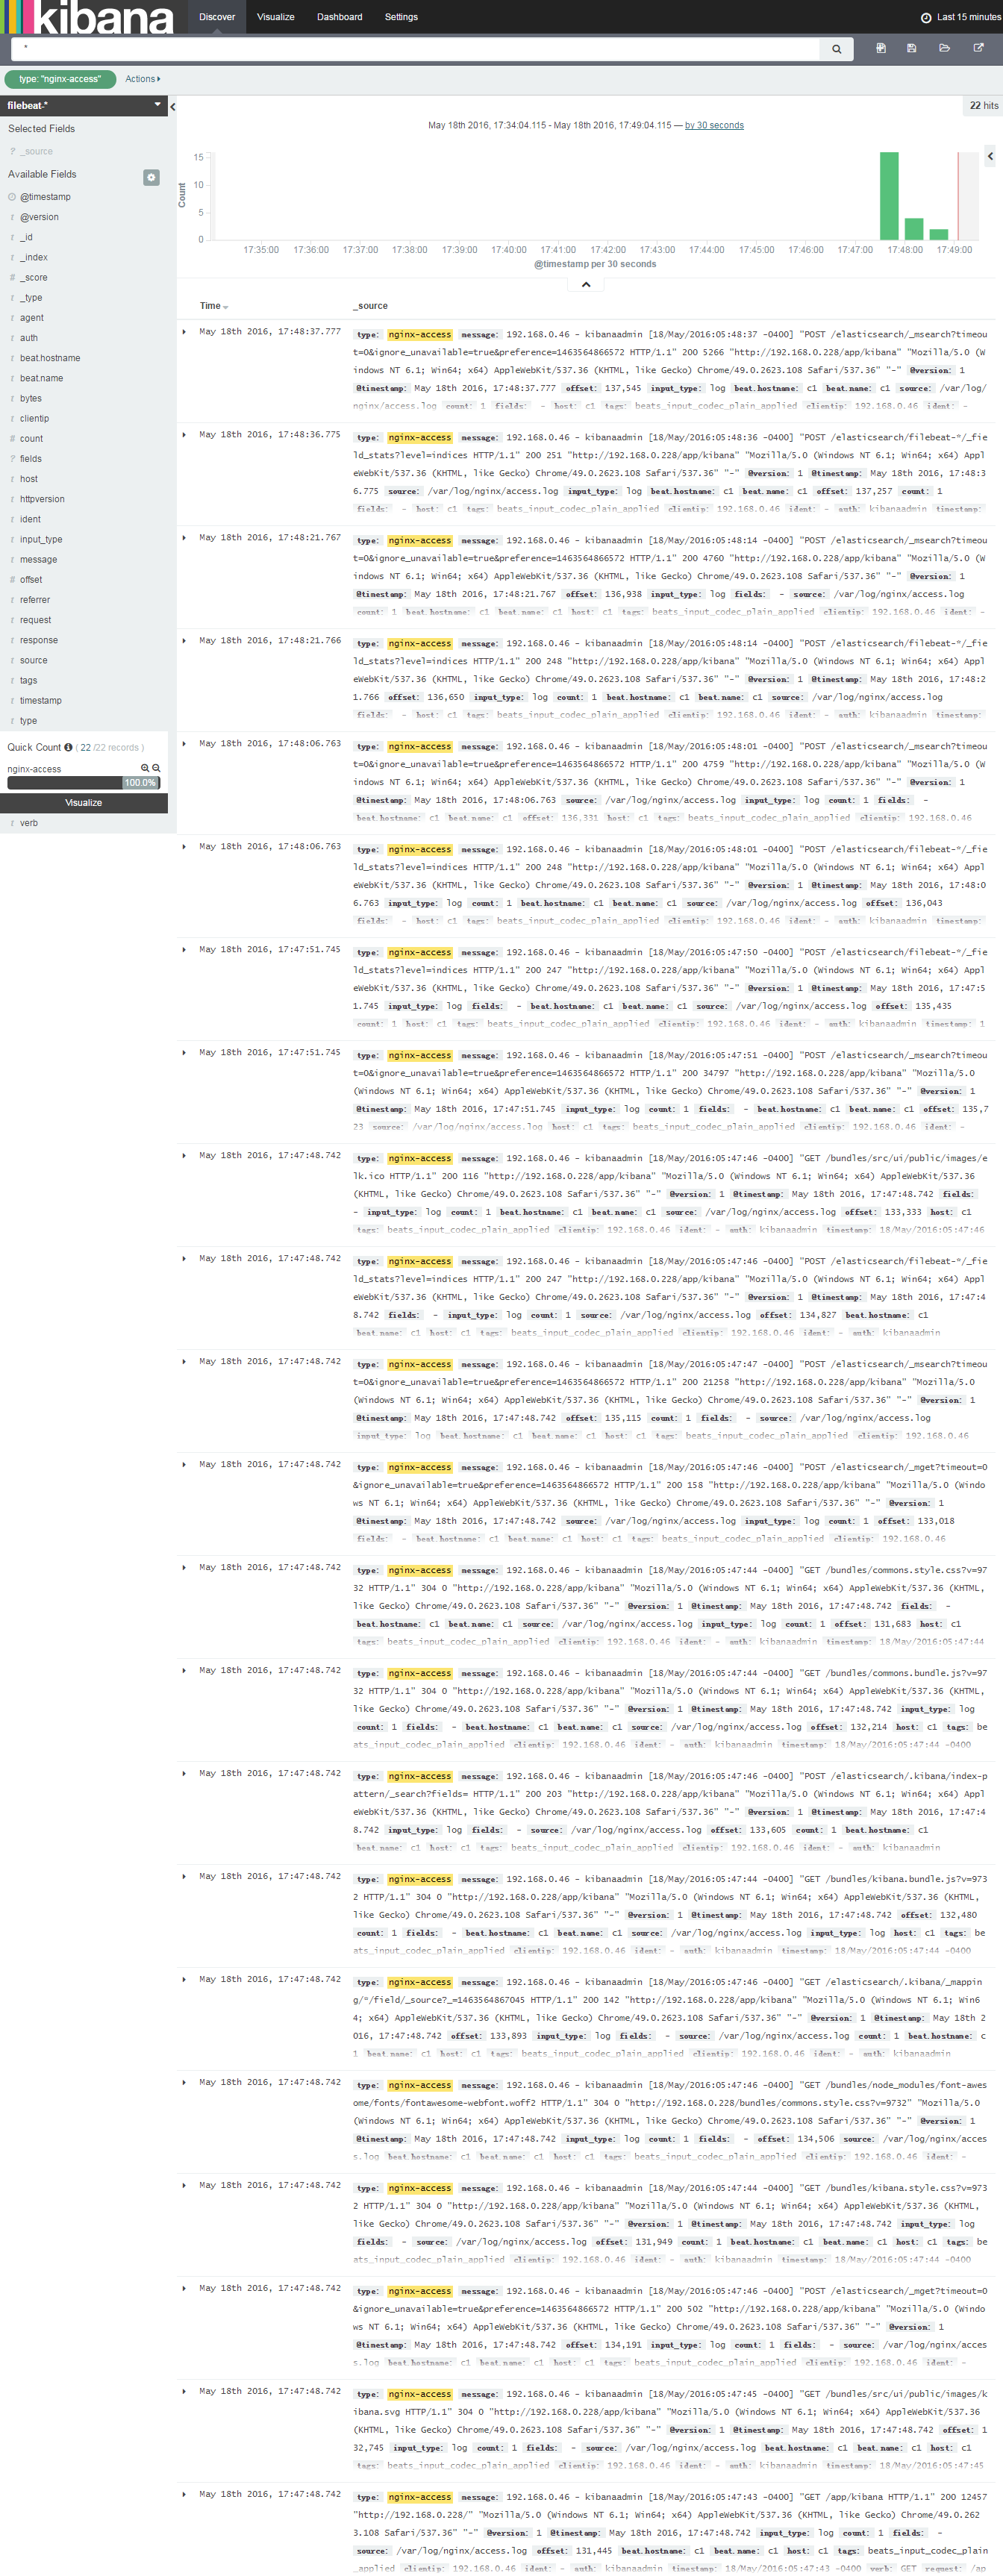
Nginx日志分析
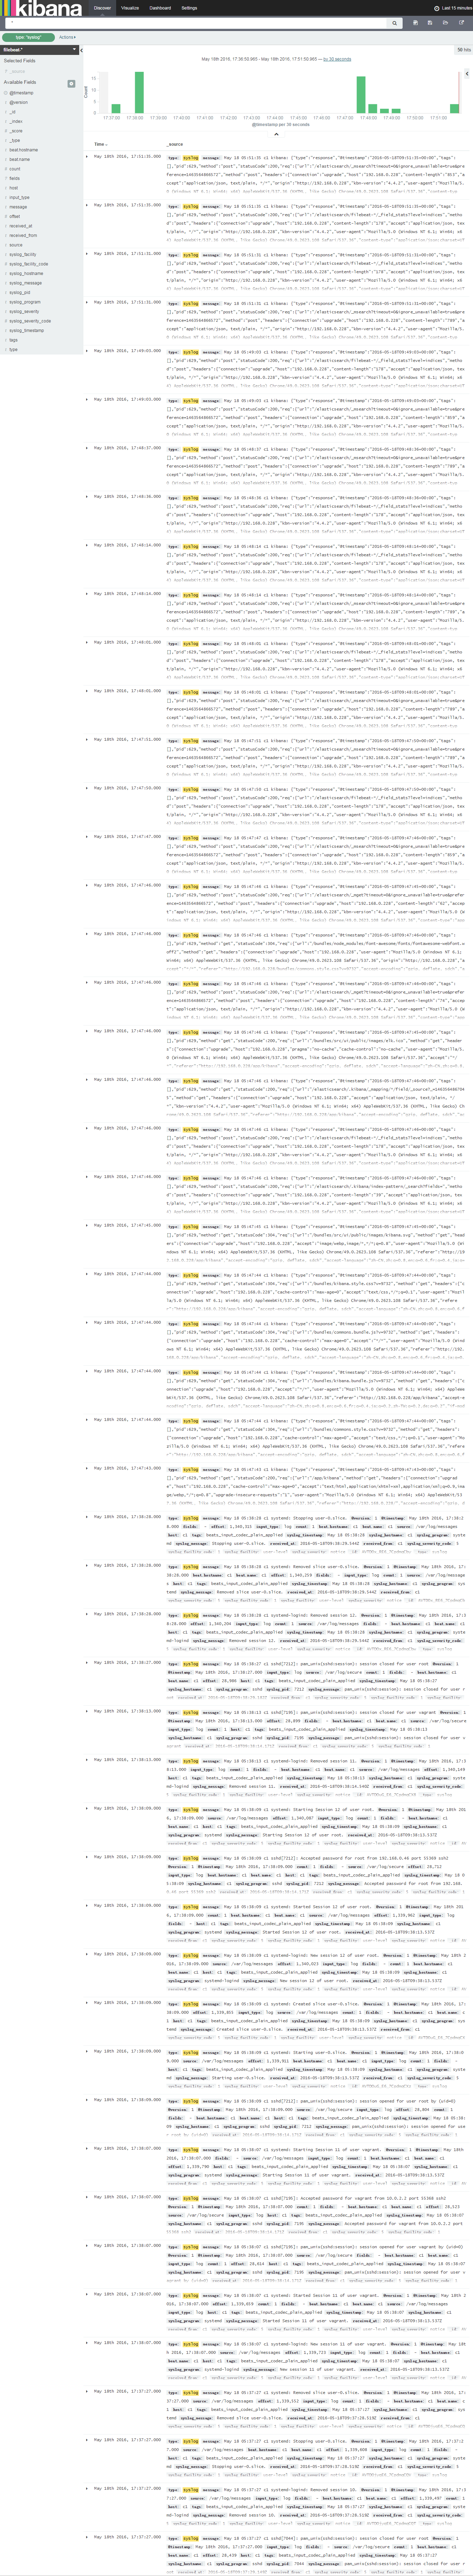
Syslog系统日志分析
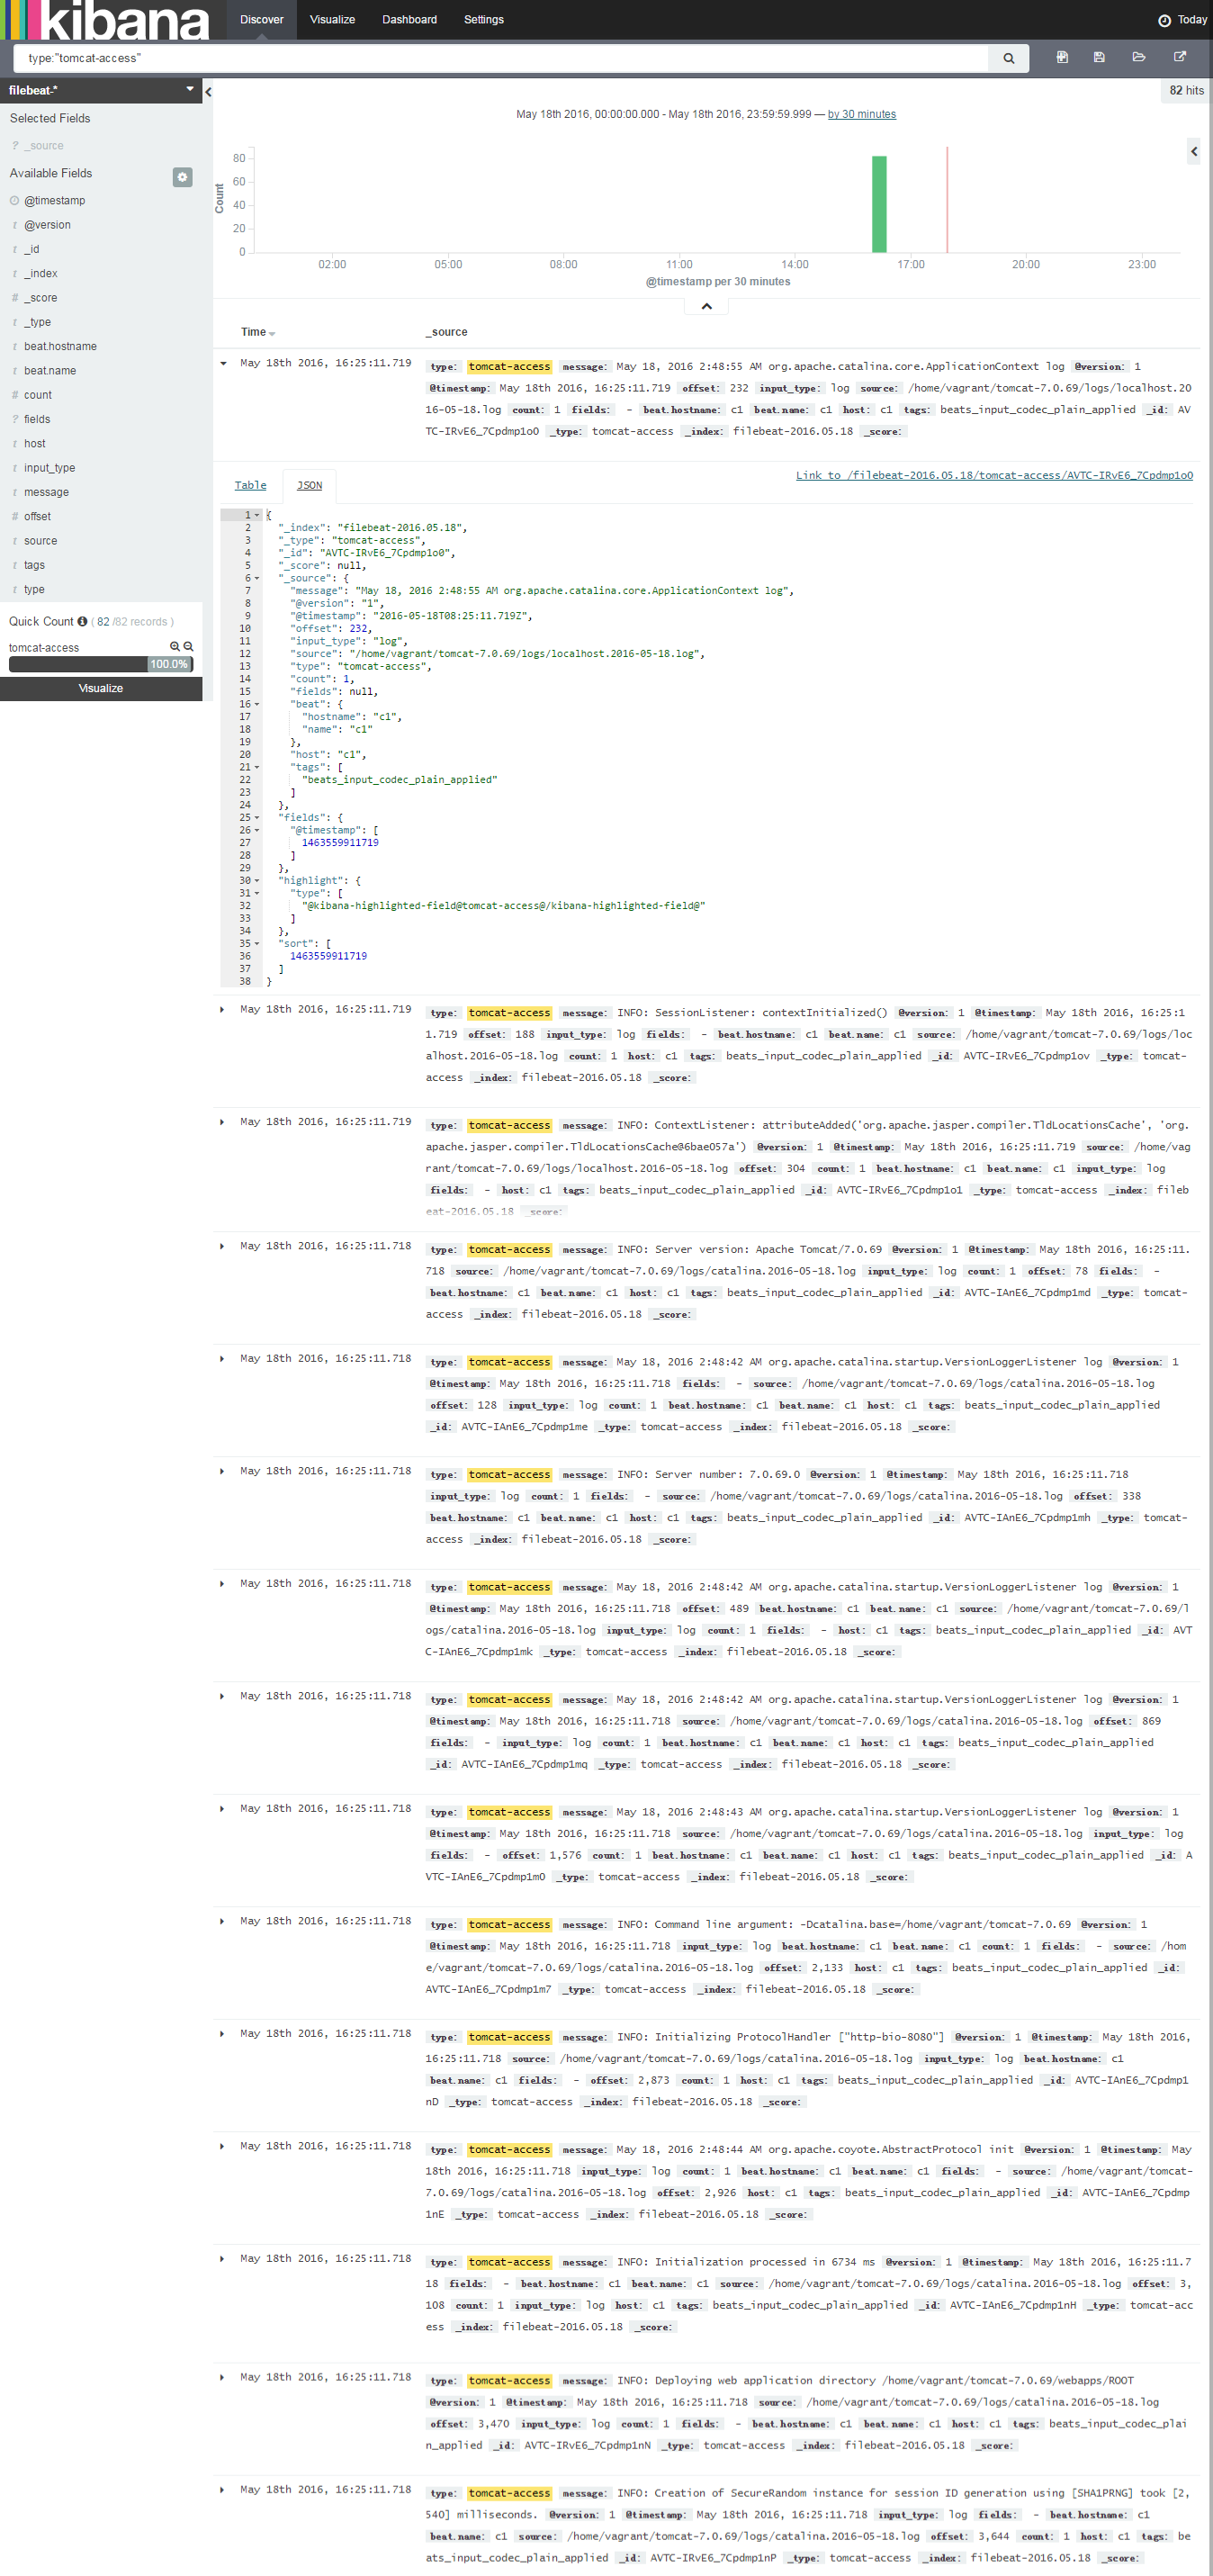
Tomcat日志分析
系统日志分析
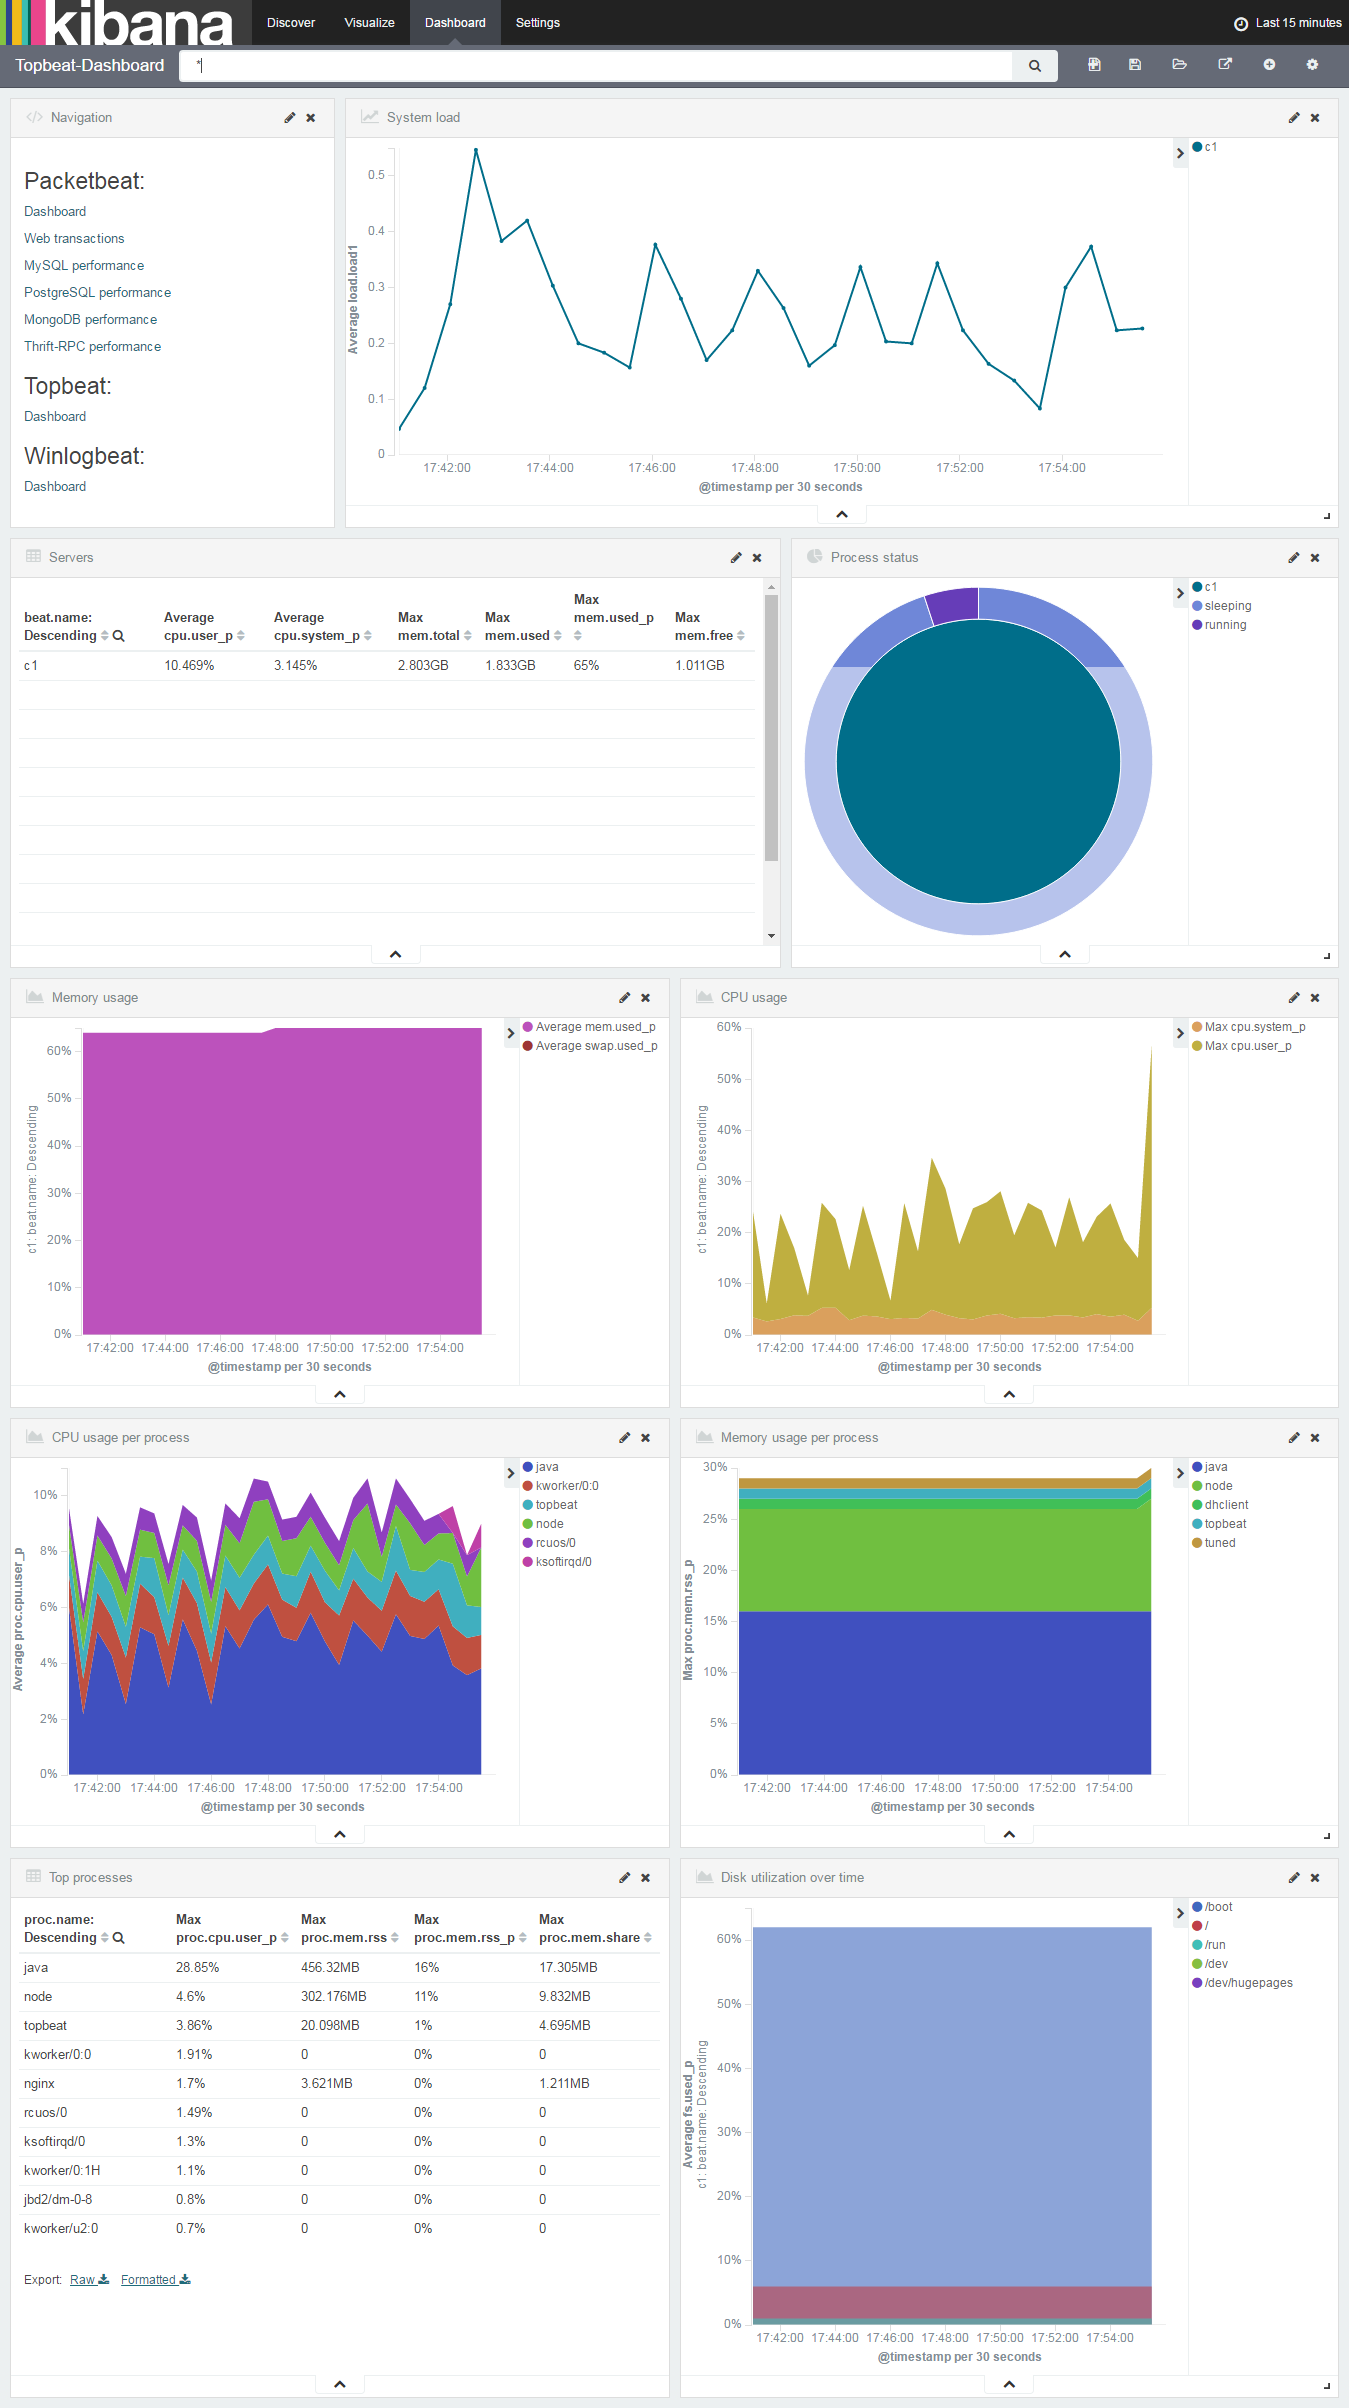
Topbeat Dashboard
logstash命令
logstash命令帮助
$ /opt/logstash/bin/logstash -h
Usage:
    /bin/logstash agent [OPTIONS]

Options:
    -f, --config CONFIG_PATH      Load the logstash config from a specific file
                                  or directory.  If a directory is given, all
                                  files in that directory will be concatenated
                                  in lexicographical order and then parsed as a
                                  single config file. You can also specify
                                  wildcards (globs) and any matched files will
                                  be loaded in the order described above.
    -e CONFIG_STRING              Use the given string as the configuration
                                  data. Same syntax as the config file. If no
                                  input is specified, then the following is
                                  used as the default input:
                                  "input { stdin { type => stdin } }"
                                  and if no output is specified, then the
                                  following is used as the default output:
                                  "output { stdout { codec => rubydebug } }"
                                  If you wish to use both defaults, please use
                                  the empty string for the '-e' flag.
                                   (default: "")
    -w, --pipeline-workers COUNT  Sets the number of pipeline workers to run.
                                   (default: 1)
    -b, --pipeline-batch-size SIZE Size of batches the pipeline is to work in.
                                   (default: 125)
    -u, --pipeline-batch-delay DELAY_IN_MS When creating pipeline batches, how long to wait while polling
                                  for the next event.
                                   (default: 5)
    --filterworkers COUNT         DEPRECATED. Now an alias for --pipeline-workers and -w
    -l, --log FILE                Write logstash internal logs to the given
                                  file. Without this flag, logstash will emit
                                  logs to standard output.
    -v                            Increase verbosity of logstash internal logs.
                                  Specifying once will show 'informational'
                                  logs. Specifying twice will show 'debug'
                                  logs. This flag is deprecated. You should use
                                  --verbose or --debug instead.
    --quiet                       Quieter logstash logging. This causes only
                                  errors to be emitted.
    --verbose                     More verbose logging. This causes 'info'
                                  level logs to be emitted.
    --debug                       Most verbose logging. This causes 'debug'
                                  level logs to be emitted.
    --debug-config                translation missing: en.logstash.runner.flag.debug_config (default: false)
    -V, --version                 Emit the version of logstash and its friends,
                                  then exit.
    -p, --pluginpath PATH         A path of where to find plugins. This flag
                                  can be given multiple times to include
                                  multiple paths. Plugins are expected to be
                                  in a specific directory hierarchy:
                                  'PATH/logstash/TYPE/NAME.rb' where TYPE is
                                  'inputs' 'filters', 'outputs' or 'codecs'
                                  and NAME is the name of the plugin.
    -t, --configtest              Check configuration for valid syntax and then exit.
    --[no-]allow-unsafe-shutdown  Force logstash to exit during shutdown even
                                  if there are still inflight events in memory.
                                  By default, logstash will refuse to quit until all
                                  received events have been pushed to the outputs.
                                   (default: false)
    -h, --help                    print help
检查指定logstash配置文件
$ /opt/logstash/bin/logstash agent -f /etc/logstash/conf.d/14-log4j_to_es.conf -t
收集指定配置文件日志
$ /opt/logstash/bin/logstash agent -f /etc/logstash/conf.d/14-log4j_to_es.conf
查看logstash服务状态
$ sudo service logstash status
logstash is running
$ sudo service logstash start|stop|restart
kibana
修改/opt/kibana/config
server.port: 5601
server.host: "192.168.0.228"
elasticsearch.url: "http://192.168.0.228:9200"
kibana.index: ".kibana"
ELK使用场景配置示例
syslog日志
logstash filter配置
filter {
  if [type] == "syslog" {
    grok {
      match => { "message" => "%{SYSLOGTIMESTAMP:syslog_timestamp} %{SYSLOGHOST:syslog_hostname} %{DATA:syslog_program}(?:\[%{POSINT:syslog_pid}\])?: %{GREEDYDATA:syslog_message}" }
      add_field => [ "received_at", "%{@timestamp}" ]
      add_field => [ "received_from", "%{host}" ]
    }
    syslog_pri { }
    date {
      match => [ "syslog_timestamp", "MMM  d HH:mm:ss", "MMM dd HH:mm:ss" ]
    }
  }
}
java日志收集
http://kibana.logstash.es/content/logstash/examples/java.html
- log4j SocketAppender
logstash配置
input {
  # log4j SocketAppender
  log4j {
    mode => "server"
    host => "192.168.0.228"
    port => 4560
    type => "log4j"
  }
}

filter {
}

output {
  if [type] == "log4j" {
    elasticsearch {
      action => "index"
      hosts  => "192.168.0.228:9200"
      index  => "log4j-access-%{+yyyy.MM.dd}"
    }
    redis {
      host => "192.168.0.46"
      port => 6379
      data_type => "list"
      key => "logstash:log4j"
    }
  }
}
log4j.properties
log4j.rootLogger=logstash

###SocketAppender###
log4j.appender.logstash=org.apache.log4j.net.SocketAppender
# logstash中log4j input中的端口号
log4j.appender.logstash.Port=4560
# logstash所在机器IP
log4j.appender.logstash.RemoteHost=192.168.0.228
log4j.appender.logstash.ReconnectionDelay=60000
log4j.appender.logstash.LocationInfo=true
log4j.appender.logstash.Application=elk-log4j-simple
- log4j-jsonevent-layout
logstash配置
input {
  # log4j-jsonevent-layout
  file {
    codec => json
    path => "/home/vagrant/tomcat-7.0.69/bin/target/*.log"
    type => "log4j"
    start_position => "beginning"
    sincedb_path => "/dev/null"
  }
}

filter {
}

output {
  if [type] == "log4j" {
    elasticsearch {
      action => "index"
      hosts  => "192.168.0.228:9200"
      index  => "log4j-access-%{+yyyy.MM.dd}"
    }
    redis {
      host => "192.168.0.46"
      port => 6379
      data_type => "list"
      key => "logstash:log4j"
    }
  }
}
<!-- 将lo4j日志输出为json -->
<dependency>
    <groupId>net.logstash.log4j</groupId>
    <artifactId>jsonevent-layout</artifactId>
    <version>1.7</version>
</dependency>
注:output中elasticsearch项中index为当前被索引文档在elasticsearch中索引名称。使用kibana搜索的时候需要事先根据该值创建一个index pattern
tomcat日志
logstash pattern配置
JAVACLASS (?:[a-zA-Z0-9-]+\.)+[A-Za-z0-9$]+

JAVALOGMESSAGE (.*)

# MMM dd, yyyy HH:mm:ss eg: Jan 9, 2014 7:13:13 AM
CATALINA_DATESTAMP %{MONTH} %{MONTHDAY}, 20%{YEAR} %{HOUR}:?%{MINUTE}(?::?%{SECOND}) (?:AM|PM)

# yyyy-MM-dd HH:mm:ss,SSS ZZZ eg: 2014-01-09 17:32:25,527 -0800
TOMCAT_DATESTAMP 20%{YEAR}-%{MONTHNUM}-%{MONTHDAY} %{HOUR}:?%{MINUTE}(?::?%{SECOND}) %{ISO8601_TIMEZONE}

CATALINALOG %{CATALINA_DATESTAMP:timestamp} %{JAVACLASS:class} %{JAVALOGMESSAGE:logmessage}

# 2014-01-09 20:03:28,269 -0800 | ERROR | com.example.service.ExampleService - something compeletely unexpected happened...
TOMCATLOG %{TOMCAT_DATESTAMP:timestamp} \| %{LOGLEVEL:level} \| %{JAVACLASS:class} - %{JAVALOGMESSAGE:logmessage}
logstash filter配置
filter {
  if [type] == "tomcat_access" {
    grok {
      match => [ "message", "%{TOMCATLOG}", "message", "%{CATALINALOG}" ]
    }
    date {
      match => [ "timestamp", "yyyy-MM-dd HH:mm:ss,SSS Z", "MMM dd, yyyy HH:mm:ss a" ]
    }
  }
}
apache日志
logstash filter配置
filter {
  if [type] == "apache-access" {
    grok {
      match => { "message" => "%{COMBINEDAPACHELOG}" }
    }
  }
}
nginx访问日志
logstash pattern配置
NGUSERNAME [a-zA-Z\.\@\-\+_%]+
NGUSER %{NGUSERNAME}
NGINXACCESS %{IPORHOST:clientip} %{NGUSER:ident} %{NGUSER:auth} \[%{HTTPDATE:timestamp}\] "%{WORD:verb} %{URIPATHPARAM:request} HTTP/%{NUMBER:httpversion}" %{NUMBER:response} (?:%{NUMBER:bytes}|-) (?:"(?:%{URI:referrer}|-)"|%{QS:referrer}) %{QS:agent}
logstash filter配置
filter {
  if [type] == "nginx-access" {
    grok {
      match => { "message" => "%{NGINXACCESS}" }
    }
    geoip {
      source => "clientip"
      target => "geoip"
      database => "/etc/logstash/GeoLiteCity.dat"
      add_field => [ "[geoip][coordinates]", "%{[geoip][longitude]}" ]
      add_field => [ "[geoip][coordinates]", "%{[geoip][latitude]}"  ]
    }
    mutate {
      convert => [ "[geoip][coordinates]", "float"]
    }
  }
}
nginx access日志转化为json格式
http://kibana.logstash.es/content/logstash/examples/nginx-access.html
http://kibana.logstash.es/content/logstash/plugins/codec/json.html
nginx.conf
log_format json '{"@timestamp":"$time_iso8601",'
                 '"host":"$server_addr",'
                 '"clientip":"$remote_addr",'
                 '"size":$body_bytes_sent,'
                 '"responsetime":$request_time,'
                 '"upstreamtime":"$upstream_response_time",'
                 '"upstreamhost":"$upstream_addr",'
                 '"http_host":"$host",'
                 '"url":"$uri",'
                 '"xff":"$http_x_forwarded_for",'
                 '"referer":"$http_referer",'
                 '"agent":"$http_user_agent",'
                 '"status":"$status"}';
access_log  /var/log/nginx/access.log  json;
logstash配置
input {
  file {             #从nginx日志读入
    type => "nginx-access"
    path => "/var/log/nginx/access.log"
    start_position => "beginning"
    sincedb_path => "/dev/null"
    codec => "json"  #这里指定codec格式为json
  }
}

filter {
    mutate {
        split => [ "upstreamtime", "," ]
    }
    mutate {
        convert => [ "upstreamtime", "float" ]
    }
}

output {
  if [type] == "nginx-access" {
    elasticsearch {
      hosts => ["192.168.0.228:9200"]
      index => "nginx-access-%{+yyyy.MM.dd}"
    }
  }
}
mysql慢日志
http://kibana.logstash.es/content/logstash/examples/mysql-slow.html
logstash配置
input {
  file {
   type => "mysql-slow"
   path => "/var/log/mysql/mysql-slow.log"
   start_position => "beginning"
   sincedb_path => "/dev/null"
   codec => multiline {         #这里用到了logstash的插件功能,将本来属于一行的多行日志条目整合在一起,让他属于一条
     pattern => "^# User@Host"  #用到了正则去匹配
     negate => true
     what => "previous"
   }
  }
}

filter {
  # drop sleep events
  grok {
    match => { "message" => "SELECT SLEEP" }
    add_tag => [ "sleep_drop" ]
    tag_on_failure => [] # prevent default _grokparsefailure tag on real records
  }
  if "sleep_drop" in [tags] {
    drop {}
  }
  grok {
    match => [ "message", "(?m)^# User@Host: %{USER:user}\[[^\]]+\] @ (?:(?<clienthost>\S*) )?\[(?:%{IP:clientip})?\]\s*# Query_time: %{NUMBER:query_time:float}\s+Lock_time: %{NUMBER:lock_time:float}\s+Rows_sent: %{NUMBER:rows_sent:int}\s+Rows_examined: %{NUMBER:rows_examined:int}\s*(?:use %{DATA:database};\s*)?SET timestamp=%{NUMBER:timestamp};\s*(?<query>(?<action>\w+)\s+.*)\n# Time:.*$" ]
  }
  date {
    match => [ "timestamp", "UNIX" ]
    remove_field => [ "timestamp" ]
  }
}

output {
  if [type] == "mysql-slow" {
     elasticsearch {
        action => "index"
        hosts  => "192.168.0.228:9200"
        index  => "mysql-slow-%{+yyyy.MM.dd}"
     }
  }
}
平台搭建参考文章
https://www.digitalocean.com/community/tutorials/how-to-use-kibana-dashboards-and-visualizations
yml语法校验
http://yaml-online-parser.appspot.com/
linux平台系统运维教程集
https://www.digitalocean.com/community/tutorials
tomcat日志分析参考
https://aggarwalarpit.wordpress.com/2015/12/03/configuring-elk-stack-to-analyse-apache-tomcat-logs/
https://www.systemcodegeeks.com/web-servers/apache/configuring-elk-stack-analyse-apache-tomcat-logs/
https://blog.lanyonm.org/articles/2014/01/12/logstash-multiline-tomcat-log-parsing.html
log4j日志分析
https://github.com/logstash/log4j-jsonevent-layout
https://www.elastic.co/guide/en/logstash/current/plugins-inputs-log4j.html
https://blog.lanyonm.org/articles/2015/12/29/log-aggregation-log4j-spring-logstash.html
