XiaoleiLiuBio G2P Save
G2P: A Genome-Wide-Association-Study Simulation Tool for Genotype Simulation, Phenotype Simulation, and Power Evaluation
G2P 

A Genome-Wide-Association-Study Simulation Tool for Genotype Simulation, Phenotype Simulation, and Power Evaluation
![]()
More abundant simulation functions could be referred to our newly developed package SIMER for simulation of life science and breeding
Authors:
You Tang and Xiaolei Liu
Contact:
[[email protected]](Xiaolei Liu)
Contents
- Installation
- Data Preparation
- Genotype Simulation
- Phenotype Simulation
- Population Structure
- Quality Control
- GWAS
- Method Evaluation
- FAQ and Hints
Installation
Environment Setup
back to top
JDK1.8 should be installed and environment variables must be configured before using G2P (http://www.oracle.com/technetwork/java/javase/downloads/jdk8-downloads-2133151.html)
Windows
back to top
GUI
Download all files from https://github.com/XiaoleiLiuBio/G2P/tree/master/gG2P_win_64 and double click the .jar file
Pipeline
Download all files from https://github.com/XiaoleiLiuBio/G2P/tree/master/kG2P_win_64
Mac
back to top
GUI
Download all files from https://github.com/XiaoleiLiuBio/G2P/tree/master/gG2P_mac and double click the .jar file
Pipeline
Download all files from https://github.com/XiaoleiLiuBio/G2P/tree/master/kG2P_mac
permission setting
$ chmod 777 gemma oldplink plink
Linux
back to top
GUI
Download all files from https://github.com/XiaoleiLiuBio/G2P/tree/master/gG2P_linux_x86_64
and run
$ Java -jar gG2P.jar
Pipeline
Download all files from https://github.com/XiaoleiLiuBio/G2P/tree/master/kG2P_linux_x86_64
permission setting
$ chmod 777 gemma oldplink plink
Data Preparation
All files should be prepared with the same prefix
ped
details see http://zzz.bwh.harvard.edu/plink/data.shtml#ped
back to top
| Family ID | Individual ID | Father ID | Mother ID | Sex | Trait | marker 1 | marker 2 | marker 3 | marker 4 | marker 5 | marker 6 |
|---|---|---|---|---|---|---|---|---|---|---|---|
| 1 | 33-16 | 0 | 0 | 0 | 2 | 0 0 | A A | A A | A G | A G | A G |
| 1 | 38-11 | 0 | 0 | 0 | 2 | 0 0 | A G | A G | A A | A G | A G |
| 1 | 4226 | 0 | 0 | 0 | 2 | 0 0 | A G | A A | A A | A G | A G |
| 1 | 4722 | 0 | 0 | 0 | 2 | 0 0 | A G | A G | A A | A G | A G |
| 1 | A188 | 0 | 0 | 0 | 2 | 0 0 | A A | A A | A A | A G | A G |
| 1 | A214N | 0 | 0 | 0 | 2 | 0 0 | A G | A A | A G | A A | A G |
| 1 | A239 | 0 | 0 | 0 | 2 | 0 0 | A A | A A | A G | A G | A A |
| Family ID | Individual ID | Father ID | Mother ID | Sex | Trait | marker 1 | marker 2 | marker 3 | marker 4 | marker 5 | marker 6 |
|---|---|---|---|---|---|---|---|---|---|---|---|
| 1 | 33-16 | 0 | 0 | 0 | 2 | 0 0 | 1 1 | 1 1 | 1 3 | 1 3 | 1 3 |
| 1 | 38-11 | 0 | 0 | 0 | 2 | 0 0 | 1 3 | 1 3 | 1 1 | 1 3 | 1 3 |
| 1 | 4226 | 0 | 0 | 0 | 2 | 0 0 | 1 3 | 1 1 | 1 1 | 1 3 | 1 3 |
| 1 | 4722 | 0 | 0 | 0 | 2 | 0 0 | 1 3 | 1 3 | 1 1 | 1 3 | 1 3 |
| 1 | A188 | 0 | 0 | 0 | 2 | 0 0 | 1 1 | 1 1 | 1 1 | 1 3 | 1 3 |
| 1 | A214N | 0 | 0 | 0 | 2 | 0 0 | 1 3 | 1 1 | 1 3 | 1 1 | 1 3 |
| 1 | A239 | 0 | 0 | 0 | 2 | 0 0 | 1 1 | 1 1 | 1 3 | 1 3 | 1 1 |
map
details see http://zzz.bwh.harvard.edu/plink/data.shtml#map
back to top
| Chromosome ID | Marker ID | Genetic Distance | Physical Distance |
|---|---|---|---|
| 1 | PZB00859.1 | 0 | 157104 |
| 1 | PZA01271.1 | 0 | 1947984 |
| 1 | PZA03613.2 | 0 | 2914066 |
| 1 | PZA03613.1 | 0 | 2914171 |
| 1 | PZA03614.2 | 0 | 2915078 |
| 1 | PZA03614.1 | 0 | 2915242 |
| 1 | PZA00258.3 | 0 | 2973508 |
pop
back to top
new samples will be generated using samples within sub-population
| Sample ID | sub-Population ID |
|---|---|
| 33-16 | 1 |
| 38_11 | 1 |
| 4226 | 1 |
| 4722 | 2 |
| A188 | 2 |
| A214N | 2 |
| A239 | 2 |
| A272 | 2 |
| A441-5 | 2 |
| A554 | 3 |
| A556 | 3 |
| A6 | 3 |
| A619 | 3 |
qtn
back to top
each column represents simulated QTNs for each phenotype
| Phenotype 1 | Phenotype 2 | Phenotype 3 | Phenotype 4 | Phenotype 5 |
|---|---|---|---|---|
| 66 | 67 | 80 | 83 | 90 |
| 9 | 15 | 52 | 59 | 135 |
| 90 | 96 | 143 | 147 | 174 |
| 3 | 3 | 15 | 58 | 89 |
| 89 | 118 | 185 | 203 | 212 |
| 69 | 72 | 72 | 84 | 110 |
| 46 | 59 | 125 | 204 | 207 |
| 14 | 15 | 19 | 29 | 39 |
| 9 | 23 | 65 | 111 | 131 |
| 19 | 52 | 74 | 179 | 194 |
Genotype Simulation
Single Population _ GUI
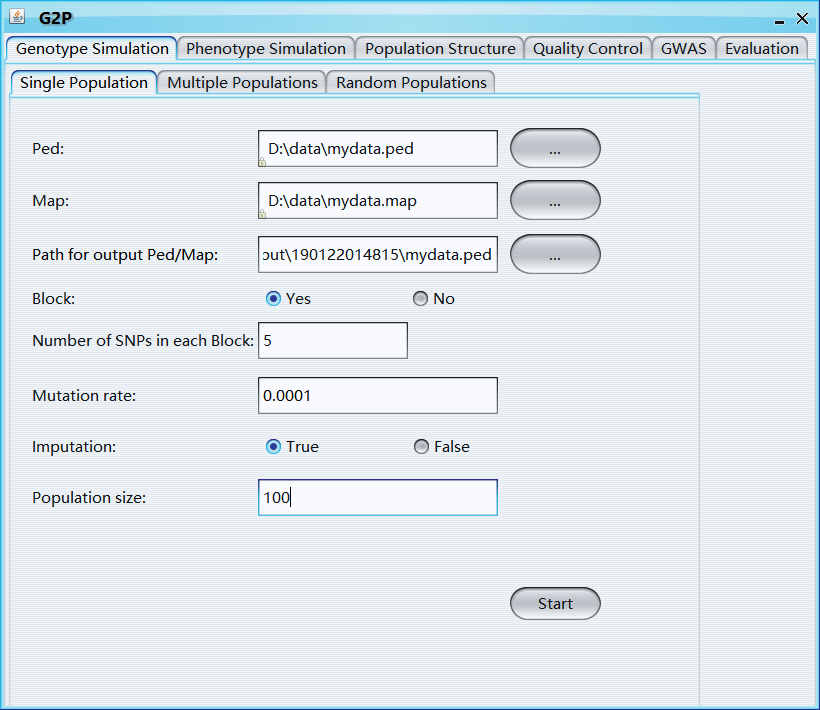
Ped: ped file
Map: map file
Path for output Ped/Map: path for output ped and map file
Block: Yes or No, if "Yes", the whole genome will be divided into blocks and shuffled to generate new samples
Number of SNPs in each block: Number of SNPs in each block
Mutation rate: the frequency of new mutations
Imputation: if TRUE, major allele will be used to impute missing values
Population size: simulated sample size
Single Population _ Pipeline
Windows
java -jar kG2P.jar --ped D:\data\AG.ped --map D:\data\AG.map --outgen D:\data\output --rn 100 --block 4 –impute
java -jar kG2P.jar --ped D:\data\AG.ped --map D:\data\AG.map --outgen D:\data\output --rn 100 --block 4 --mutation 0.0001 --impute
Linux/Mac
java -jar kG2P.jar --ped /root/data/AG.ped --map /root/data/AG.map --outgen /root/data/output --rn 100 --block 4 –impute
java -jar kG2P.jar --ped /root/data/AG.ped --map /root/data/AG.map --outgen /root/data/output --rn 100 --mutation 0.0001
java -jar kG2P.jar --ped D:\data\AG.ped --map D:\data\AG.map --outgen D:\data\output --rn 100 --block 4
java -jar kG2P.jar --ped D:\data\AG.ped --map D:\data\AG.map --outgen D:\data\output --rn 100 --impute
java -jar kG2P.jar --ped D:\data\AG.ped --map D:\data\AG.map --outgen D:\data\output --rn 100
java -jar kG2P.jar --ped D:\data\AG.ped --map D:\data\AG.map --outgen D:\data\output --rn 100 --mutation 0.0001
jar: executive software
ped: ped file
map: map file
outgen: output path
block: number of SNPs in each block
rn: simulated sample size
impute: if 'impute' is added, major allele will be used to impute missing value
mutation: the frequency of new mutations
Multi Populations _ GUI
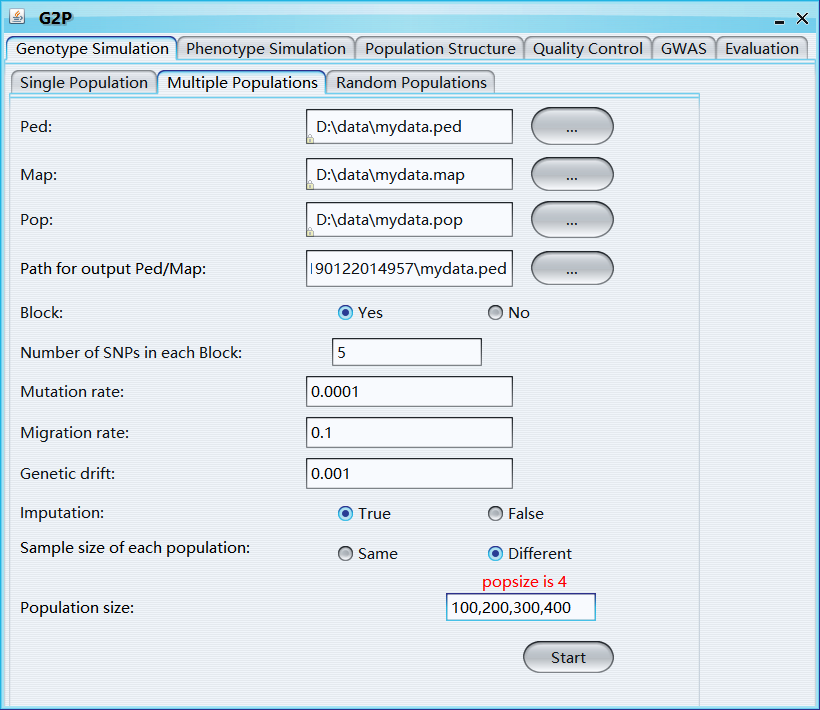
Ped: ped file
Map: map file
Pop: pop file
Path for output Ped/Map: path for output ped and map file
Block: Yes, or No, if "Yes", the whole genome will be divided into blocks and shuffled to generate new samples
Number of SNPs in each block: Number of SNPs in each block
Mutation rate: the frequency of new mutations
Migration rate: the ratio of immigrants (or emigrants) for each group
Genetic drift: is the change in the frequency of an existing gene variant (allele) in a population due to random sampling of organisms
Imputation: if TRUE, major allele will be used to impute missing values
Sample size of each population: sample size of each newly simulated population
Population size: number or vector, simulated sample size
Multi Populations _ Pipeline
Windows
java -jar kG2P.jar --ped D:\data\AG.ped –map D:\data\AG.map --pop D:\data\AG.pop --outgen D:\data\output --block 4 --rn 100
java -jar kG2P.jar --ped D:\data\AG.ped --map D:\data\AG.map --pop D:\data\AG.pop --outgen D:\data\output --block 4 --rn 100 --mutation 0.0001 --mig 0.1 --genetic 0.001
Linux/Mac
java -jar kG2P.jar --ped /root/data/AG.ped --map /root/data/AG.map --pop /root/data/AG.pop --outgen /root/data/output --impute --block 4 --rn 100
java -jar kG2P.jar --ped /root/data/AG.ped --map /root/data/AG.map --pop /root/data/AG.pop --outgen /root/data/output --rn 100 --mutation 0.0001 --mig 0.1 --genetic 0.001
java -jar kG2P.jar --ped /root/data/AG.ped --map /root/data/AG.map --pop /root/data/AG.pop --outgen /root/data/output --rn 100 --genetic 0.001
java -jar kG2P.jar --ped D:\data\AG.ped --map D:\data\AG.map --pop D:\data\AG.pop --outgen D:\data\output --block 4 --rn 100
java -jar kG2P.jar --ped D:\data\AG.ped --map D:\data\AG.map --pop D:\data\AG.pop --outgen D:\data\output --rn 100
java -jar kG2P.jar --ped D:\data\AG.ped --map D:\data\AG.map --pop D:\data\AG.pop --outgen D:\data\output --impute --rn 100
java -jar kG2P.jar --ped D:\data\AG.ped --map D:\data\AG.map --pop D:\data\AG.pop --outgen D:\data\output --impute --block 4 --rn 100,200,300,400
java -jar kG2P.jar --ped D:\data\AG.ped --map D:\data\AG.map --pop D:\data\AG.pop --outgen D:\data\output --block 4 --rn 100,200,300,400
java -jar kG2P.jar --ped D:\data\AG.ped --map D:\data\AG.map --pop D:\data\AG.pop --outgen D:\data\output --rn 100,200,300,400
java -jar kG2P.jar --ped D:\data\AG.ped --map D:\data\AG.map --pop D:\data\AG.pop --outgen D:\data\output --impute --rn 100,200,300,400
java -jar kG2P.jar --ped D:\data\AG.ped --map D:\data\AG.map --pop D:\data\AG.pop --outgen D:\data\output --rn 100 --mutation 0.0001 --mig 0.1 --genetic 0.001
java -jar kG2P.jar --ped D:\data\AG.ped --map D:\data\mydata.map --pop D:\data\mydata.pop --outgen D:\data\output –-rn 100 --genetic 0.003
jar: executive software
ped: ped file
map: map file
pop: pop file
outgen: output path
block: number of SNPs in each block
rn: simulated sample size
mutation: the frequency of new mutations
mig: the ratio of immigrants (or emigrants) for each group
genetic: genetic drift, which is the change in the frequency of an existing gene variant (allele) in a population due to random sampling of organisms
impute: if 'impute' is added, major allele will be used to impute missing values
Random Simulation _ GUI
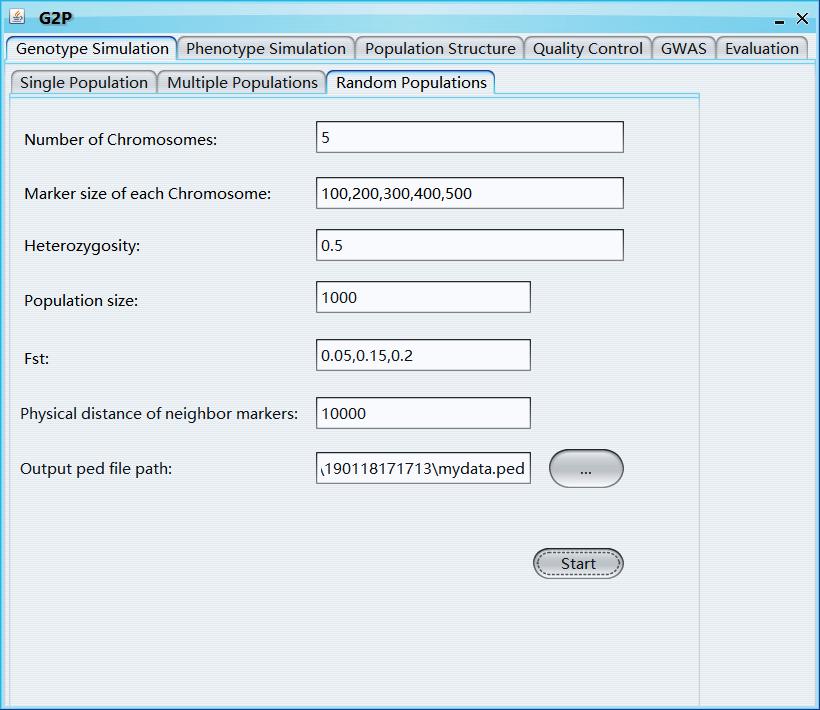
Number of Chromosomes: total number of Chromosomes for each newly simulated sample
Marker size of each Chromosome: a vector, marker size of each Chromosome
Heterozygosity: average heterozygosity of all markers
Population size: Sample size of new generated population
Fst: fixation index
Physical distance of neighbor markers: Physical distance between neighbor markers
Output ped file path: output path of ped file
Random Simulation _ Pipeline
Windows
java -jar kG2P.jar --sample 100 --chr 5 --marker 100,200,300,400,500 --d 500 --outgen D:\data\output
java -jar kG2P.jar --sample 100,200,300 --chr 5 --marker 100,200,300,400,500 --d 500 --outgen D:\data\output --heter 0.5 --Fst 0.05,0.15,0.2
Linux/Mac
java -jar kG2P.jar --sample 100 --chr 5 --marker 100,200,300,400,500 --d 500 --outgen /root/data/output
java -jar kG2P.jar --sample 100,200,300 --chr 5 --marker 100,200,300,400,500 --d 500 --outgen /root/data/output --heter 0.5 --Fst 0.05,0.15,0.2
jar: executive software
sample: simulated sample size
chr: Number of Chromosomes
marker: SNP markers for each Chromosome
d: physical distance (base pairs) between nearby markers
outgen: output path
heter: average heterozygosity of all markers
Fst: fixation index
Phenotype Simulation
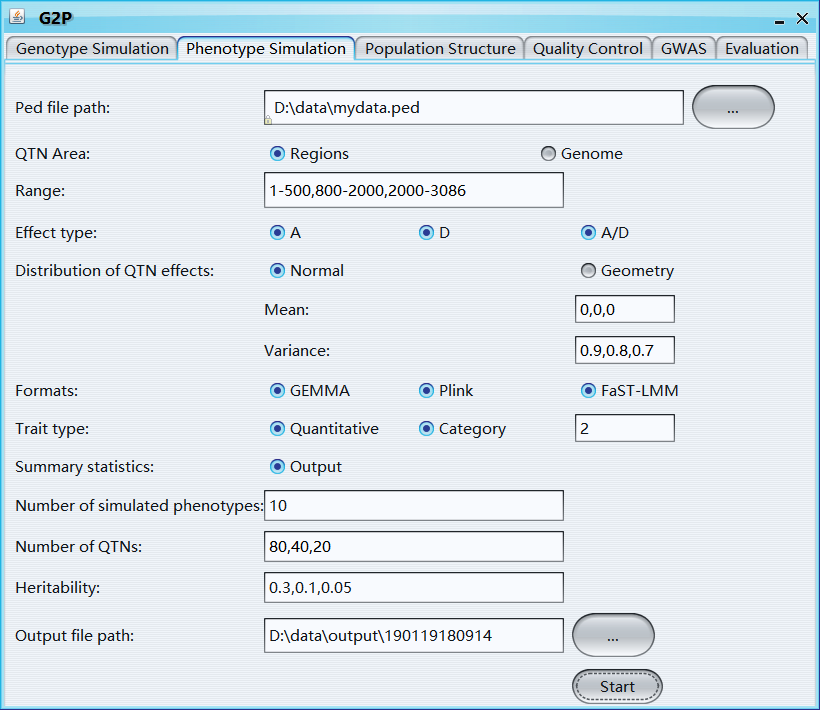
Phenotype _ GUI
Normal distribution
Geometry distribution

Ped file path: path of ped file
QTN area: the genomic area that used to select QTNs
Range: if 'QTN area' is 'Yes', 'range' can be used to set the 'QTN area'
Effect type: three options for QTN effect type, including A, A+D, A+D+A/D, A represents Additive effect and D represents Dominance effect
Distribution of QTN effects: two options, 'Normal' and 'Geometry'
Mean: mean value of the normal distribution, length of 'Mean' should be the same with 'Variance'
Variance: variance of the normal distribution
Formats: phenotype formats of 'GEMMA', 'Plink', and 'FaST-LMM' soft wares
Trait type: quantitative or category
Summary statistics: output the summary statistics information of simulated phenotypes, includes QTN ID, Chromosome, Physical Position, effects of additive, dominance, and additive-dominance interaction, and heritability
Number of simulated phenotypes: number of simulated phenotypes
Number of QTNs: number of QTNs, if it is a vector, effect of different QTN group will follow different distributions; The length of 'Number of QTNs', 'Mean', and 'Variance' should be same
Heritability: heritability, a vector with length equals to number of ‘Effect type’
Output file path: output file path
Phenotype _ Pipeline
Windows
java -jar kG2P.jar --ped D:\data\AG.ped --outgen D:\data\output --rep 100 --dis geo 0.99 --h2 0.5 --nqtn 100 --QTNarea 1-500,1000-1500
java -jar kG2P.jar --ped D:\data\AG.ped --outgen D:\data\output --rep 10 --dis geo 0.99,0.88,0.77 --h2 0.3,0.1,0.05 --nqtn 80,40,20 --QTNarea 1-500,1000-1500 --effect A/D --category 2 --summary
Linux/Mac
java -jar kG2P.jar --ped /root/data/AG.ped --outgen /root/data/output --rep 100 --dis geo 0.99 --h2 0.5 --nqtn 100 --QTNarea 1-500,1000-1500
java -jar kG2P.jar --ped D:\data\AG.ped --outgen D:\data\Part2out --rep 100 --dis geo 0.99 --h2 0.5 --nqtn 100
java -jar .\kG2P.jar --ped D:\data\AG.ped --outgen D:\data\output --rep 10 --dis geo 0.99,0.88 --h2 0.5 --nqtn 10,20 --QTNarea 1-500,1000-1500
java -jar KG2P.jar --ped D:\data\AG.ped --outgen D:\data\Part2out --rep 100 --dis nor --m 0,0.1 --v 0.99,0.98 --h2 0.5 --nqtn 10,20 --QTNarea 1-500,1000-1500
java -jar kG2P.jar --ped /root/data/AG.ped --outgen /root/data/output --rep 10 --dis geo 0.99,0.88 --h2 0.3,0.1 --nqtn 80,40 --effect D --category 4
java -jar kG2P.jar --ped /root/data/AG.ped --outgen /root/data/output --rep 10 --dis nor --h2 0.5 --m 0 --v 0.99 --nqtn 100 --effect A --category 2
java -jar kG2P.jar --ped /root/data/AG.ped --outgen /root/data/output --rep 10 --dis nor --h2 0.3 --m 0.2 --v 0.88 --nqtn 100 –summary
java -jar kG2P.jar --ped /root/data/AG.ped --outgen /root/data/output --rep 10 --dis nor --h2 0.5 --m 0 --v 0.99 --nqtn 100 --effect A/D --category 2
jar: executive software
rep: number of simulated phenotypes
dis: distribution of QTN effects, two options, 'nor' and 'geo'
m: mean value of the normal distribution
v: variance of the normal distribution
QTNarea: the genomic area that used to select QTNs
h2: heritability
nqtn: number of QTNs, if it is a vector, the effects of different QTN groups will follow different distributions, and the length of nqtn, m, and v should be same
effect: three options for QTN effect type, including A (A), A+D (D), A+D+A/D (A/D)
category: number of categories for simulated phenotypes
Population Structure
Population structure _ GUI
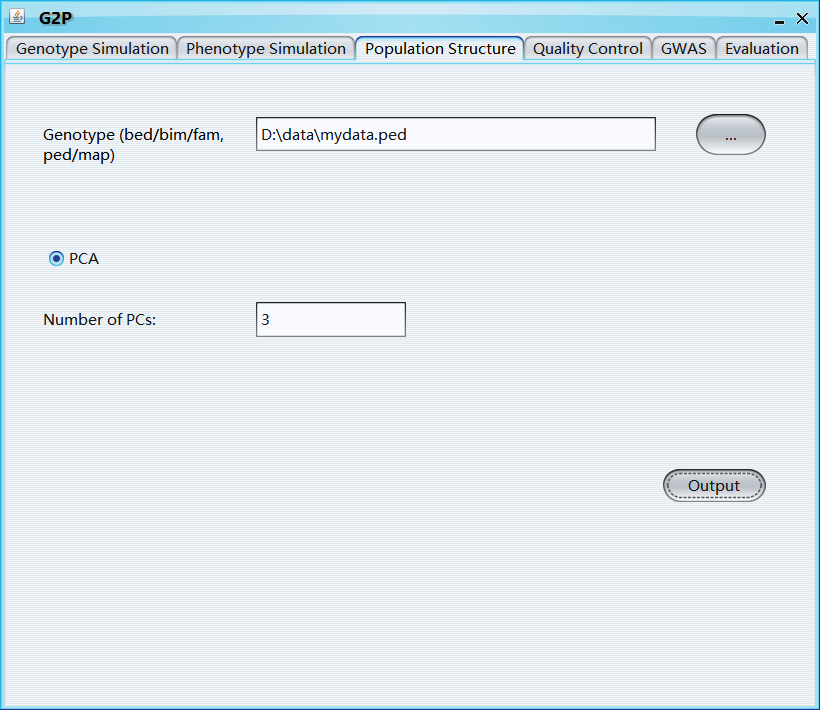
Genotype (bed/bim/fam, ped/map): select genotype file
PCA: select if you want to calculate principle components
Number of PCs: number of PCs will be calculated and generated
Kinship: select if you want to calculate Kinship matrix
Population structure _ Pipeline
PC _ Windows
java -jar kG2P.jar --pre "plink --bfile D:\data\AG --pca 3 --out D:\data\AG"
PC _ Linux/Mac
java -jar kG2P.jar --pre "./plink --bfile /root/data/AG --pca 3 --out /root/data/AG"
Kinship _ Linux/Mac
java -jar kG2P.jar --pre "./gemma -bfile /root/data/AG -gk -o testgemma"
jar: executive software
pre: pipeline of the software you want to use, attention that the software should be put in the same path as kG2P.jar
Quality Control
Quality control _ GUI
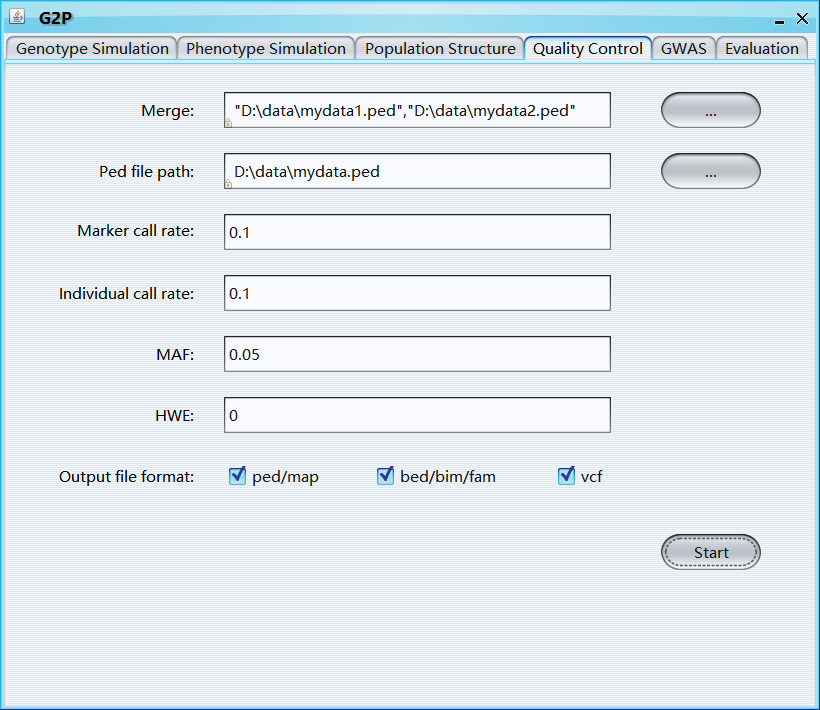
Merge: merge multiple selected genotype file
Ped file path: path of ped file
Marker call rate: filters out all markers with missing call rates exceeding the provided value
Individual call rate: filters out all individuals with missing call rates exceeding the provided value
MAF: threshold of minor allele frequency
HWE: Hardy-Weinberg equilibrium test p-value threshold
Output file format: the format of output genotype file
Quality control _ Pipeline
Merge _ Windows
java -jar kG2P.jar --mergePED D:\data\mydata1.ped D:\data\mydata2.ped
Merge _ Linux/Mac
java -jar kG2P.jar --mergePED /root/data/mydata1.ped /root/data/mydat2.ped
QC _ Windows
java -jar .\kG2P.jar --ped "D:\data\mydata.ped" --geno 0.1 --mind 0.1 --maf 0.05 --hwe 0 --format pbv
java -jar .\kG2P.jar --ped "D:\data\mydata.ped" --geno 0.1 --mind 0.1 --maf 0.05 --hwe 0 --format b
QC _ Linux/Mac
java -jar ./kG2P.jar --ped /root/data/mydata.ped --geno 0.1 --mind 0.1 --maf 0.05 --hwe 0 --format pbv
java -jar kG2P.jar --ped /root/data/mydata.ped --geno 0.1 --mind 0.1 --maf 0.08 --hwe 0 --format bv
jar: executive software
mergePED: merge multiple genotype files prepared in ped format
geno: filters out all markers with missing call rates exceeding the provided value
mind: filters out all individuals with missing call rates exceeding the provided value
maf: threshold of minor allele frequency
hwe: Hardy-Weinberg equilibrium test p-value threshold
format: three options, including p(ped/map), b(bed/bim/fam), and v(vcf)
GWAS
GWAS _ GUI
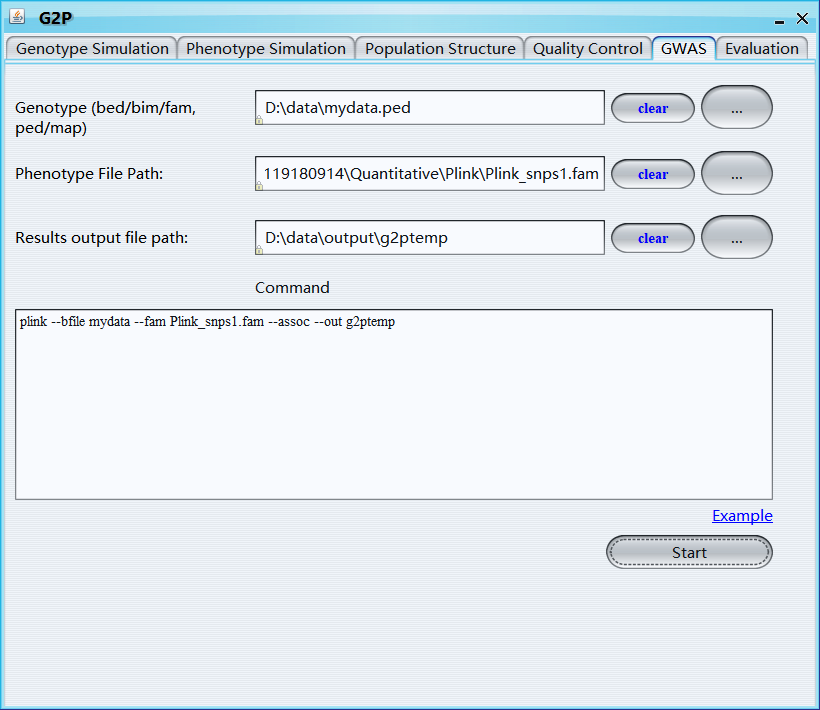
Genotype (bed/bim/fam, ped/map): select genotype file
Phenotype file path: select the first phenotype file, all phenotypes in the same path will be analyzed one by one; name of the phenotype file must include a continuous order number, e.g., 'phenotype1.txt', 'phenotype2.txt', 'phenotype3.txt'
Results output file path: select output file path
Command: command for running gwas of the first phenotype, user-specific covariates files and kinship file can be also included in the command line, note that the output file name must be ‘g2ptemp’
R package _ Windows
Take FarmCPU (an R package) as an example:
Download and install essential packages for FarmCPU from http://www.zzlab.net/FarmCPU/index.html;
If the script for running FarmCPU is stored in Demo_script.R and the path of Rscript.exe is "E:\R\R-3.4.0\bin\x64\Rscript.exe", the command line should be written as: E:\R\R-3.4.0\bin\x64\Rscript.exe Demo_script.R
GWAS _ Pipeline
Plink _ Windows
java -jar kG2P.jar --GWAS "plink --bfile D:\data\AG --fam D:\data\out\171104010413\Plink\Plink_snps1.fam --assoc --out D:\data\g2ptemp" --sp Plink_snps1.fam
Plink _ Linux/Mac
java -jar kG2P.jar --GWAS "./plink --bfile /root/data/AG --fam /root/data/output/171104010413/Plink/Plink_snps1.fam --assoc --out /root/data/g2ptemp" --sp Plink_snps1.fam
Gemma _ Linux/Mac
java -jar kG2P.jar --GWAS "./gemma -bfile /root/data/AG -p /root/data/out/171104030401/GEMMA/GEMMA_phenotype1.txt -k /root/output/testgemma.cXX.txt -lmm 4 -o g2ptemp" --sp GEMMA_phenotype1.txt
jar: executive software
GWAS: command line used for running gwas of the first phenotype
sp: the first phenotype file, the file path is not needed
jar: executive software
GWAS: command line used for running gwas of the first phenotype
sp: the first phenotype file, the file path is not needed
Method Evaluation
Method Evaluation _ GUI

Map file: map file
QTN file: qtn file
GWAS result files path: path of gwas results
Column number of P values: column number of P values
Window size: A window is considered to be identified if a positive genetic marker is detected within the window
Output file path: output path of power/fdr evaluation results
Method Evaluation _ Pipeline
Evaluation of the methods in Plink _ Windows
java -jar kG2P.jar --map D:\data\AG.map --qtn D:\data\output\170106093742\qtn\test.qtn --gwas D:\data\output\Plink_snps1.qassoc --pv 9 --out D:\data\output
java -jar kG2P.jar --map D:\data\AG.map --qtn D:\oldoutput\190120151328\qtn\test.qtn --gwas D:\oldoutput\Plink_snps1.qassoc --pv 9 --out D:\data\output --WS 2,2000,200000,200000000
Evaluation of the methods in Plink _ Linux/Mac
java -jar kG2P.jar --map /root/data/AG.map --qtn /root/data/output/171104030401/qtn/test.qtn --gwas /root/data/output/Plink_snps1.qassoc --pv 9 --out /root/data/output
java -jar kG2P.jar --map /root/data/AG.map --qtn /root/data/output/171104030401/qtn/test.qtn --gwas /root/data/output/Plink_snps1.qassoc --pv 9 --out /root/data/output --WS 3,300,3000,30000,300000,3000000
Evaluation of the methods in Gemma _ Linux/Mac
java -jar kG2P.jar --map /root/data/AG.map --qtn /root/data/output/171104030401/qtn/test.qtn --gwas /root/output/GEMMA_phenotype1.assoc.txt --pv 9 --out /root/data/output
jar: executive software
map: map file
qtn: qtn file
gwas: the first gwas result file, there is a one-to-one mapping between gwas result files and columns in the qtn file
pv: column number of P values
out: output file path
WS: Window size, a window is considered to be identified if a positive genetic marker is detected within the window
Citations
For G2P: Please cite: You Tang, Xiaolei Liu; G2P: A Genome-Wide-Association-Study Simulation Tool for Genotype Simulation, Phenotype Simulation, and Power Evaluation, Bioinformatics, btz126, https://doi.org/10.1093/bioinformatics/btz126
For principle components analysis:
    if you use plink, please also cite: Purcell S, et.al. "PLINK: A Tool Set for Whole-Genome Association and Population-Based Linkage  Analyses." American Journal of Human Genetics, 81.3(2007):559-575.
For calculating kinship matrix:
    if you use gemma, please also cite: Zhou, X., et.al. "Genome-wide Efficient Mixed Model Analysis for Association Studies." Nature Genetics, 44.7(2012):821.
Please cite all soft wares you used for GWAS and evaluation!
