MAP Save
mean Average Precision - This code evaluates the performance of your neural net for object recognition.
mAP (mean Average Precision)

This code will evaluate the performance of your neural net for object recognition.

In practice, a higher mAP value indicates a better performance of your neural net, given your ground-truth and set of classes.
Citation
This project was developed for the following paper, please consider citing it:
@INPROCEEDINGS{8594067,
  author={J. {Cartucho} and R. {Ventura} and M. {Veloso}},
  booktitle={2018 IEEE/RSJ International Conference on Intelligent Robots and Systems (IROS)},
  title={Robust Object Recognition Through Symbiotic Deep Learning In Mobile Robots},
  year={2018},
  pages={2336-2341},
}
Table of contents
Explanation
The performance of your neural net will be judged using the mAP criterium defined in the PASCAL VOC 2012 competition. We simply adapted the official Matlab code into Python (in our tests they both give the same results).
First (1.), we calculate the Average Precision (AP), for each of the classes present in the ground-truth. Finally (2.), we calculate the mAP (mean Average Precision) value.
1. Calculate AP
For each class:
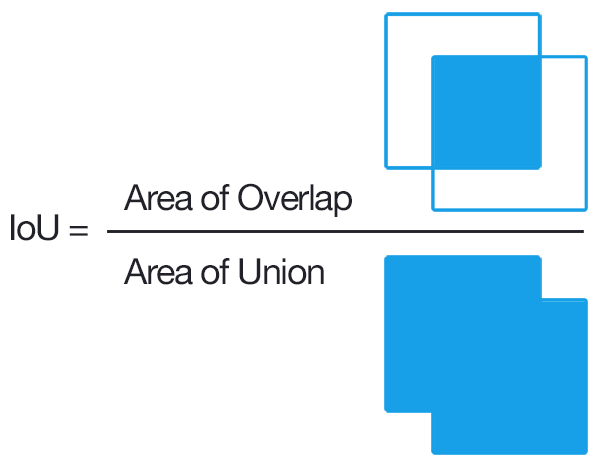
First, your neural net detection-results are sorted by decreasing confidence and are assigned to ground-truth objects. We have "a match" when they share the same label and an IoU >= 0.5 (Intersection over Union greater than 50%). This "match" is considered a true positive if that ground-truth object has not been already used (to avoid multiple detections of the same object).
Using this criterium, we calculate the precision/recall curve. E.g:
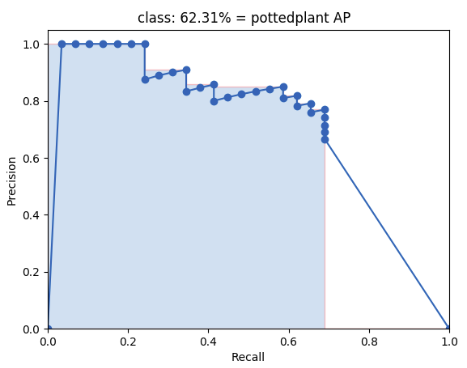
Then we compute a version of the measured precision/recall curve with precision monotonically decreasing (shown in light red), by setting the precision for recall r to the maximum precision obtained for any recall r' > r.
Finally, we compute the AP as the area under this curve (shown in light blue) by numerical integration. No approximation is involved since the curve is piecewise constant.
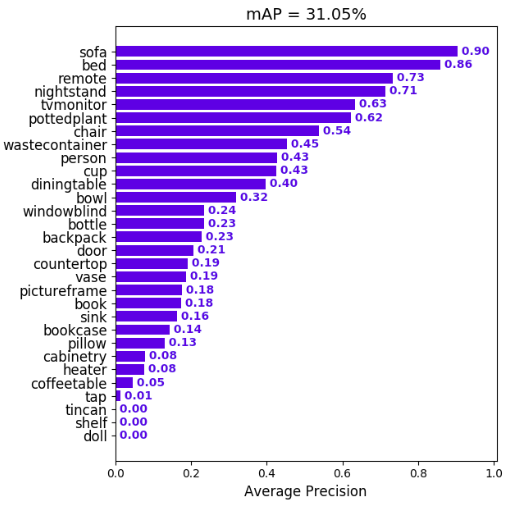
2. Calculate mAP
We calculate the mean of all the AP's, resulting in an mAP value from 0 to 100%. E.g:
Prerequisites
You need to install:
Optional:
-
plot the results by installing Matplotlib - Linux, macOS and Windows:
-
python -mpip install -U pip -
python -mpip install -U matplotlib
-
- show animation by installing OpenCV:
-
python -mpip install -U pip -
python -mpip install -U opencv-python
-
Quick-start
To start using the mAP you need to clone the repo:
git clone https://github.com/Cartucho/mAP
Running the code
Step by step:
- Create the ground-truth files
- Copy the ground-truth files into the folder input/ground-truth/
- Create the detection-results files
- Copy the detection-results files into the folder input/detection-results/
- Run the code:
python main.py
Optional (if you want to see the animation):
- Insert the images into the folder input/images-optional/
PASCAL VOC, Darkflow and YOLO users
In the scripts/extra folder you can find additional scripts to convert PASCAL VOC, darkflow and YOLO files into the required format.
Create the ground-truth files
- Create a separate ground-truth text file for each image.
- Use matching names for the files (e.g. image: "image_1.jpg", ground-truth: "image_1.txt").
- In these files, each line should be in the following format:
<class_name> <left> <top> <right> <bottom> [<difficult>] - The
difficultparameter is optional, use it if you want the calculation to ignore a specific detection. - E.g. "image_1.txt":
tvmonitor 2 10 173 238
book 439 157 556 241
book 437 246 518 351 difficult
pottedplant 272 190 316 259
Create the detection-results files
- Create a separate detection-results text file for each image.
- Use matching names for the files (e.g. image: "image_1.jpg", detection-results: "image_1.txt").
- In these files, each line should be in the following format:
<class_name> <confidence> <left> <top> <right> <bottom> - E.g. "image_1.txt":
tvmonitor 0.471781 0 13 174 244
cup 0.414941 274 226 301 265
book 0.460851 429 219 528 247
chair 0.292345 0 199 88 436
book 0.269833 433 260 506 336
Authors:
-
João Cartucho
Feel free to contribute

