DebuggableContext Save
Provides an easy to use action sheet for debugging purpose when shaking your iOS device.
DebuggableContext
DebuggableContext provides an easy to show an action sheet for debugging purpose when shaking your iOS device or simulator.
Usage
-
Make your class (usually a view controller) to extend
DebuggableContext. It defines the items which should be displayed in debug menu:#if DEBUG extension ViewController: DebuggableContext { var debugMenus: [DebuggableContextItem] { return [ .init(name: "Color To Cupid") { [weak self] in self?.view.backgroundColor = UIColor(red:0.94, green:0.73, blue:0.83, alpha:1.00) }, .init(name: "Color To Mint") { [weak self] in self?.view.backgroundColor = UIColor(red:0.71, green:0.96, blue:0.82, alpha:1.00) } ] } } extension AnotherViewController: DebuggableContext { var debugMenus: [DebuggableContextItem] { return [ .init(name: "Say Hello") { print("Hello World!") } ] } } #endif -
Call
registerDebugat proper time. For view controllers,viewDidLoadwould be a good choice:// In both ViewController and AnotherViewController override func viewDidLoad() { super.viewDidLoad() #if DEBUG registerDebug() #endif } -
Replace
var window: UIWindow?in yourAppDelegateto:#if DEBUG var _shakeDetectingWindow: ShakeDetectingWindow? var window: UIWindow? { get { return _shakeDetectingWindow ?? { _shakeDetectingWindow = ShakeDetectingWindow(frame: UIScreen.main.bounds) return _shakeDetectingWindow }() } set {} } #else var window: UIWindow? #endif -
Run your app, and trigger a shake gesture (shake on a real device or Ctrl+Cmd+Z on simulator), a debug action sheet will be presented from the top most view controller:
Installation
No plan for CocoaPods or Carthage support currently (as it is still tiny).
Just grab DebuggableContext.swift and throw it to your project, then you could begin to play with it.
FAQ
Any overhead?
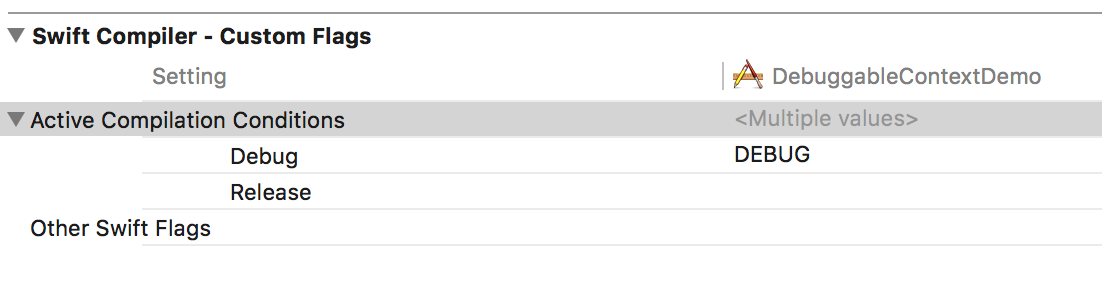
No. Everything including DebuggableContext itself is wrapped with #if DEBUG compilation condition. So as long as you set the in the SWIFT_ACTIVE_COMPILATION_CONDITIONS only for your Debug configuration (by default it is set automatically when you create a project in Xcode), it will not even contained in your release build.
It does not compile in Release mode.
Check you have wrapped your debuggable context related code in #if DEBUG.
It's too noisy when I have added too much context.
Make your presenting view controller to extend DebuggableContextFiltering, and filter the ones you need. An example to only allow context menu defined as self:
extension AnotherViewController: DebuggableContextFiltering {
    func filterContext(target: DebuggableContext) -> Bool {
        return  target === self
    }
}
There is also a console log before an action sheet being displayed, to tell you which view controller is the presenting view controller.
Do I need to call unregisterDebug() myself?
No. The registered context will be removed automatically when it gets deinited. However, you are free to call it whenever you want, to remove it from the next shake gesture.
