Akka Monitoring Save
Monitoring system instrumentation for Akka.NET actor systems
Akka.Monitoring
Pluggable monitoring system instrumentation for Akka.NET actor systems.
Phobos vs. Akka.Monitoring
![]()
In 2018 Petabridge, the makers of Akka.Monitoring, published a propreitary product for Akka.NET monitoring and tracing called Phobos.
Phobos is much more fully-featured than Akka.Monitoring, as it:
- Doesn't require users to decorate their actors with any code - monitoring and tracing happens automatically;
- Supports a much larger number of metric systems and types out of the box;
- Includes traceability with actors, including over the network with Akka.Remote, and other parts of your system such as ASP.NET Core; and
- Comes with 1 business day SLA support for Phobos and installing it into your Akka.NET applications.
That said, a Phobos license costs your company $4,000 per year.
It's the belief of Petabridge that there should be a low-cost alternative to that in order to make Akka.NET accessible to students, startups, DIY developers, and anyone who doesn't want to pay for that license. That's what Akka.Monitoring is - a simple, straightforward alternative that is free and open source. We will continue to support Akka.Monitoring and respond to end-user requests, but you should expect the majority of our development efforts to go into Phobos.
Please open an issue or contact Petabridge if you have any questions.
What it is
Akka.Monitoring is an ActorSystem extension for Akka.NET that exposes a pluggable layer for reporting performance metrics from actors back to a monitoring system such as Etsy's StatsD or Graphite or Microsoft AppInsights.
Akka.Monitoring can report to multiple monitoring systems simultaneously and it can report different metrics for different discrete ActorSystems inside the same process without any collisions. It offers high-performance, a simple interface, and the ability to be easily extended in order to support new monitoring systems.
What does Akka.Monitoring monitor?
Akka.Monitoring collects the following pieces of data about your applications:
- Actor lifecycle - actor starts / stops / restarts per second.
- Akka log events - errors, warnings, debug messages, and info messages.
- Messaging metrics - messages received, unhandled messages, and dead letters.
- Custom counters, gauges, and timers - if you want to know how long it takes an actor to process a message inside its mailbox, Akka.Monitoring can time it.
Akka.Monitoring automatically breaks out all of these metrics by actor system totals AND metrics for individual actor types. That way you can identify overly chatty or unresponsive actors without having to dig through extensive logs.
Supported monitoring systems
Currently Akka.Monitoring supports the following monitoring systems out of the box:
- StatsD - via a lightweight dependency on NStatsD.
- Microsoft AppInsights
- Performance Counters
If you don't have any monitoring systems configured to run with Akka.Monitoring, no problem - the extension will no-op all stat collection calls by default.
How you use it
First thing you want to do is install the Akka.Monitoring packages via NuGet:
Install-Package Akka.Monitoring
And then install a specific implementation
Install-Package Akka.Monitoring.StatsD
Install-Package Akka.Monitoring.ApplicationInsights
Install-Package Akka.Monitoring.PerformanceCounters
Register monitors with your ActorSystem
Once that's done, programmatically register your monitoring agent with the ActorMonitoringExtension object like this:
using Akka;
using Akka.Monitoring;
using Akka.Monitoring.StatsD;

_system = ActorSystem.Create("akka-performance-demo");
var registeredMonitor = ActorMonitoringExtension.RegisterMonitor(_system, new ActorStatsDMonitor()); //new ActorAppInsightsMonitor(), new ActorPerformanceCountersMonitor ();
This will automatically register the AkkaStatsDMonitor monitoring agent with your ActorSystem, and it will be available for use immediately.
Record metrics inside your actors
Now that you have your monitor registered, you can begin recording metrics - there are two ways of doing this:
Record metrics via the ActorContext extension methods
You can record all of your metrics directly off of the Context object inside each of your actors, like this:
class HelloActor : TypedActor, IHandle<string>
{
    protected override void PreStart()
    {
        Context.IncrementActorCreated();
    }

    protected override void PostStop()
    {
        Context.IncrementActorStopped();
    }

    public void Handle(string message)
    {
        Context.IncrementMessagesReceived();
        Console.WriteLine("Received: {0}", message);
        if (message == "Goodbye")
        {
            Context.Self.Stop();
            Program.ManualResetEvent.Set(); //allow the program to exit
        }
        else
            Sender.Tell("Hello!");
    }
}
Alternatively, if you need to be able to record some custom metrics without the Context object, you can use the ActorMonitoringExtension object directly.
Record metrics via the ActorMonitoringExtension methods
using Akka;
using Akka.Monitoring;
using Akka.Monitoring.StatsD;

_system = ActorSystem.Create("akka-performance-demo");
var registeredMonitor = ActorMonitoringExtension.RegisterMonitor(_system, new ActorStatsDMonitor());
ActorMonitoringExtension.Monitors(_system).IncrementDebugsLogged();
Console.WriteLine("Logging debug...");
Metric capture methods
Both of these techniques expose the following methods available for capturing metrics:
-
IncrementActorsCreated -
IncrementActorsRestarted -
IncrementActorsStopped -
IncrementMessagesReceived -
IncrementUnhandledMessages- logged automatically -
IncrementDeadLetters- logged automatically -
IncrementErrorsLogged- logged automatically -
IncrementWarningsLogged- logged automatically -
IncrementDebugsLogged- logged automatically -
IncrementInfosLogged- logged automatically -
IncrementCounter- for custom counters. -
Timing- for timing custom events, such as the amount of time needed to process a mailbox. -
Gauge- for recording arbitrary non-counter metrics, such as the average size of a message.
All of these methods have extensive Intellisense documentation.
Using Performance Counters
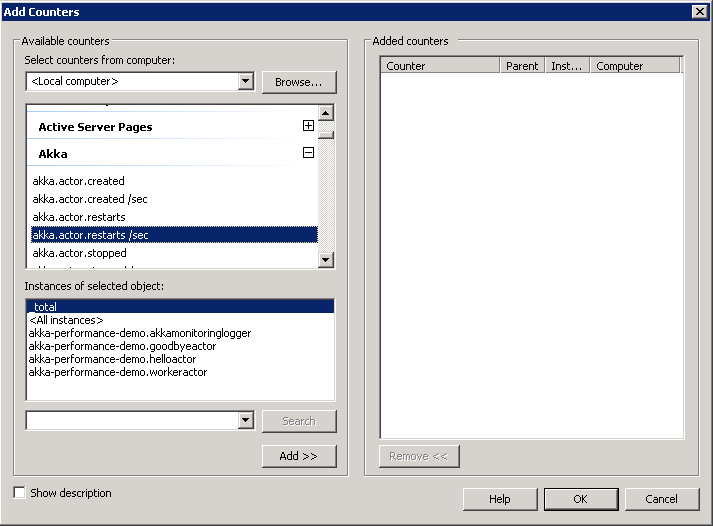
Akka.Monitoring.PerformanceCounters allows to track all metrics in perfmon. Once ActorPerformanceCountersMonitor is registered via ActorMonitoringExtension it automatically creates Performance Counters Category named Akka which contains all metrics related with agents events. There is one performance counter created for every metric (built-in or custom). Also, for every actor type there is performance counter instance which allows to track metrics per single actor class:
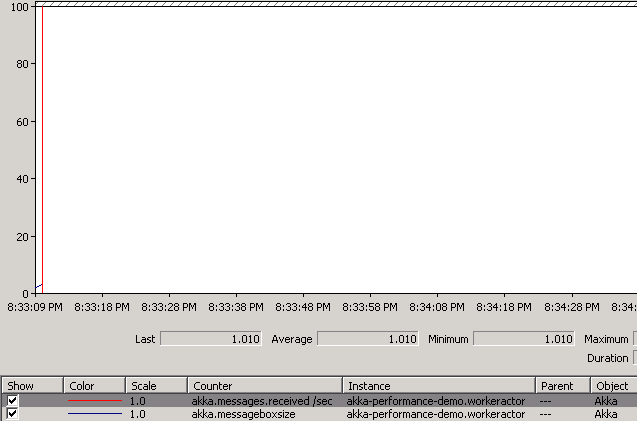
An example of perfmon chart displaying metrics from Akka.Monitoring.PerformanceCounters.Demo:
Custom metrics registration
In order to create custom counters, timing metrics and gauges, you need to provide CustomMetrics with metric names to ActorPerformanceCountersMonitor constructor:
var registeredMonitor = ActorMonitoringExtension.RegisterMonitor(_system,
    new ActorPerformanceCountersMonitor(
        new CustomMetrics
        {
            Counters = { "akka.custom.metric1", "akka.custom.metric2" },
            Gauges = { "akka.messageboxsize"},
            Timers = { "akka.handlertime" }
        }));
Metric names will become performance counter names, so make sure they are unique among Akka Pefmormance Counters Category.
One gotcha to be aware of is that .NET performance counters cannot be added to an existing category. If you have to add counters to categories that already exist, the only way you can do so is to delete the category and re-create it with all of its contents. So if you find that you are adding custom metrics and nothing is appearing in Perfmon then you may need to delete the Akka performance counter category. Additionally, performance counters don't always show up straightaway so you may need to give it some time. To delete the Counter category you can remove the following key in the windows registry:
HKEY_LOCAL_MACHINE\SYSTEM\CurrentControlSet\Services\Akka\Performance (not recommended in production code!)
Extending Akka.Monitoring
Have a different monitoring system you want to use? It's easy to integrate into Akka.Monitoring - just implement your own subclass from AbstractActorMonitoringClient (source) and follow the registration steps above.
Building Akka.Monitoring
Akka.Monitoring uses the F# FAKE build system. To build our NuGet packages locally, just execute build.cmd locally.
FAQ
What happens if I call Akka.Monitoring without having any monitors registered?
Nothing - all calls are automatically no-oped if no monitors have been registered, so you're safe to release instrumented code even if you don't have monitoring configured yet.
What happens if I call Akka.Monitoring with multiple monitors registered?
Akka.Monitoring will automatically pipe its counter / timer / gauge updates to all attached monitoring systems, so you get that data everywhere.
Any plans to automatically collect actor lifecycle and message received data?
That depends largely on how much traction Akka.Monitoring gets - we're considering subclassing UntypedActor and TypedActor to automatically provide lifecycle and receive instrumentation, but we want to see how other people use it first.
How in the hell do I configure StatsD and Graphite?
These may help you:
- Installing StatsD and Graphite on Ubuntu 12.04 LTS
- Install Graphite and statsd on Ubuntu 12.04 LTS (Precise Pangolin)
- Installing Graphite on Ubuntu 14.04
License
See License for details.
